Advance Option Trading Option trading is largely a skill requiring knowledge of market trends, strategies, and risk management techniques. While there is an element of uncertainty in the markets, successful traders rely on analysis, planning, and discipline rather than luck.18 Dec 2024
Even though successful options trading can be immensely profitable and financially liberating, you need to set your life up so you can afford to get good at trading without worrying about money and stress. It is possible, but trading is not a way to get rich quickly or without effort.
BANKNIFTY

PCR / Put Call RatioA PCR greater than 1 indicates that more put options are being traded than call options, suggesting a bearish market sentiment. Investors may expect a market decline or hedge against potential losses.
PCR ratio = 1500/2000. = 0.75. Points to be noted: A PCR value below 1 is indicative of the fact that more Call options are being purchased relative to the Put options which signals that investors are anticipating a bullish outlook for the markets ahead.
Contrarian indicator: Can signal potential market reversals with extreme values of the put/call ratio. An example of this is a put/call ratio of 2.5. This can suggest a very bearish sentiment while a put/call ratio such as 0.25, could indicate an extreme bullish sentiment.

Support and Resistance 'Support' and 'resistance' are terms for two respective levels on a price chart that appear to limit the market's range of movement. The support level is where the price regularly stops falling and bounces back up, while the resistance level is where the price normally stops rising and dips back down.
The basic strategy is to buy at the support level and sell at the resistance level, recognizing that these are zones of potential demand and supply changes. How does resistance work?

TradingOne of the most effective ways of studying is to carve space out between sessions. If you break up your study load over several days, you'll retain information far more readily than if you crammed it into your head during one long session.
Day trading and swing trading are two very different approaches to short-term investing. If you're more interested in an exciting, higher-risk environment that requires greater attention, day trading is better for you. Otherwise, the slower, more methodical path of swing trading might be a better option.

Advanced Swing Trading for Option TraderSwing traders analyze stock price patterns to anticipate when prices will rise, allowing them to buy low, and when prices will fall, enabling them to sell high. The goal of swing trading is to make money by buying a stock or option at a low price and selling it later at a higher price.
The 1% rule restricts Day Traders' risk to no more than 1% of their total account value on any given trade. Trading large positions with close stop-losses or small positions with stop-losses far from the entry price allows traders to risk 1% of their account, but it also involves the risk of daily volatility.

Important Video for Trader'sTake regular breaks when you are reading or studying. Reading for short periods of time of about 20-30 minutes should be enough to really focus on the text and take in as much as possible. 7. Read in a positive environment that is comfortable and free of distractions as this will help improve your concentration.
The 60-60-50 RSI strategy is a trading strategy that generates buy/sell signals by analysing the RSI across multiple timeframes. This course will teach you the logic of the 60-60-50 strategy and how to apply it.

Divergence Trading An RSI divergence occurs when the indicator and price begin to reach different levels, indicating a change in momentum that precedes a change in price direction. For example, a bullish divergence occurs when the security makes a lower low but the indicator forms a higher low.
What is the best RSI setting for divergence? The default RSI setting is a 14-period, which works well for most traders. However, shorter settings (like 7) increase signal sensitivity, while longer settings (like 21) reduce noise and offer more reliable signals, especially for long-term trading.

Trading Management and PsychologyTrading psychology refers to the mental state and emotions of a trader that determines the success or failure of a trade. It represents the aspects of a trader's behavior and characteristics that influence the actions they take when trading securities.
A professional trader knows that in trading it's 10% and the rest 90% is psychology. If you mastered the psychology in trading then you have almost cracked the code of trading. Psychology is a big factor in trading, it can make or break the trader from the market.

Roadmap for a TraderA trading roadmap is essentially a strategic plan that guides your trading decisions. It encompasses your goals, risk management strategies, analysis methods, and decision-making processes. Think of it as a personalized guide that helps you make informed choices in the dynamic world of trading.
By recognising specific patterns like the Cup and Handle or Double Bottom, traders can identify moments when the market is likely to make a significant move. These patterns signal potential price swings, providing traders with a roadmap for entering positions at the optimal time.

#Banknifty directions and levels for January 30th:Bank Nifty Current View
The current view for Bank Nifty is similar to that of Nifty. If the market pulls back, it could reach a minimum of 49,381 to 49,400, which is a rejection zone. If it consolidates or breaks this level, we can expect further continuation. On the other hand, if it gets rejected sharply there, we can expect a correction of at least 50% to 78% in the current swing.
>For reversal confirmation, we can use the EMA20 on the 15-minute chart. In a directional market, this indicator works well, but if the market starts to grind, it may show some false signals.
Alternate View
The alternate view suggests that if the market starts to decline, it could reach a minimum of 48,850 when it breaks the 38% mark. If this happens, the demand zone will act as strong support, and structurally, we can expect a pullback here. However, we should note that if the market reaches this level in a straight line or consolidates without any pullback, the probability of further downside increases.

Bank nifty showing sign of bounce.Bank nifty is showing divergence on chart. Divergence repeats as like 6Aug 2024 to14 Aug 2014 as per chart. MACD also showing cross over. Bank nifty bounce is expected from here.

US10 Yrs. Bond Yield Form H&S pattern.As per H&S chart pattern, It may correct up to 4.24%, It means Nifty may bounce from here.

BANKNIFTY FUTURE - IMP LEVELS FOR JAN 30, 2025Expect a Sharp movement in bankNifty Future on Jan 30, 2025 as there are no major levels between the range 48500 and 49500.

Journey to become a profitable traderIt starts with an examination that tests trading proficiency and encourages risk management and discipline. Upon completing the examination, the trader will join a prop trading firm, receive a trading account and then grow that account by meeting fixed objectives and withdrawing their profit.
The 1% rule demands that traders never risk more than 1% of their total account value on a single trade. In a $10,000 account, that doesn't mean you can only invest $100. It means you shouldn't lose more than $100 on a single trade.

Trading With Professional The Put-Call Ratio (PCR) is a popular technical indicator used by investors to assess market sentiment. It is calculated by dividing the volume or open interest of put options by call options over a specific time period. A higher PCR suggests bearish sentiment, while a lower PCR indicates bullish sentiment.
A PCR at one (=1) suggests that investors are purchasing the same amount of put options as call options and signals a neutral trend going forward. No PCR is considered ideal, but a PCR below 0.7 is typically viewed as a strong bullish sentiment while a PCR above 1 is typically viewed as a strong bearish sentiment.

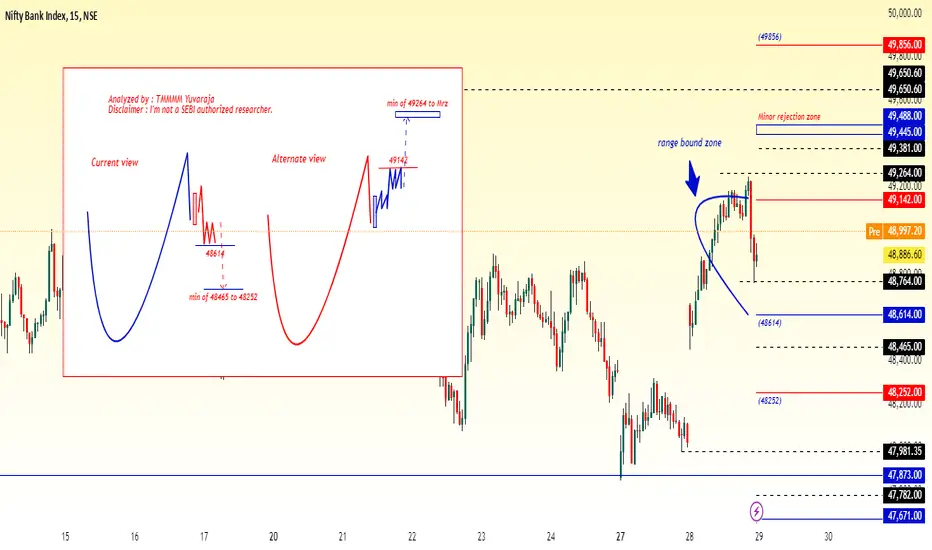
#Banknifty directions and levels for January 29th:Bank Nifty Current View:
The current structure in Bank Nifty is similar to Nifty. If the market declines initially, we can expect a correction towards 48614, which is a major support zone. If the market finds support here, it may bounce back to its opening level with a bullish bias.
> On the other hand, if the market breaks this zone or consolidates around it, the correction will likely continue towards 48465–48252.
Alternate View:
If the gap-up sustains, 49142 will act as strong resistance. If the market gets rejected at this level, we can expect a range-bound session. However, if it consolidates or breaks above this level, the rally will likely continue towards 49264, a minor rejection zone.
Nifty Trading Strategy for 29th january 2025Nifty Trading Strategy
Buy Strategy:
Buy Above: The high of the 15-minute candle that closed above 23,050
Targets: 23,090, 23,140, 23,190
Stop-Loss: Below the low of the 15-minute candle that closed above 23,050
Sell Strategy:
Sell Below: The low of the 15-minute candle that closed below 22,850
Targets: 22,803, 22,765, 22,725
Stop-Loss: Above the high of the 15-minute candle that closed below 22,850
Disclaimer:
I am not SEBI registered. This analysis is based on historical data and market trends. Past performance is not indicative of future results. Trading and investment involve risks, and you should conduct your own research or consult with a financial advisor before making any decisions.

Database Part-5An option chain lists data on calls and puts, underlying prices, strike prices, expiration, and moneyness. Call option data is listed to the right of the table. Put option data is listed to the left of the table. Strike prices are listed on rows in the centre of the table.
Avoid options with low liquidity; verify volume at specific strike prices. calls grant the right to buy, while puts grant the right to sell an asset before expiration. Utilise different strategies based on market conditions; explore various options trading approaches.

Trading with the DataDefine Your Risk Tolerance and Goals: Before diving into options trading, assess your risk tolerance and establish clear trading objectives. Understand how much risk you’re willing to take on and what you aim to achieve.
Diversify Your Options Strategies: Spread your risk by using various options strategies. Consider covered calls, protective puts, and other approaches to safeguard your investments.
Set Entry and Exit Points: Determine specific levels at which you’ll enter and exit trades.
Having clear guidelines helps you avoid emotional decisions during market fluctuations.
Limit Maximum Risk Per Trade: When buying options, consider using debit spreads. These allow you to define your maximum risk upfront while still benefiting from potential gains.

BANKNIFTY FUTURE IMP LEVELS FOR JAN 29, 2025Marking IMP bank nifty Levels which can help trader to decide trades at IMP levels at right time.

BANKNIFTY FUTURE IMP LEVELS FOR JAN 29, 2025Marking IMP bank nifty Levels which can help trader to decide trades at IMP levels at right time.

BANKNIFTY FUTURE IMP LEVELS FOR JAN 29, 2025Marking IMP bank nifty Levels which can help trader to decide trades at IMP levels at right time.

PCR (Put Call Ratio) Trading The Put-Call Ratio (PCR) is a popular technical indicator used by investors to assess market sentiment. It is calculated by dividing the volume or open interest of put options by call options over a specific time period. A higher PCR suggests bearish sentiment, while a lower PCR indicates bullish sentiment.
Here PCR is computed by dividing the put trading volume by the call trading volume on a specific day. Here, Put volume indicates the total put options initiated over a specific time-frame. Conversely, Call volume indicates the total call options initiated over a specific time-frame.
