what is option chain pcr ?The **Option Chain PCR (Put-Call Ratio)** is a ratio used by traders and analysts to gauge market sentiment and potential price direction. It is calculated by dividing the total open interest (OI) of **puts** by the total open interest of **calls** in a particular market or stock.
### Formula for PCR:
\
### What does PCR indicate?
- **PCR > 1**: This suggests that there are more open interest in puts than calls, which is generally considered a **bearish** signal, indicating that traders expect the price to decline.
- **PCR < 1**: This suggests that there are more open interest in calls than puts, which is generally considered a **bullish** signal, indicating that traders expect the price to rise.
- **PCR = 1**: This indicates an **equilibrium** where the market is neutral, with an equal amount of calls and puts.
### How it's used:
- **Sentiment Indicator**: Traders use the PCR to determine the overall sentiment of the market. A rising PCR might suggest that there is growing bearish sentiment, while a declining PCR might suggest increasing bullish sentiment.
- **Market Extremes**: When the PCR becomes too extreme (either very high or very low), it could signal a reversal, indicating that the market might be overbought or oversold.
### Example:
If the open interest for put options in a stock is 100,000 contracts and for call options is 200,000 contracts, the PCR would be:
\
This would typically indicate a **bullish sentiment**, as more traders are interested in calls than puts.
Bankniftytradesetup

what is support and resistance and how to use it ?The support and resistance (S&R) are specific price points on a chart expected to attract the maximum amount of either buying or selling. The support price is a price at which one can expect more buyers than sellers. Likewise, the resistance price is a price at which one can expect more sellers than buyers.
Using Support and Resistance After a Breakout
Old Resistance Becomes New Support – If the price breaks above resistance, that resistance level may now act as support.
Old Support Becomes New Resistance – If the price breaks below support, that support level may now act as resistance
Support is a price point which is below the current market price and indicates buying interest. Resistance is the price point which is above the current market price and indicates selling interest. Support and resistance are used to identify the targets for the trade
Support and resistance levels are important points in time where the forces of supply and demand meet. These support and resistance levels are seen by technical analysts as crucial when determining market psychology and supply and demand.

Banswara Syntex Ltd.Banswara Syntex Ltd. (NSE: BANSWRAS) is currently exhibiting a **Neutral** technical outlook on the monthly timeframe.
**Technical Indicators:**
- **Relative Strength Index (RSI):** The 14-day RSI stands at 53.81, indicating a neutral market sentiment. citeturn0search5
- **Moving Averages:** The stock is trading below its 50-day simple moving average (SMA) of ₹144.23 and above its 50-day exponential moving average (EMA) of ₹139.63, suggesting a mixed trend. citeturn0search5
- **MACD (Moving Average Convergence Divergence):** The MACD value is -2.43, which is below the signal line, indicating a bearish momentum. citeturn0search5
- **Stochastic Oscillator:** The Stochastic Oscillator is at 68.59, suggesting a neutral market condition. citeturn0search5
**Support and Resistance Levels:**
- **Support:** The stock has support at ₹127.62. citeturn0search5
- **Resistance:** The resistance level is at ₹137.67. citeturn0search5
**Conclusion:**
Banswara Syntex Ltd. is currently in a neutral technical position on the monthly timeframe, with indicators suggesting neither strong bullish nor bearish momentum. Investors should monitor these indicators closely, as a breakout above resistance levels could signal a bullish trend, while a drop below support levels might indicate a bearish move. It's advisable to consider these technical factors alongside fundamental analysis and broader market conditions when making investment decisions.

#bls international #BLS PERFECT REVERSAL CANDIDATE
BLS International Services Ltd. (NSE: BLS) is currently exhibiting a **Neutral** technical outlook, with indicators suggesting neither strong bullish nor bearish momentum.
**Technical Indicators:**
- **Relative Strength Index (RSI):** The 14-day RSI stands at 35.13, indicating a neutral market sentiment. citeturn0search4
- **Moving Averages:** The stock is trading below its 5-day, 10-day, 20-day, and 50-day simple and exponential moving averages, suggesting a bearish trend. citeturn0search4
- **MACD (Moving Average Convergence Divergence):** The MACD value is -10.94, which is below the signal line, indicating a bearish momentum. citeturn0search4
- **Stochastic Oscillator:** The Stochastic Oscillator is at 16.70, suggesting a buy signal. citeturn0search4
**Support and Resistance Levels:**
- **Support:** The stock has support at ₹389.87. citeturn0search4
- **Resistance:** The resistance level is at ₹448.87. citeturn0search4
**Conclusion:**
BLS International Services Ltd. is currently in a neutral technical position, with indicators suggesting neither strong bullish nor bearish momentum. Investors should monitor these indicators closely, as a breakout above resistance levels could signal a bullish trend, while a drop below support levels might indicate a bearish move. It's advisable to consider these technical factors alongside fundamental analysis and broader market conditions when making investment decisions.

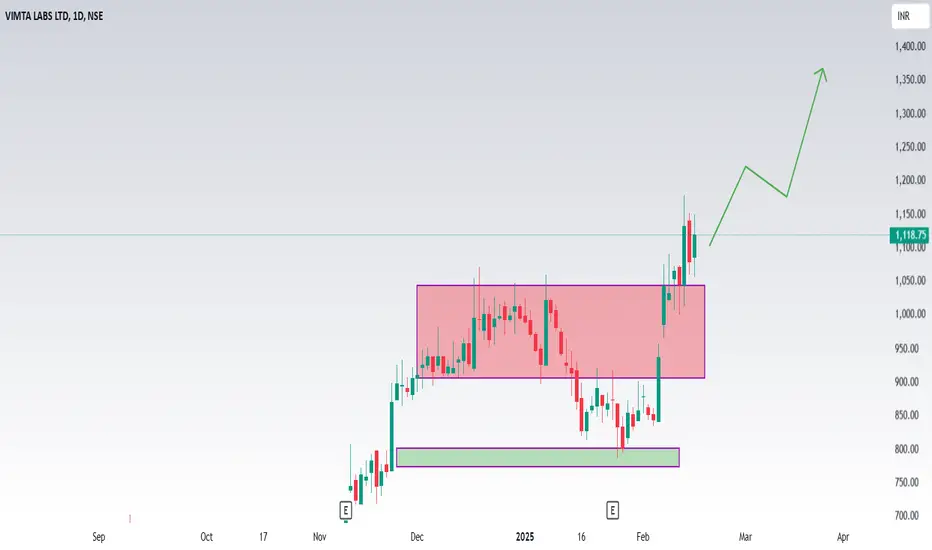
Vimta labs ltdShould I buy VIMTA LABS LTD stock? Our technical rating for VIMTA LABS LTD is buy today. Note that market conditions change all the time — according to our 1 week rating the strong buy trend is prevailing, and 1 month rating shows the strong buy signal.
Vimta Labs Ltd. (NSE: VIMTALABS) is currently exhibiting a strong bullish trend, as indicated by various technical analysis indicators.
**Technical Indicators:**
- **Moving Averages:** All moving averages (5, 10, 20, 50, 100, and 200 periods) are signaling a 'Buy' or 'Strong Buy' position, suggesting sustained upward momentum. citeturn0search2
- **Relative Strength Index (RSI):** The 14-day RSI stands at 89.33, indicating that the stock is in the overbought territory. While this suggests strong momentum, it also implies a potential for price correction. citeturn0search2
- **MACD (Moving Average Convergence Divergence):** The MACD is above the signal line, reinforcing the bullish trend. citeturn0search2
- **Stochastic Oscillator:** The Stochastic Oscillator is in the overbought zone, which may indicate a potential for price pullback. citeturn0search2
**Support and Resistance Levels:**
- **Support:** The stock has support at ₹560. citeturn0search3
- **Resistance:** The resistance level is at ₹1,020. citeturn0search3
**Volume Analysis:**
The stock has experienced high trading volumes at price peaks and lower volumes at price troughs, indicating that price movements are supported by significant trading activity. citeturn0search3
**Conclusion:**
While Vimta Labs Ltd. is currently in a strong bullish phase, the overbought conditions suggested by the RSI and Stochastic Oscillator warrant caution. Investors should monitor these indicators closely, as a price correction could occur if the stock remains in the overbought zone. It's advisable to consider these technical factors alongside fundamental analysis and broader market conditions when making investment decisions.
basic to advanced technical analysis ?What is Advanced Technical Analysis? Advanced technical analysis usually involves using either multiple technical indicators or a rather sophisticated (i.e., complex) indicator. “Sophisticated” does not necessarily mean “better” – it just means more difficult to calculate than, say, an arithmetic average.
Technical analysis seeks to predict price movements by examining historical data, mainly price and volume. It helps traders and investors navigate the gap between intrinsic value and market price by leveraging techniques like statistical analysis and behavioral economics
What are the four 4 basic principles of technical analysis?
The core principles of technical analysis in relation to the stock market are that prices discount all known information, reflect the psychology of market participants in the form of fluctuating prices, move in trends, and tend to repeat in historically identifiable patterns

What is adx use in technical analysis ?The ADX quantifies trend strength by measuring directional movement over a given time frame. It provides traders with specific numbers (from 0 to 100) that represent strong or weak price trends. Traders can simply refer to the numbers to quickly assess the strength of a trend.
Traders could utilise the ADX to help them determine entry or exit points for a trade. The ADX could be used to identify potential overbought or oversold levels in the market.
Key takeaways. Average directional index (ADX) is a short-term chart indicator. It can be used to help you evaluate the market or an investment's strength. ADX currently suggests the short-term momentum behind stocks may be strong, with a caveat.

What is swing trading and how to do it ?Swing trading is a stock investment strategy where profits are made over several days or weeks. Swing traders analyze stock price patterns to anticipate when prices will rise, allowing them to buy low, and when prices will fall, enabling them to sell high.
The simplest and most effective way to protect your equity through risk management is to establish strict loss parameters and abide by them. One popular method is the 2% Rule, which means you never put more than 2% of your account equity at risk
The 3 5 7 rule is a risk management strategy in trading that emphasizes limiting risk on each individual trade to 3% of the trading capital, keeping overall exposure to 5% across all trades, and ensuring that winning trades yield at least 7% more profit than losing trades.

what is breakout and retest ?The break and retest strategy involves identifying a breakout of a key support or resistance level and then waiting for the price to return to that level. Traders use this retest as a confirmation to enter the market, aiming to follow the new trend with reduced risk
The break and retest strategy involves identifying key levels, waiting for a breakout, and then strategically entering the market during the retest phase.
On the flip side, “trading the retest” means waiting for a broken level to be retested as new support or new resistance before entering the market. The diagram below illustrates the difference. A quick glance at the illustration above may have you wondering why anyone would enter before the retest

What is option chain pcr ?The Put-Call Ratio (PCR) is a popular technical indicator used by investors to assess market sentiment. It is calculated by dividing the volume or open interest of put options by call options over a specific time period. A higher PCR suggests bearish sentiment, while a lower PCR indicates bullish sentiment.
The Put-Call Ratio (PCR) is a useful indicator to understand the market sentiment at any given time. A high PCR suggests a bearish market, while a low PCR signals bullish tendencies. It helps investors assess whether the market is leaning towards optimism or pessimism, which can shape investment strategies.
A good PCR ratio depends on the market context, but generally, a PCR below 0.7 indicates bullish sentiment (potential market rise), while a PCR above 1.2 suggests bearish sentiment (potential market decline)

basic to advance trading techniques ??Here's how to make your first trade:
Open and fund your live account.
After careful analysis of the market, select your opportunity.
'Buy' if you think that market's price will rise, or 'sell' if you think it'll fall.
Select your deal size, ie the number of CFD contracts.
Take steps to manage your risk.
The 5-3-1 strategy is especially helpful for new traders who may be overwhelmed by the dozens of currency pairs available and the 24-7 nature of the market. The numbers five, three, and one stand for: Five currency pairs to learn and trade. Three strategies to become an expert on and use with your trades.
It is a high-stakes game where many are lured by the promise of quick riches but ultimately face harsh realities. One of the harsh realities of trading is the “Rule of 90,” which suggests that 90% of new traders lose 90% of their starting capital within 90 days of their first trade.

Database Trading part 4 The United Nations Comtrade database aggregates detailed global annual and monthly trade statistics by product and trading partner for use by governments, academia, research institutes, and enterprises.
SQL remains a fundamental tool for querying and managing data. SQL's simplicity and power make it accessible to both beginners and experts. In trading systems, SQL enables efficient data retrieval and manipulation. Users can write SQL queries to analyze market trends and execute trading strategies
Oracle is the most widely used database management system written in assembly languages C, C++, and Java. It is also considered the most popular database because of its cost-optimizing and high-performing features. It supports SQL (Structured Query Language) to interact with the database

What is rsi ? how to use it ?The relative strength index (RSI) is an indicator used in technical analysis to determine overbought and oversold conditions, which provides traders with buy and sell signals (when to enter and exit positions). Values above 70 indicate overbought conditions and those below 30 indicate oversold conditions.
To use the RSI indicator, check if the value is above 70 to show an asset is overbought, or below 30 to show it is oversold. Traders can use these signals to find possible trading opportunities.
Successful trades often occur when the RSI crosses above 30 (indicating a buy signal) or below 70 (indicating a sell signal). Adjusting the RSI period to 9 can make it more sensitive to price changes and be suitable for more active trading strategies.

what is resistance and support and how to use it in trading ?Support occurs at the point where a downtrend is expected to pause due to a concentration of demand. Resistance occurs at the point where an uptrend is expected to pause due to a concentration of supply. Support and resistance areas can be identified on charts using trendlines and moving averages
Using Support and Resistance After a Breakout
Old Resistance Becomes New Support – If the price breaks above resistance, that resistance level may now act as support.
Old Support Becomes New Resistance – If the price breaks below support, that support level may now act as resistance
TOP-10 Support and Resistance Indicators
Fibonacci Levels.
Support and Resistance Zones Indicator.
Linear Regression.
Margin Zones Indicator.
Trend Lines.
Fair Value Gaps.
Stacked Imbalance Indicator.
Psychological Levels.

Triveni Turbine Ltd.#TRITURBINE SHOWING STRENGTH, JACKPOT CANDIDATE
TARGET - 720
ENTRY - 580
STOP LOSS - 550
TIME FRAME - MONTHLY
TECHNICALS - BULLISH
Ahead of the quarterly earnings for the December 2024 period, brokerage Motilal Oswal is bullish on the stock with a price target of Rs 830. "Despite weakness in domestic markets, Triveni Turbine posted healthy growth in revenue, profitability and order inflows in FY24
Triveni Turbine is forecast to grow earnings and revenue by 19% and 18.9% per annum respectively. EPS is expected to grow by 20.4% per annum. Return on equity is forecast to be 27.3% in 3 years.
THIS IS NOT ANY FINANCIAL ADVISE

Godfrey Phillips India LtdFuture Growth
Godfrey Phillips India is forecast to grow earnings and revenue by 25.5% and 12.7% per annum respectively. EPS is expected to grow by 25.5% per annum. Return on equity is forecast to be 20.6% in 3 years.
Consumer Defensive stocks do not always pay a dividend but as Godfrey Phillips India Ltd pays dividends to reward its shareholders. In the quarter ending September 2024, Godfrey Phillips India Ltd has declared dividend of ₹35 - translating a dividend yield of 1.75%.
Is Godfrey Phillips owned by ITC?
Godfrey Phillips India Ltd. (GPI) is a tobacco manufacturer headquartered in India. It is now a part of Modi Enterprises.

advanced pcr tradingHowever, no PCR can be considered ideal, but usually, a PCR below 0.7 is typically viewed as a strong bullish sentiment while a PCR more than 1 is usually considered as a strong bearish sentiment.
The Put-Call Ratio (PCR) is a popular technical indicator used by investors to assess market sentiment. It is calculated by dividing the volume or open interest of put options by call options over a specific time period. A higher PCR suggests bearish sentiment, while a lower PCR indicates bullish sentiment.
It can additionally be used for individual securities by looking at the volume of puts and calls on a security over a determined time period. A high PCR is indicative of bearish sentiment while a low PCR is indicative of bullish sentiment.

learning Advance Option trading You can get started trading options by opening an account, choosing to buy or sell puts or calls, and choosing an appropriate strike price and timeframe. Generally speaking, call buyers and put sellers profit when the underlying stock rises in value. Put buyers and call sellers profit when it falls.
There are some essentials of advanced options trading and these are: Spreads: These involve buying and selling options contracts with different strike prices or expiration dates on the same underlying asset. By combining these contracts, you create a defined risk and reward profile
Straddle is considered one of the best Option Trading Strategies for Indian Market. A Long Straddle is possibly one of the easiest market-neutral trading strategies to execute. The direction of the market's movement after it has been applied has no bearing on profit and loss.

What are the most important things to remember while trading ?It is a high-stakes game where many are lured by the promise of quick riches but ultimately face harsh realities. One of the harsh realities of trading is the “Rule of 90,” which suggests that 90% of new traders lose 90% of their starting capital within 90 days of their first trade.
Stop loss
Plan the trade
Trading strategy
Control your trading capital
Correlated stocks
Discipline
Risk management
Arrange sufficient capital
Determine market conditions
Learn trading discipline
Market risk
Patience
Profits occur sporadically
Start small
Study the markets
Understand securities
Avoid overtrading
Avoid penny stocks
Broker requirements
Consider rebalancing portfolio occasionally
Consider your risk tolerance
Cut losses with limit orders
Diversification
Do not average your trades

how to make a rich portfolio in stock market ?Building wealth: 9 strategies for growing your portfolio
Pick an investment strategy that suits your goals. ...
Set clear investment goals. ...
Consider investing over the long-term. ...
Market timing. ...
Diversification. ...
Invest in growth sectors. ...
Take advantage of compound interest. ...
Rebalance your investment portfolio
So, 90/10, with 90% in the Vanguard 500 Index Fund and 10% in short-term government bonds, is his recommendation for his wife's trust. By the way, his wife is in her late 70s, and Warren will presumably be leaving her many millions of dollars

What is option trading and how it can be done profitably ?Options traders can profit by being option buyers or option writers. Options allow for potential profit during volatile times, regardless of which direction the market is moving. This is possible because you can use an options trading platform to trade in anticipation of market appreciation or depreciation
Also called the 1-3-2 butterfly spread, it is a common variation if the butterfly spread involving buying one option at a lower strike, selling three at a middle strike, and buying two at a higher strike. This advanced options trading strategy offers more flexibility.
If you think the stock price will stay stable: sell a call option or sell a put option. If you think the stock price will go down: buy a put option, sell a call option. Frederick says to think of options like an insurance policy: You don't get car insurance hoping that you crash your car.

BANKNIFTY - LONG POSITIONS ON RETRACEMENT?Symbol - BANKNIFTY
CMP - 49300
Bank Nifty has recently approached a crucial resistance zone, positioned between the 50600 and 51000 levels. This zone has acted as a significant barrier to upward movement. Observing the recent price action, Bank Nifty has tested this resistance area multiple times, confirming its strength.
From a technical standpoint, the index has formed a double bottom pattern near 48000 levels, which is a critical support zone. This pattern typically indicates a potential reversal of the previous downtrend, as the price failed to breach the 48000 support level and instead demonstrated a strong recovery. The double bottom formation suggests a buildup of bullish momentum from the support region.
Currently, Bank Nifty has shown a notable retracement from the resistance zone. Given the pattern formation and the recent retracement, the expectation is for the bullish trend to resume. A recovery from the current levels could lead Bank Nifty to retest the 50500 - 51000 resistance zone again. Should the index successfully break above this resistance area and sustain levels above it, the next target is likely to be around the 51800 level.
However, the bullish outlook is contingent upon the index holding its key support levels. The critical support range lies between 48800 - 48600 area. Should Bank Nifty fail to maintain this support and break below it, the trend may turn bearish, triggering a potential sell-off and driving prices lower, with the next possible support zones coming into play at lower levels.
In summary, the technical analysis suggests a favorable bullish scenario, provided the key support levels hold. If the resistance zone around 50800 is breached, further upside momentum toward the 51800 region is possible. However, failure to hold the support zone could lead to a reversal in the trend, and further downside could materialize.

Nifty bounce expected.Nifty is showing divergence on support and bank nifty already showing reversal with divergence.
Nifty is strong till trading above 22700. Buy on dip market.
