BSOFT: Trendline BO, Double Bottom Formation, Chart of the WeekIs NSE:BSOFT Technical Breakout Real? What the Charts Tell You About This Mid-Cap IT Giant's Next Move after Weaking Rupee and Strong Margins Recovery in Q2FY26. Let's Analyze in Chart of the Week.
As per the Latest SEBI Mandate, this isn't a Trading/Investment RECOMMENDATION nor for Educational Purposes; it is just for Informational purposes only. The chart data used is 3 Months old, as Showing Live Chart Data is not allowed according to the New SEBI Mandate.
Disclaimer: "I am not a SEBI REGISTERED RESEARCH ANALYST AND INVESTMENT ADVISER."
This analysis is intended solely for informational purposes and should not be interpreted as financial advice. It is advisable to consult a qualified financial advisor or conduct thorough research before making investment decisions.
Price Action Analysis:
Long-Term Trend Structure:
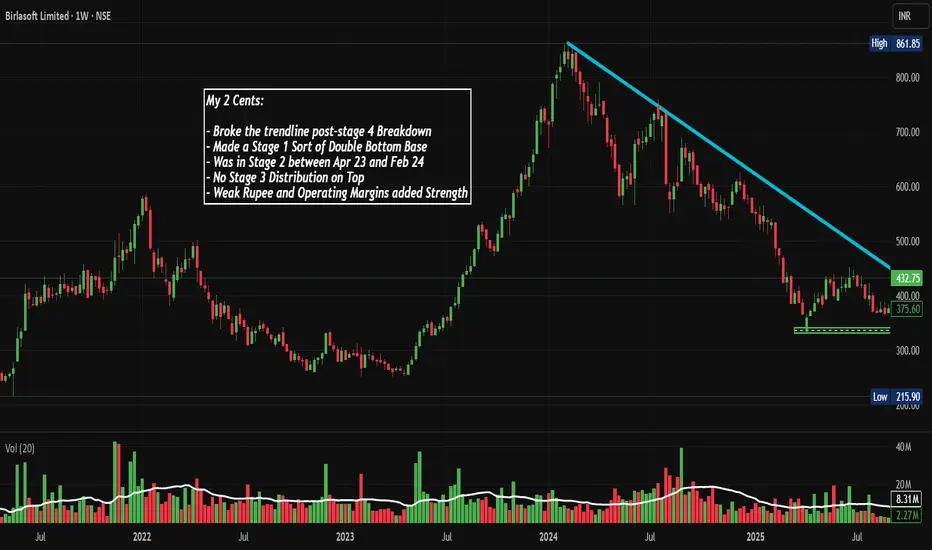
- The stock experienced a strong uptrend from early 2022 to peak levels around ₹861.85 (High) in early 2024, representing a massive rally from the ₹250-300 base
- Following the peak, Birlasoft entered a prolonged correction phase, declining from ₹861.85 to a low of ₹250.25, marking approximately 71% retracement from the top
- Currently trading at ₹432.75 as of December 6, 2025, showing a recent +13.82% bounce
- The stock has been consolidating in the ₹350-450 range for the past several months after bottoming out
Current Price Action Characteristics:
- Recent price action shows signs of accumulation near the ₹350-380 support zone
- The stock broke above a descending trendline (cyan line on the chart) which connected the highs from early 2024 through late 2025
- This trendline break suggests a potential shift in momentum from bearish to bullish
- The green horizontal box at the bottom (₹300-350 zone) appears to mark a strong demand zone where buyers stepped in aggressively
- Post-trendline breakout, the stock has shown resilience with higher lows being formed
Stage Analysis Interpretation:
- The stock broke the trendline after a Stage 4 breakdown
- Formed a Stage 1 type of double bottom base pattern
- Was in Stage 2 Uptrend between April 2023 and February 2024
- No Stage 3 distribution pattern was visible on top
- The presence of weak rupee and improving operating margins has added fundamental strength
Volume Spread Analysis:
Volume Distribution Patterns:
- The volume chart shows significant spikes during key price movements
- Major volume accumulation visible during the decline phase in late 2024 and early 2025, suggesting capitulation
- Recent volume (25.13M) is substantially higher than the average (7.84M), indicating increased participation
- Volume spikes coinciding with the recent rally from ₹350-380 levels suggest genuine buying interest
- The green volume bars in recent sessions indicate buying pressure supporting the upward move
Volume-Price Relationship:
- During the downtrend, volume increased on down days, confirming selling pressure
- At the bottom formation (₹300-350 zone), volume remained elevated but price held ground - classic accumulation behavior
- The breakout from the descending trendline came with above-average volume, validating the move
- Current volume levels suggest institutional interest is returning to the stock
Base Formation and Support Levels:
Base Structure:
- A clear double bottom pattern formed at approximately ₹350-380 levels
- The base formation period spans from mid-2025 to current levels
- This base represents a 5-7 month consolidation, allowing weak hands to exit and strong hands to accumulate
- The green box marked on the chart (₹300-350) represents the primary support zone
Key Support Levels:
- Immediate support: ₹380-400 (previous resistance turned support)
- Strong support: ₹350-365 (double bottom lows)
- Critical support: ₹300-320 (absolute base of consolidation)
- The 52-week low at ₹250.25 acts as a psychological support level
Support Significance:
- The ₹350-380 zone has been tested multiple times and held firm, indicating strong buying interest
- Volume accumulation in this zone suggests institutional accumulation
- Any pullback toward ₹380-400 would be a retest opportunity for the breakout
Resistance Levels:
Immediate Resistance Zones:
- First resistance: ₹450-460 (previous consolidation highs)
- Second resistance: ₹500-520 (psychological level and minor supply zone)
- Major resistance: ₹600-650 (significant supply zone from the downtrend)
- Ultimate resistance: ₹750-800 (prior distribution zone before major correction)
Resistance Analysis:
- The descending trendline, now broken, may act as dynamic support on pullbacks
- The ₹450 level represents a minor hurdle but has been approached multiple times recently
- Breaking above ₹500 would confirm the bullish structure and potentially trigger momentum buying
- The journey to ₹600+ would require sustained buying and improvement in business fundamentals
Technical Patterns:
- Double Bottom Pattern: Clearly visible at ₹350-380 levels with two distinct lows
- Descending Trendline Breakout: The cyan trendline connecting lower highs has been decisively broken
- Rounding Bottom Formation: The overall structure from the peak shows a gradual rounding bottom (Not a Textbook Kind)
- Higher Low Pattern: Recent price action shows formation of higher lows post-breakout (on Lower TF)
Pattern Implications:
- Double bottom patterns typically indicate trend reversal
- The trendline breakout adds conviction to the bullish thesis
- Continuation patterns forming above ₹400 would strengthen the uptrend structure
Risk Considerations:
- Failure to hold above the descending trendline (now support at ₹400-410) would negate the bullish setup
- A break below ₹380 would signal renewed weakness
- The stock must close above ₹450 on good volume to confirm the breakout
Sectoral Backdrop - Indian IT Services Industry:
Current Industry Landscape:
- The Indian IT sector is navigating a challenging demand environment with 77% of providers expecting higher business growth in FY26 compared to last year, driven by growing foundational digital scope, emerging markets, and strategic AI-led demand
- IT exports are expected to cross the $200 billion mark, growing 4.6% year-over-year to reach $224 billion in FY25
- The sector faces uncertainty due to global macroeconomic conditions, with clients delaying discretionary technology spending
- However, IT spending in India is expected to rise 11.1% year-on-year to $161.5 billion in 2025
Emerging Trends and Opportunities:
- AI and digital transformation continue to be major growth drivers across the industry
- Overall IT hiring grew 16% year-over-year in April 2025, driven by AI adoption, cloud modernization, and rapid expansion of Global Capability Centres
- Non-metro cities like Udaipur, Vizag, Coimbatore, and Nagpur are experiencing over 50% IT hiring growth
- Mid-tier IT companies have shown better agility in navigating uncertain macroeconomic conditions compared to larger counterparts
Sector Challenges:
- The sector faces its eighth consecutive quarter of single-digit revenue growth, with weak client spending and reduced digital transformation budgets as main culprits
- Rising H-1B visa fees and Trump tariffs are creating indirect headwinds for the industry
- Life sciences and manufacturing verticals are experiencing softness
- Margin pressures from rising wages, talent shortages, and shift to more onsite work models
Fundamental Backdrop:
Business Overview:
- Birlasoft Limited provides cloud, artificial intelligence (AI), and digital technologies, combining domain expertise with enterprise solutions across banking, financial services, insurance, life sciences, energy resources, utilities, and manufacturing verticals
- The company offers services in customer experience, data analytics, connected products, intelligent automation, blockchain, and generative AI
- In fiscal year 2025, the company achieved consolidated revenue of ₹53,752 million, with the Americas contributing 86.5% of total revenue
- Part of the CK Birla Group, bringing strong promoter backing and group pedigree
Recent Financial Performance:
- Q2 FY25 revenue was $163.3 million, showing 3.1% sequential growth in rupee terms and 2.6% in dollar terms, with year-over-year growth of 4.5%
- Q3 FY25 revenue reached ₹1,383.48 crore, up 0.9% year-over-year but down 1.29% quarter-over-quarter
- EBITDA margin dropped to 12.1% in Q2 FY25 from 14.7% in the previous quarter, partly due to pricing flexibility and increased on-site work
- Net profit was ₹116.10 crore in Q2 FY26, down 8.95% year-over-year but showing 9.09% sequential growth
Operational Highlights:
- The company delivered approximately $300 million in deal signings in the first half of FY25, though lower than the previous year
- Cash and bank balance stood at $221.8 million with operating cash flow of $12.9 million
- Days sales outstanding (DSO) at 58 days remains among the best in the industry
- Workforce strength of approximately 12,500+ professionals with attrition improving to around 11.8%
Key Challenges:
- Life sciences vertical has been underperforming and is expected to remain soft for a couple more quarters
- Manufacturing vertical, the company's largest, experienced project closures and ramp-downs
- Shift in revenue mix toward 51% onsite work has pressured margins
- Customer decision-making delays have affected deal flow and total contract value performance
Positive Catalysts:
- Three of four verticals (BFSI, Life Sciences & Services, Energy & Utilities) delivered sequential growth in Q2
- Management indicates improving pipeline with expectations of better deal flow in H2
- Recent AWS competency achievements in Manufacturing and Industrial Consulting enhance credibility
- CEO Angan Guha's reappointment for another two-year term provides leadership continuity
- Weak rupee environment provides tailwinds for export-oriented revenue
- Focus on improving operational efficiency and margin expansion through offshore shift
Valuation Context:
- Market capitalization stands at approximately ₹10,816 crore
- The stock has corrected significantly from highs, potentially offering better risk-reward at current levels
- P/E multiple compression during the correction phase may present opportunity if earnings stabilize
Overall Technical Assessment:
- The stock has completed a multi-month base formation and broken above a critical descending trendline
- Volume confirmation on the breakout adds credibility to the move
- The double bottom pattern at ₹350-380 provides a well-defined risk level for traders
- Risk-reward ratio favors bulls with clear support and resistance levels
Bull Case:
- A decisive close above ₹500 would open doors for ₹600+ levels
- Improving business fundamentals and sectoral recovery would support the technical breakout
Bear Case:
- Failure to hold the breakout level (₹400-410) would indicate a false breakout
- A breach below ₹380 would negate the bullish setup and potentially retest the ₹350 base
- Weak quarterly results or deteriorating sector conditions could trigger profit booking
My 2 Cents:
NSE:BSOFT presents an interesting technical setup after a prolonged correction. The completion of a double bottom base formation, coupled with a descending trendline breakout on good volume, suggests the worst may be behind for the stock. While fundamental challenges persist in the form of muted demand environment and margin pressures, the company's focus on operational efficiency, improving deal pipeline, and sector positioning in high-growth areas like AI and cloud provide reasons for optimism.
The technical structure suggests that patient accumulation in the current range with strict risk management could be rewarded if the company executes on its operational plans and the broader IT sector demand improves. However, investors should remain cognizant of the challenging macroeconomic backdrop and monitor quarterly results closely for signs of sustainable business improvement.
The confluence of technical breakout and improving operational metrics makes Birlasoft a stock worth watching for both tactical trades and strategic accumulation, provided risk management principles are strictly followed.
Full Coverage on my Newsletter this Week
Keep in the Watchlist and DOYR.
NO RECO. For Buy/Sell.
📌Thank you for exploring my idea! I hope you found it valuable.
🙏FOLLOW for more
👍BOOST if you found it useful.
✍️COMMENT below with your views.
Meanwhile, check out my other stock ideas on the right side until this trade is activated. I would love your feedback.
As per the Latest SEBI Mandate, this isn't a Trading/Investment RECOMMENDATION nor for Educational Purposes; it is just for Informational purposes only. The chart data used is 3 Months old, as Showing Live Chart Data is not allowed according to the New SEBI Mandate.
Disclaimer: "I am not a SEBI REGISTERED RESEARCH ANALYST AND INVESTMENT ADVISER."
This analysis is intended solely for informational purposes and should not be interpreted as financial advice. It is advisable to consult a qualified financial advisor or conduct thorough research before making investment decisions.
Baseformation
LTF Breaking Out of Consolidation and ascending triangleNSE:LTF : Breaking Out of Consolidation and ascending triangle with heavy volumes today - Is This the Next Big NBFC Move?
Price Action Analysis:
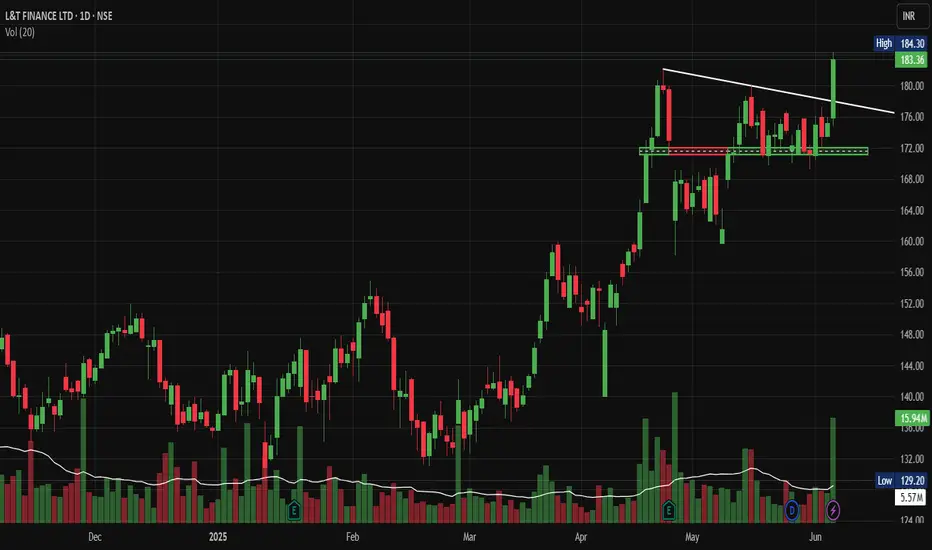
• Base Formation: Clear sideways movement between ₹160-172 levels
• Breakout Confirmation: Recent breach above ₹172 resistance with volume expansion
• Trendline Break: White descending trendline from December highs decisively broken
• Market Structure: Shift from the consolidation phase to the potential trend resumption
• Time Frame: A six-month base provides a strong foundation for sustained movement
Volume Analysis:
• Current Volume: 5.57M against 20-day average of 15.94M
• Volume Pattern: Accumulation visible during the base formation period
• Support Tests: Volume spikes coinciding with successful ₹160-164 support tests
• Breakout Volume: Adequate but not exceptional - requires monitoring for follow-through
• Distribution Signs: No significant selling pressure visible during consolidation
Key Support & Resistance Levels:
Support Levels:
• Immediate Support: ₹172 (new floor post-breakout)
• Secondary Support: ₹168 (previous resistance turned support)
• Major Support: ₹160-164 (primary consolidation base)
• Critical Support: ₹155 (breakdown level)
Resistance Levels:
• Immediate Resistance: ₹190-195 (measured move target)
• Next Resistance: ₹205-210 (psychological and technical zone)
• Long-term Target: ₹220-225 (extension target)
Trade Setup:
Entry Strategy:
• Aggressive Entry: Current levels ₹183-184 for momentum traders
• Conservative Entry: ₹175-177 on pullback to breakout zone
• DCA Approach: Scale in between ₹175-185 levels
Exit Strategy:
• Target 1: ₹192 (measured move from rectangle pattern)
• Target 2: ₹205-210 (next significant resistance)
• Target 3: ₹220+ (extension target for long-term holders)
Stop Loss:
• Closing Basis: Below ₹170
• Intraday Basis: Below ₹168
• Risk Percentage: 7-8% from current levels
Position Sizing & Risk Management:
Position Sizing:
• Conservative: 1% portfolio risk
• Moderate: 1.5% portfolio risk
• Aggressive: 2% portfolio risk (maximum recommended)
Risk Management:
• Stop Loss Discipline: Strict adherence to ₹170 closing stop
• Position Scaling: Reduce position if breaks ₹175 intraday
• Profit Booking: Book 30% at ₹192, 40% at ₹205
• Trailing Stop: Implement above ₹195 levels
Sectoral Backdrop:
NBFC Sector Positives:
• Credit Growth: NBFC credit growth outpacing bank credit
• Market Share: Gaining share in retail and SME segments
• Asset Quality: Improving collection efficiency post-COVID
• Regulatory Support: Favourable policy environment
Sector Trends:
• Digital Lending: Increased adoption of technology platforms
• Rural Focus: Growing emphasis on semi-urban and rural markets
• Partnership Models: Collaborations with fintech companies
Fundamental Backdrop:
Company Strengths:
• Group Support: Strong L&T Group parentage and backing
• Diversified Portfolio: Exposure across infrastructure and retail segments
• Quality Borrowers: Access to L&T Group ecosystem clients
• Management Quality: Experienced leadership team
Recent Developments:
• Asset Quality: Improving NPA ratios
• Profitability: Better margins and ROE metrics
• Growth Strategy: Focus on profitable growth segments
Risk Factors:
Technical Risks:
• False Breakout: Possibility of returning to the consolidation range
• Volume Confirmation: Need for sustained volume support
• Market Correlation: High beta to financial sector performance
Fundamental Risks:
• Interest Rate Risk: Rising rates impacting lending margins
• Credit Quality: Potential stress in the retail lending portfolio
• Economic Slowdown: Impact on borrower repayment capacity
• Regulatory Changes: Policy shifts affecting NBFC operations
Market Risks:
• Sector Rotation: Money moving away from financial stocks
• Liquidity Concerns: Tightening of wholesale funding markets
• Competition: Increased competition from banks and fintech
My Take:
The technical setup suggests accumulation phase completion with potential for a significant move higher. Follow the Strict Trade Plan as Explained Above.
Keep in the Watchlist.
NO RECO. For Buy/Sell.
📌Thank you for exploring my idea! I hope you found it valuable.
🙏FOLLOW for more
👍BOOST if you found it useful.
✍️COMMENT below with your views.
Meanwhile, check out my other stock ideas on the right side until this trade is activated. I would love your feedback.
Disclaimer: "I am not a SEBI REGISTERED RESEARCH ANALYST AND INVESTMENT ADVISER."
This analysis is intended solely for informational and educational purposes and should not be interpreted as financial advice. It is advisable to consult a qualified financial advisor or conduct thorough research before making investment decisions.
ChennaiPetro: Wedge & Trendline BO with 61.8%, Chart of the WeekNSE:CHENNPETRO Explosive Breakout: Why This Refinery Stock Could Rally Another 30% After Its Q2 Turnaround. This PSU Refinery Stock Broke Through ₹979 Levels - Here's What Traders Need to Know About the Next Move. Let's Analyse in our Chart of the Week Below.
As per the Latest SEBI Mandate, this isn't a Trading/Investment RECOMMENDATION nor for Educational Purposes; it is just for Informational purposes only. The chart data used is 3 Months old, as Showing Live Chart Data is not allowed according to the New SEBI Mandate.
Disclaimer: "I am not a SEBI REGISTERED RESEARCH ANALYST AND INVESTMENT ADVISER."
This analysis is intended solely for informational purposes and should not be interpreted as financial advice. It is advisable to consult a qualified financial advisor or conduct thorough research before making investment decisions.
Price Action Analysis:
Trend Structure and Momentum:
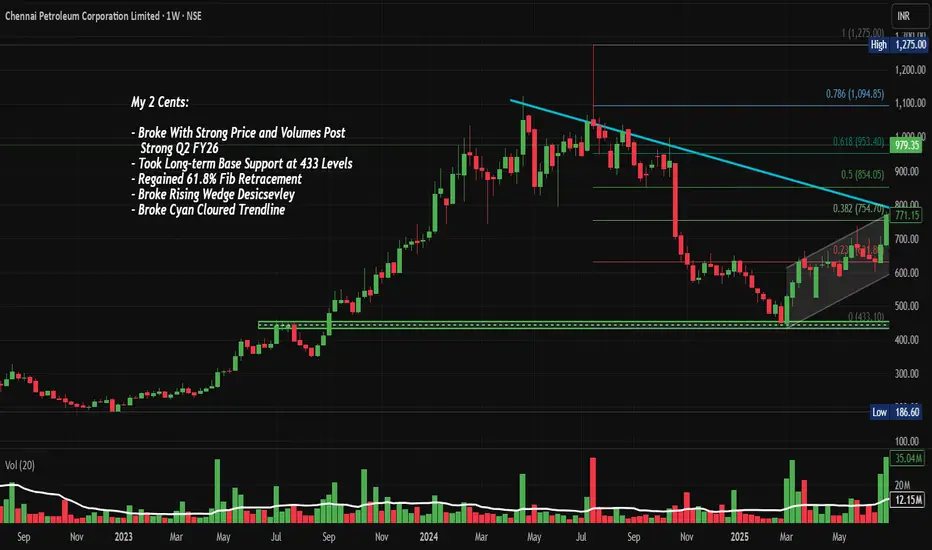
- The stock experienced a prolonged uptrend from March 2023 to July 2024, rallying from base levels around ₹433 to a peak of ₹1,275, representing approximately 195% appreciation
- Post the July 2024 peak, the stock entered a corrective phase characterised by lower highs and consolidation
- Recent price action shows a breakout above the descending cyan trendline that had been capping rallies since mid-2024
- Current price of ₹979.35 (as of October 31, 2025) represents a 26.80% gain, indicating strong buying momentum
- The stock is trading above all key Fibonacci retracement levels, having reclaimed the 61.8% level at approximately ₹953
Candlestick Patterns and Formations:
- The most recent candle shows a strong bullish close with a substantial body, indicating conviction in the upward move
- The chart displays a rising wedge/descending channel pattern that was broken decisively in recent sessions
- Prior consolidation between ₹700-₹850 formed a re-accumulation base, which has now been breached to the upside
- The breakout candle demonstrates strong price and volume expansion, a classic sign of institutional participation
Volume Spread Analysis:
Volume Characteristics:
- Recent volume surge to 90.39 million shares significantly exceeds the average volume of 13.46 million, representing approximately 6.7x normal trading activity
- The volume spike coincides with the price breakout, validating the move as genuine rather than a false breakout
- Historical volume analysis shows similar spikes during major trend reversals, particularly during the March 2023 base breakout
- Volume expansion without corresponding price weakness suggests strong demand absorption at current levels
Volume-Price Relationship:
- The volume profile indicates heavy accumulation in the ₹700-₹800 zone, which now serves as a critical support cluster
- Recent sessions show sustained above-average volume, suggesting institutional interest rather than retail speculation
- The volume pattern aligns with a classic "breakout with expansion" scenario, increasing the probability of trend continuation
Support and Resistance Levels:
Key Support Zones:
- Primary Support (S1): ₹854 - This represents the 0.5 Fibonacci retracement level and previous consolidation high
- Secondary Support (S2): ₹754 - The 0.382 Fibonacci level and recent breakout point from the descending trendline
- Critical Support (S3): ₹631 - The 0.236 Fibonacci level and long-term base support at ₹433-₹450 zone
- The grey trendline originating from the 2024 lows provides dynamic support, currently positioned around ₹720
Key Resistance Zones:
- Immediate Resistance (R1): ₹1,094 - The 0.786 Fibonacci retracement level
- Major Resistance (R2): ₹1,275 - The all-time high achieved in July 2024 and psychological resistance
- Extended Resistance (R3): ₹1,400-₹1,500 - Projected based on measured move from the consolidation range
Technical Patterns and Indicators:
Chart Patterns:
- Descending Channel Breakout: The stock has successfully breached the cyan-colored descending trendline that acted as resistance since July 2024
- Rising Wedge Resolution: The consolidation pattern between August and October 2025 has resolved to the upside
- Base-on-Base Formation: The ₹433 level established in early 2024 served as the foundation for the subsequent rally, demonstrating strong long-term base support
- Cup and Handle (Potential): If the stock consolidates between ₹950-₹1,050 and then breaks out, it could form a cup and handle pattern projecting toward ₹1,400+
Fibonacci Analysis:
- The 61.8% Fibonacci retracement at ₹953 has been convincingly reclaimed, suggesting the corrective phase may be complete
- Golden ratio support held perfectly during the September-October consolidation
- The next Fibonacci target at 0.786 (₹1,094) represents the immediate upside objective
- Fibonacci extension levels project Upmove at ₹1,350 (1.272 extension) and ₹1,500 (1.618 extension) if the rally extends
Risk Factors and Invalidation Levels:
- A close below ₹920 would signal a potential false breakout
- Sustained trading below ₹850 would invalidate the bullish setup and suggest resumption of the downtrend
- Weekly close below the broken trendline (currently around ₹940) would be a bearish reversal signal
- Failure to maintain above 61.8% Fibonacci retracement could trigger another corrective leg
Fundamental and Sectoral Backdrop:
Company Fundamentals:
- Chennai Petroleum Corporation (CPCL) reported Q2 FY26 revenue of ₹16,327 crore with profit after tax of ₹719 crore
- The company achieved a crude throughput of 3.013 million metric tonnes (MMT) with a Gross Refining Margin (GRM) of $9.04 per barrel in Q2 FY26
- However, Q1 FY26 saw challenges with a net loss of ₹40 crore compared to a profit of ₹357 crore in Q1 FY25, primarily due to inventory losses and lower GRM of $3.22 per barrel
- For H1 FY26, CPCL recorded net profit of ₹689.68 crore versus a net loss of ₹294.45 crore in H1 FY25, with average GRM at $6.17 per barrel
- The company achieved a record crude throughput of 11.642 MMT with 111% capacity utilisation
Business Operations and Product Portfolio:
- CPCL is engaged in refining crude oil to produce various petroleum products, including LPG, Motor Spirit, Kerosene, Aviation Turbine Fuel, High Speed Diesel, Naphtha, Fuel Oil, and Bitumen
- The company also produces speciality products like Paraffin Wax, Mineral Turpentine Oil, Hexane, and Petrochemical feedstocks
- Most fuel products are marketed by the parent company, Indian Oil Corporation (IOC), while CPCL directly markets speciality products
- In 2024, CPCL commissioned new infrastructure, including Pharma Grade Hexane production and Sustainable Aviation Fuel
Financial Metrics and Valuation:
- Market capitalisation stands at approximately ₹14,584 crore, with the company maintaining a healthy dividend payout of 35%
- CPCL has demonstrated strong return on equity with a 3-year ROE of 31% and has reduced debt levels
- Current price-to-earnings and other valuation metrics suggest the stock is reasonably valued considering sectoral challenges
Sector Outlook and Industry Trends:
- India's refining capacity increased to 258.1 MMTPA as of FY25, with domestic consumption at 239.2 MMTPA
- India is expected to drive global oil demand growth, with consumption projected at 5.74 million barrels per day in 2025 and 5.99 million bpd in 2026
- The country plans to expand refining capacity to 309.5 MMTPA by 2028
- Refinery output has been strong, with manufacturing IIP for refined petroleum products rising 4.24% in June 2025, driven by auto-fuel demand growth of 7.9% year-on-year
- However, refining margins are expected to fall below mid-cycle levels in FY25, indicating potential profitability challenges
Opportunities and Challenges:
Opportunities:
- Downstream activities driven by refinery-petrochemical integration are projected to post the highest 5.2% CAGR through 2030
- Growing domestic demand for petroleum products with urbanisation and economic growth
- Government initiatives supporting energy infrastructure development
- Indian refiners have benefited from processing discounted Russian crude, generating significant margins
Challenges:
- Net profit declined for the last two quarters, with an average decrease of 108.5% per quarter, and revenue fell 14.1% per quarter
- Volatile crude oil prices and fluctuating gross refining margins
- India's domestic crude oil production has fallen 26.3% and natural gas by 24.1% during FY12-FY25, leading to increased import dependency
- Environmental regulations and pressure to transition toward cleaner energy
- Institutional investment in CPCL decreased by 37.83% over the past 30 days
Competitive Position:
- CPCL is a subsidiary of Indian Oil Corporation, providing strategic advantages in product marketing and distribution
- The company competes with major refiners, including Reliance Industries, Bharat Petroleum, Hindustan Petroleum, and Mangalore Refinery
- CPCL's core vision is to be the most admired Indian energy company, creating value through world-class performance and ethical governance
- The company's location in South India provides strategic advantages for serving the region's growing energy needs
Fundamental Risks:
- The stock trades at reasonable valuations with potential upside to fair value estimates around ₹1,050
- Strong Q2 performance suggests earnings momentum is improving after a weak Q1
- Sectoral tailwinds from growing domestic demand support medium-term prospects
- Key risks include GRM volatility, crude price fluctuations, and regulatory changes
My 2 Cents:
- CPCL presents a compelling technical setup following the breakout from a multi-month consolidation pattern
- The combination of volume expansion, Fibonacci support, and trendline breach suggests potential for further upside
- Risk management is critical given sectoral volatility; strict adherence to stop losses is recommended
Full Coverage on my Newsletter this Week
Keep in the Watchlist and DOYR.
NO RECO. For Buy/Sell.
📌Thank you for exploring my idea! I hope you found it valuable.
🙏FOLLOW for more
👍BOOST if you found it useful.
✍️COMMENT below with your views.
Meanwhile, check out my other stock ideas on the right side until this trade is activated. I would love your feedback.
As per the Latest SEBI Mandate, this isn't a Trading/Investment RECOMMENDATION nor for Educational Purposes; it is just for Informational purposes only. The chart data used is 3 Months old, as Showing Live Chart Data is not allowed according to the New SEBI Mandate.
Disclaimer: "I am not a SEBI REGISTERED RESEARCH ANALYST AND INVESTMENT ADVISER."
This analysis is intended solely for informational purposes and should not be interpreted as financial advice. It is advisable to consult a qualified financial advisor or conduct thorough research before making investment decisions.
SAMMAAN Capital: Trendline Breakout, Chart of the weekFrom Housing Finance Giant to NBFC Phoenix: Why NSE:SAMMAANCAP Breakout Could Signal a Multi-Bagger Opportunity. Let's Analyse in the Chart of the Week.
As per the Latest SEBI Mandate, this isn't a Trading/Investment RECOMMENDATION nor for Educational Purposes; it is just for Informational purposes only. The chart data used is 3 Months old, as Showing Live Chart Data is not allowed according to the New SEBI Mandate.
Disclaimer: "I am not a SEBI REGISTERED RESEARCH ANALYST AND INVESTMENT ADVISER."
This analysis is intended solely for informational purposes and should not be interpreted as financial advice. It is advisable to consult a qualified financial advisor or conduct thorough research before making investment decisions.
Price Action Analysis:
Overall Trend Structure:
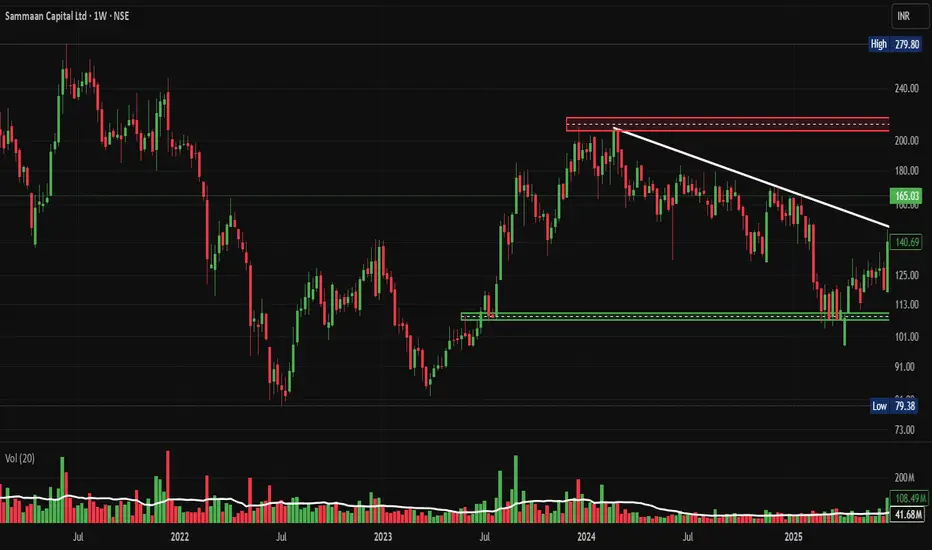
- The stock has been in a prolonged downtrend from its recent high of ₹260 in early 2022
- A major capitulation event occurred in July 2024, creating a panic low at ₹79.38
- Since the July 2024 low, the stock has formed a clear accumulation phase with higher lows
- Recent price action shows a strong breakout from a descending trendline that acted as resistance since early 2024
- Current price at ₹165.03 represents a 107% rally from the lows, indicating strong momentum recovery
Candlestick Patterns & Momentum:
- The most recent weekly candle shows a massive bullish engulfing pattern with a substantial body, suggesting strong buying conviction
- Price has cleared multiple resistance zones with authority, indicating institutional accumulation
- The breakout candle shows no upper wick, demonstrating aggressive buying and a lack of selling pressure at higher levels
- Consecutive green candles in recent weeks suggest sustained buying interest
- The price action exhibits characteristics of a potential trend reversal from bear to bull phase
Moving Averages & Dynamic Support:
- Price has reclaimed all major short-term moving averages
- The stock is now trading above its 50-week moving average
- A golden cross formation appears imminent as shorter-term MAs cross above longer-term MAs
- Previous resistance zones are now expected to act as support on pullbacks
Volume Spread Analysis:
Volume Profile:
- Massive volume spike on the latest breakout candle (462.74M vs average 86.92M) - approximately 5.3x the average volume
- This represents the highest volume since early 2022, indicating significant institutional participation
- Volume during the accumulation phase (July 2024 - September 2025) was relatively subdued, typical of smart money accumulation
- Previous high-volume events coincided with panic selling in 2022 and mid-2024
- Current volume expansion during upward movement is a classic sign of breakout validity
Volume-Price Correlation:
- The price-to-volume ratio shows a healthy correlation during the recent rally
- Higher volume on up days compared to down days indicates bullish sentiment
- The massive volume breakout suggests this move has strong institutional backing
- No signs of distribution (high volume on down days) at current levels
Volume Analysis Inference:
- The 5x volume expansion confirms a genuine breakout rather than a false move
- Smart money appears to be entering positions aggressively
- Retail participation is likely to increase given the media coverage and the F&O ban lifting
- Volume profile supports continuation of the uptrend in the near-term
Key Support & Resistance Levels:
Major Resistance Zones:
- R1 (Immediate): ₹175-180 - Minor psychological resistance
- R2 (Near-term): ₹200-220 - Previous consolidation zone and descending trendline confluence
- R3 (Major): ₹240-260 - Recent high zone with significant supply potential
- R4 (Psychological): ₹300 - Round number psychological barrier
Major Support Zones:
- S1 (Immediate): ₹150-155 - Recent breakout level, now acting as support
- S2 (Strong): ₹135-140 - Multiple touch points and previous resistance turned support
- S3 (Critical): ₹113-120 - Horizontal support zone with high volume node
- S4 (Ultimate): ₹100-105 - Major accumulation zone and swing low area
Key Price Levels to Watch:
- Breakdown level to watch: ₹145 (invalidation of bullish setup)
- Pivotal zone: ₹135-140 (must hold for bullish continuation)
- Stop-loss zone for longs: Below ₹130
Base Formation & Pattern Recognition:
Primary Base Structure:
- The base shows characteristics of a "Stage 1" accumulation base as per the Weinstein methodology
Secondary Patterns Identified:
- Descending Channel: From January 2024 to September 2025, the stock traded within a falling channel
- Breakout Pattern: Recent weekly candle broke above the descending trendline resistance with authority
- Double Bottom: A smaller double bottom formation exists at the ₹100-105 level (June-July 2025)
- Higher Low Sequence: Since the July 2024 bottom, the stock has made consistent higher lows - ₹79, ₹100, ₹130, ₹135
Pattern Implications:
- The quality of base formation (15 months) indicates strong institutional accumulation
Technical Indicators Assessment:
Trend Indicators:
- Price trading above descending trendline for the first time in 18 months
- Structure shifted from lower highs/lower lows to higher highs/higher lows
- Breakout above multi-month resistance confirms trend reversal
- Weekly timeframe showing a clear momentum shift
Volatility Indicators:
- Recent expansion in price range indicates increasing volatility
- Volatility expansion during upward movement is a bullish characteristic
- ATR (Average True Range) is likely expanding, providing better trading opportunities
Diversification Rules:
- Maximum NBFC/Financial sector exposure: 15-20% of portfolio
- Since Sammaan Capital is an NBFC, ensure other NBFC holdings don't exceed the sector limit
- Correlation check: Avoid overweight in stocks moving in tandem
- Rebalance if a single position grows beyond 10% due to appreciation
Risk Management Framework:
Technical Risk Factors:
- Breakout failure risk: 30% probability of pullback to ₹140-150
- False breakout risk: Volume sustenance needed for confirmation
- Resistance rejection risk: ₹220 zone has strong supply potential
- Trend reversal risk: Any weekly close below ₹130 invalidates the bullish thesis
- Volatility risk: NBFC stocks prone to sudden regulatory/news-driven moves
Risk Mitigation Strategies:
- Never invest more than planned position size, even if the setup looks perfect
- Use limit orders instead of market orders to avoid slippage
- Don't average down if SL is hit - accept loss and re-evaluate
- Keep a 30% cash reserve for better entry opportunities
- Use trailing stops religiously once in profit
- Maintain a trading journal to track decisions and learn from mistakes
Portfolio Risk Constraints:
- Maximum drawdown tolerance: 20% on this position
- Overall portfolio heat: Not more than 4-5% at risk across all open positions
- Correlation check: If market corrects 5%, financial stocks may correct 7-8%
- Sector concentration: Limit NBFC exposure even if multiple opportunities arise
- Black swan provision: Always keep an emergency exit plan
Risk Monitoring Checklist:
- Daily: Check if price respects support zones
- Weekly: Review volume patterns and trend integrity
- Monthly: Reassess fundamental drivers and news flow
- Quarterly: Deep-dive into earnings, asset quality, regulatory changes
- Event-driven: Monitor RBI policies, interest rate decisions, sector news
Exit Risk Management:
- Never hold through a major support breakdown, hoping for recovery
- If SL hit, stay away for 2-3 weeks before re-entry consideration
- Avoid revenge trading after the stop-loss trigger
- Book partial profits at predetermined levels - don't get greedy
- If the target is achieved faster than expected, evaluate for signs of exhaustion
Sectoral Analysis - NBFC & Housing Finance:
NBFC Sector Overview:
- NSE:SAMMAANCAP is a mortgage-focused non-banking financial company (NBFC) regulated by the Reserve Bank of India (RBI) and rated 'AA' by CRISIL and ICRA
- The NBFC sector has witnessed consolidation over the past 3 years post-COVID disruptions
- The regulatory framework has tightened with the RBI implementing scale-based regulations
- A favourable policy environment exists with a stable macroeconomic backdrop
- Housing finance remains a priority sector with government's push for affordable housing
Current Sector Dynamics:
- Interest rate cycle appears to be stabilising after aggressive hikes in 2022-2023
- Credit growth in retail segments (housing, LAP) remains robust at 15-18% YoY
- Asset quality concerns have moderated across the NBFC sector
- Competition is intensifying with banks offering competitive home loan rates
- Digital transformation and fintech partnerships reshaping distribution
Sector Growth Drivers:
- India's housing demand remains strong, driven by urbanization and nuclear families
- Under-penetrated mortgage market compared to developed economies (10% vs 50-70% mortgage-to-GDP)
- Government schemes like PMAY (Pradhan Mantri Awas Yojana) support affordable housing
- The Loan Against Property (LAP) segment is growing as businesses seek growth capital
- Co-lending arrangements between NBFCs and banks gaining traction
Sector Headwinds:
- Asset-liability management challenges for smaller NBFCs
- Rising cost of funds impacting margins
- Regulatory compliance costs are increasing
- Competition from banks with lower cost of funds
- Economic slowdown risks impacting borrower repayment capacity
Regulatory Environment:
- RBI's scale-based regulation framework implemented in October 2022
- Enhanced monitoring of large NBFCs (asset size >₹10,000 crore)
- Stricter provisioning and capital adequacy norms
- Focus on corporate governance and risk management frameworks
- Recent F&O ban lifting indicates regulatory confidence restoration
Fundamental Analysis:
Business Model & Operations:
- Incorporated in 2005, registered and regulated by the National Housing Bank (NHB), engaged in providing home loans, loans against property, corporate mortgage loans, lease rental discounting, and residential construction finance
- The company has adopted an asset-light business model with a differentiated origination strategy and proven co-lending execution across affordable housing and MSME segments
- Operates with co-lending partnerships - had 10 bank partnerships as of September 2024, with plans to increase to 12 by March 2025
- Product portfolio: Home Loans, Loan Against Property (LAP), Construction Finance, Lease Rental Discounting
Financial Performance Analysis
- Market capitalization: ₹13,670 crore; Revenue: ₹8,947 crore; Current year profit: -₹1,800 crore
- The company has delivered poor sales growth of -8% over the past five years
- Q1 FY26: Reported profit of ₹334 crore on total income of ₹2,400 crore; For FY25, posted loss of -₹1,807 crore on total income of ₹8,676 crore
- Recent profitability turnaround visible in quarterly results suggests business stabilization
- The company has a low interest coverage ratio, indicating higher financial leverage
Recent Corporate Developments:
- Abu Dhabi's IHC (International Holding Company) approved preferential allotment to buy 43.5% stake for ₹8,850 crore through Avenir Investment RSC Ltd, paving the way for IHC to assume promoter status
- This massive foreign investment indicates strong confidence in turnaround story
- Company rebranded from Indiabulls Housing Finance to Sammaan Capital to shed legacy issues
- Credit ratings upgraded by S&P and Moody's changed outlook to 'positive' from 'stable'; retained AA/Stable rating from CRISIL and ICRA
- F&O ban recently lifted, signalling renewed market confidence
Asset Quality & Risk Metrics:
- Assets Under Management of ₹12,777 crore as of September 2024
- Shift towards an asset-light model, reducing balance sheet risk
- Co-lending partnerships diversify risk and improve capital efficiency
- Need to monitor gross NPA and net NPA trends in upcoming quarters
- Provisioning coverage ratio and capital adequacy ratio are key metrics to watch
Valuation Metrics:
- PE ratio currently at 0, indicating the company was loss-making in the recent period
- Market cap growth of 3.48% the last 1 year - recent rally not fully reflected in this data
- Price-to-Book ratio likely attractive given low valuation during the distress period
- Current valuation at ₹165 offers asymmetric risk-reward if turnaround sustains
- Comparable NBFCs trading at 1.5-3x book value; Sammaan could rerate as profitability improves
Management & Corporate Governance:
- Company underwent significant management changes post-rebranding
- Abu Dhabi's IHC taking promoter status brings international credibility
- Focus on transparent reporting and governance improvements post legacy issues
- Strategic shift to asset-light model shows adaptive management
Competitive Position & Market Share:
- Competes with players like HDFC Ltd, LIC Housing Finance, PNB Housing, and Bajaj Housing Finance
- Differentiated strategy focusing on emerging geographies and affordable housing segment
- Co-lending model provides a competitive advantage in a capital-constrained environment
- Brand recall is still building after rebranding from Indiabulls
Key Strengths:
- Strong rating from CRISIL and ICRA (AA/Stable) indicates a robust credit profile
- ₹8,850 crore investment by Abu Dhabi's IHC validates business potential
- Asset-light model reduces capital requirements and improves ROE potential
- Regulatory compliance and risk management frameworks strengthened
- Experienced in affordable housing and MSME lending segments
Key Concerns & Risks:
- Historical loss of ₹1,800 crore in FY25 raises sustainability questions
- Poor revenue growth of -8.08% over 5 years indicates business challenges
- A low interest coverage ratio suggests vulnerability to interest rate volatility
- Ongoing investigations related to past operations remain overhang
- Execution risk in scaling up co-lending partnerships
- Asset quality deterioration risk if economic conditions weaken
Integrated Technical-Fundamental Outlook:
Confluence Factors Supporting Bullish Thesis:
- Technical breakout coinciding with fundamental catalysts (IHC investment, F&O ban lifting)
- Volume expansion confirming institutional interest aligning with ₹8,850 crore IHC investment
- 15-month base formation suggesting strong accumulation by informed investors
- Credit rating upgrades provide fundamental validation to the technical setup
- Quarterly profitability turnaround supporting higher valuation rerating
Scenario Analysis:
Bull Case Scenario
- IHC investment successfully closes and brings operational improvements
- Asset quality remains stable, and profitability is sustained in the upcoming quarters
- Co-lending partnerships expand as planned, driving AUM growth
Base Case Scenario
- Business stabilises with moderate growth in AUM and profitability
- Volatility remains elevated due to sector and stock-specific news
Bear Case Scenario
- Asset quality deterioration or operational challenges emerge
- IHC deal gets delayed or faces regulatory hurdles
- Technical breakdown below ₹145 leads to retest of ₹120-130 zone
- Macro headwinds (RBI policy tightening, economic slowdown) impact the sector
- Exit recommended if the weekly close is below ₹130
Critical Events to Monitor:
Next 3 Months:
- Completion of IHC preferential allotment and fund infusion
- Q2 FY26 earnings (October/November 2025) - profitability sustainability check
- Any regulatory updates or clarifications on past investigations
- Technical retest of ₹150-155 support zone and price reaction
Next 6 Months:
- Q3 FY26 earnings showing consistent profitability
- Expansion of co-lending partnerships (target 12 banks)
- AUM growth trajectory and disbursement trends
- NPA trends and provisioning coverage
- Technical breakout above ₹220 resistance
Next 12 Months:
- Full-year FY26 results demonstrating turnaround completion
- Market share gains in affordable housing and LAP segments
- ROE and ROA improvement trends
- PE multiple rerating towards industry average
Recommended Action Plan:
- Allocate 4-6% of portfolio with strict stop-loss discipline
- Book partial profits
- Trail remaining position
- Monitor quarterly results and credit metrics religiously
- Re-evaluate thesis if any fundamental red flag emerges
My 2 Cents:
The chart presents a textbook example of a turnaround setup with a well-defined 15-month base formation, decisive breakout on exceptional volume (5.3x average), and a clear risk-reward structure. The combination of descending channel breakout and momentum shift from lower lows to higher highs creates a compelling technical narrative.
NSE:SAMMAANCAP represents a high-risk, high-reward turnaround play backed by credible fundamental catalysts. The ₹8,850 crore investment by Abu Dhabi's IHC provides a strong validation of intrinsic value. The transition to an asset-light model, credit rating upgrades, and return to quarterly profitability suggest the worst may be behind. However, the legacy of past losses, low interest coverage, and ongoing investigations warrants cautious optimism and strict risk management.
Full Coverage on my Newsletter this Week
Keep in the Watchlist and DOYR.
NO RECO. For Buy/Sell.
📌Thank you for exploring my idea! I hope you found it valuable.
🙏FOLLOW for more
👍BOOST if you found it useful.
✍️COMMENT below with your views.
Meanwhile, check out my other stock ideas on the right side until this trade is activated. I would love your feedback.
As per the Latest SEBI Mandate, this isn't a Trading/Investment RECOMMENDATION nor for Educational Purposes; it is just for Informational purposes only. The chart data used is 3 Months old, as Showing Live Chart Data is not allowed according to the New SEBI Mandate.
Disclaimer: "I am not a SEBI REGISTERED RESEARCH ANALYST AND INVESTMENT ADVISER."
This analysis is intended solely for informational purposes and should not be interpreted as financial advice. It is advisable to consult a qualified financial advisor or conduct thorough research before making investment decisions.
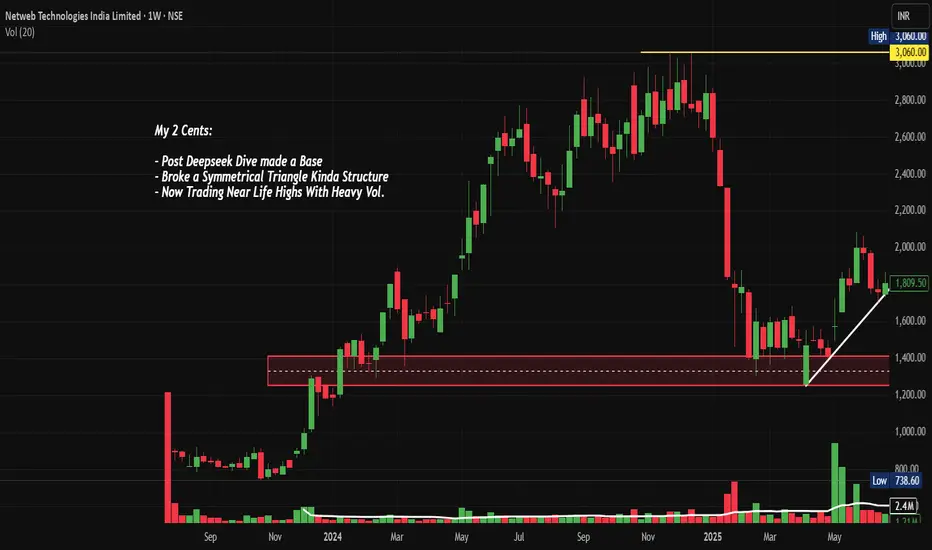
NETWEB: AI Infrastructure Goldmine ? Chart of the MonthNSE:NETWEB MarchingTowards 4,000: Is This the AI Infrastructure Goldmine You've Been Waiting For? Let's analyze in the "Chart of the Month".
As per the Latest SEBI Mandate, this isn't a Trading/Investment RECOMMENDATION nor for Educational Purposes; it is just for Informational purposes only. The chart data used is 3 Months old, as Showing Live Chart Data is not allowed according to the New SEBI Mandate.
Disclaimer: "I am not a SEBI REGISTERED RESEARCH ANALYST AND INVESTMENT ADVISER."
This analysis is intended solely for informational purposes and should not be interpreted as financial advice. It is advisable to consult a qualified financial advisor or conduct thorough research before making investment decisions.
Price Action Analysis:
- Current Price: ₹3,695.40
- 52-Week Range: ₹738.60 - ₹3,745.00
- Recent Performance: +64% gain in a Month with strong momentum
- Price structure shows consistently higher highs and higher lows pattern
- Stock has demonstrated remarkable resilience with a 380% rally from its 52-week low
Volume Spread Analysis:
- Volume surge visible during recent breakout phases
- High volume of 24.25M shares traded, indicating institutional participation
- Volume expansion coinciding with price breakouts confirms genuine buying interest
- Strong volume accumulation during consolidation phases suggests smart money positioning
Chart Patterns Identified:
- Symmetrical Triangle Breakout: Successfully broken above the triangle pattern
- Ascending Triangle: Multiple resistance tests followed by decisive breakout
- Flag and Pennant Patterns: Short-term consolidation after sharp moves
Key Technical Levels:
Support Levels:
- Immediate Support: ₹3,200 (recent consolidation zone)
- Strong Support: ₹2,800 (previous resistance turned support)
- Major Support: ₹2,400 (trendline support and psychological level)
- Critical Support: ₹2,000 (long-term ascending trendline)
Resistance Levels:
- Immediate Resistance: ₹3,745 (52-week high)
- Next Resistance: ₹4,000 (psychological round number)
- Extended Resistance: ₹4,400 (measured move projection)
- Long-term Resistance: ₹5,000
Base Formation:
- Primary Base: ₹1,200-₹1,600 range (established during deep consolidation)
- Secondary Base: ₹2,400-₹2,800 range (recent re-accumulation zone)
- The stock has clearly established a strong foundation above the ₹2,400 levels
Technical Indicators Assessment:
Momentum Indicators:
- RSI is in overbought territory but showing positive divergence
- MACD showing bullish crossover with expanding histogram
- Stochastic indicates strong upward momentum
- ADX suggesting strong trending behaviour
Moving Averages:
- Price trading well above all major moving averages
- 20 EMA, 50 EMA, and 200 EMA in perfect bullish alignment
- Strong uptrend confirmed by ascending moving averages
- No signs of trend reversal in the near term
Sectoral and Fundamental Backdrop:
AI Infrastructure Sector Outlook:
- India's IndiaAI Mission with ₹10,372 crore budget creating massive opportunities
- Government's push for sovereign AI infrastructure benefiting domestic players
- Global demand for AI computing infrastructure is experiencing exponential growth
- Limited domestic competition in the high-end computing solutions space
Company-Specific Fundamentals:
- Netweb's supercomputers have appeared 15 times across three entries in the global Top 500 supercomputers ranking
- The company is almost debt-free with a market cap of ₹20,936 crore
- Recent order wins worth ₹1,734 crore for IndiaAI Mission and ₹450 crore additional order
- Order pipeline of ₹4,142.1 crore as of June 2025, excluding new mandates
Key Growth Catalysts:
- Delivery of servers built on NVIDIA's Blackwell Architecture for India's Sovereign AI System
- Expanding presence in high-performance computing and AI systems
- Strong relationships with global technology partners
- Beneficiary of the government's Digital India and AI initiatives
Financial Performance Metrics:
- Strong revenue visibility from a large order book
- Improving profit margins due to premium product offerings
- Healthy cash flows supporting future expansion
- Zero debt structure providing financial flexibility
Strategic Outlook:
- Expect continued momentum driven by the AI infrastructure theme
- News-driven volatility possible around order execution updates
- Sector rotation into a technology infrastructure play is expected
- Quarterly results will be the key catalyst for sustained momentum
- India's AI infrastructure buildout is a multi-year opportunity
- The company is well-positioned to capture significant market share
Risk Factors to Monitor:
Technical Risks:
- Overbought conditions may lead to profit-taking
- High volatility expected given the stock's momentum
- Any break below ₹3,000 would signal trend weakness
Fundamental Risks:
- Execution risk on large government orders
- Competition from global players in AI infrastructure
- Technology disruption risks in a rapidly evolving sector
- Dependence on government spending cycles
Market Risks:
- Overall market correction could impact high-beta stocks
- Sector rotation away from technology themes
- Global supply chain disruptions affecting component availability
My 2 Cents:
NSE:NETWEB presents a compelling technical setup with strong fundamental support from India's push for AI infrastructure. The stock's breakout from multiple chart patterns, combined with substantial order wins and sector tailwinds, creates an attractive risk-reward proposition. However, position sizing and disciplined risk management remain crucial given the stock's high volatility and premium valuation.
Full Coverage on my Newsletter this Week
Keep in the Watchlist and DOYR.
NO RECO. For Buy/Sell.
📌Thank you for exploring my idea! I hope you found it valuable.
🙏FOLLOW for more
👍BOOST if you found it useful.
✍️COMMENT below with your views.
Meanwhile, check out my other stock ideas on the right side until this trade is activated. I would love your feedback.
As per the Latest SEBI Mandate, this isn't a Trading/Investment RECOMMENDATION nor for Educational Purposes; it is just for Informational purposes only. The chart data used is 3 Months old, as Showing Live Chart Data is not allowed according to the New SEBI Mandate.
Disclaimer: "I am not a SEBI REGISTERED RESEARCH ANALYST AND INVESTMENT ADVISER."
This analysis is intended solely for informational purposes and should not be interpreted as financial advice. It is advisable to consult a qualified financial advisor or conduct thorough research before making investment decisions.
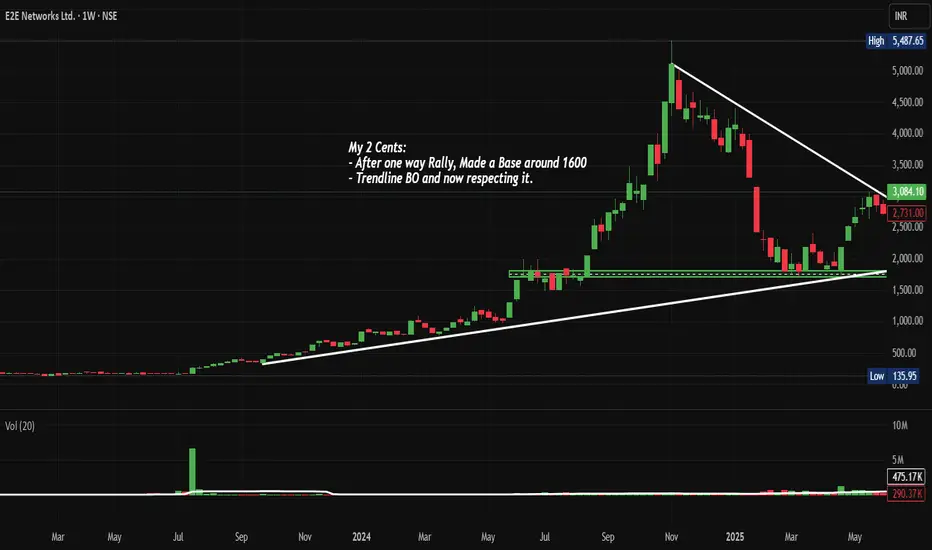
E2E: Base Formation and Trend Change Chart of the WeekNSE:E2E : Cloud Computing Giant Shows Strong Breakout After Trendline Breakout. Let's analyse in "Chart of the Week"
As per the Latest SEBI Mandate, this isn't a Trading/Investment RECOMMENDATION nor for Educational Purposes; it is just for Informational purposes only. The chart data used is 3 Months old, as Showing Live Chart Data is not allowed according to the New SEBI Mandate.
Disclaimer: "I am not a SEBI REGISTERED RESEARCH ANALYST AND INVESTMENT ADVISER."
This analysis is intended solely for informational purposes and should not be interpreted as financial advice. It is advisable to consult a qualified financial advisor or conduct thorough research before making investment decisions.
Price Action Analysis:
• Stock has formed a massive symmetrical triangle/wedge pattern
• Recent breakout above the upper trendline resistance around 2,900-3,000 levels
• Currently trading at 3,084.10 with strong momentum and above-average volume
• Price action shows a clear shift from consolidation to the trending phase
• Multiple higher lows formation during the consolidation phase indicates underlying strength
Volume Spread Analysis:
• Volume spike visible during the recent breakout, confirming genuine buying interest
• Volume at 813.46K vs average volume of 422.91K, indicating a 92% increase
• Consistent volume support during the base formation phase
• Volume-price confirmation suggests institutional participation
Key Technical Levels:
Support Levels:
• Primary Support: 2,700-2,800 (previous resistance turned support)
• Secondary Support: 2,400-2,500 (triangle breakout level)
• Major Support: 2,000-2,100 (psychological level and previous consolidation zone)
Resistance Levels:
• Immediate Resistance: 3,200-3,300 (next psychological level)
• Major Resistance: 3,500-3,600 (measured move target from triangle)
• All-time High: 5,487.65 (long-term target)
Technical Patterns:
• Symmetrical Triangle: 15-month consolidation pattern completed with upside breakout
• Base Formation: Strong base around 1,600 levels as mentioned in the chart annotation
• Ascending Triangle: Multiple retests of resistance with higher lows
• Volume Breakout Pattern: Confirmed with increased participation
Technical Assessment:
• Trendline Breakout: Clean break above descending trendline resistance
• Price Structure: Shift from consolidation to trending phase
• Momentum: Strong upward momentum post-breakout
• Support-Resistance Flip: Previous resistance becomes new support
Risk Management:
• Maximum Risk: 10% of position size
• Volatility Risk: High (small-cap IT stock)
• Sector Risk: Technology sector concentration
Risk Mitigation:
• Diversification across the IT portfolio
• Position sizing discipline
• Regular monitoring of technical levels
• Sector rotation consideration
Sectoral Analysis:
Industry Overview:
• India's data center industry is undergoing a major transformation, driven by the rapid rise in digital adoption, AI-driven workloads, and cloud computing adoption
• In 2025, E2E Cloud, a leading AI-centric cloud service provider, announced the launch of India's largest NVIDIA H200 GPU infrastructure
• Strong government support for Digital India initiatives
• Growing demand for cloud computing and AI/ML services
Sector Positioning:
• E2E network provides a full-stack AI/ML and GenAI cloud ecosystem designed for scalable, accessible, and cost-efficient deployment of large-scale compute clusters
• E2E Networks provides enterprise-grade GPU computing at a much lower cost by removing the complexity and extra expenses linked to global hyperscale providers
• Strategic focus on AI and machine learning infrastructure
• Competitive advantage in cost-effective cloud solutions
Growth Drivers:
• Increasing AI adoption across industries
• Digital transformation acceleration post-COVID
• Government push for data localization
• Growing startup ecosystem requiring cloud infrastructure
Fundamental Backdrop:
Financial Performance:
• Revenue: 159 Cr with Profit: 34.5 Cr (TTM)
• Revenue from operations slumped -12.63% YoY to Rs 36.11 crore in Q1 FY26
• Profit before tax (PBT) stood at Rs -2.84 crore in Q1 FY26, steeply lower than Rs 10.14 crore in Q1 FY25
• Strong profitability growth trajectory
Market Capitalization & Valuation:
• Mkt Cap: 6,166 Crore (up 10.8% in 1 year)
• Small Cap company classification
Shareholding Pattern:
• Promoter Holding: 40.6%
• Promoter holding has decreased over the last quarter: -3.00%
• Mutual Fund Shareholding in E2E Networks was 1.86%
• Strong promoter holding with some recent reduction
Business Model Strength:
• E2E CDN is a global content delivery network that distributes your content & web pages to end-users with minimal latency
• Asset-light scalable business model
• Recurring revenue from cloud services
• Growing customer base in the AI/ML segment
Key Concerns:
• Though the company is reporting repeated profits, it is not paying out a dividend
• High valuation multiples indicate growth expectations
• Small-cap volatility and liquidity concerns
• Intense competition from global cloud providers
Bull Case:
• Strong technical breakout
• Leadership position in Indian AI/ML cloud infrastructure
• Beneficiary of India's digital transformation
• Scalable business model with high growth potential
Bear Case:
• Expensive valuation with high growth expectations
• Competition from global hyperscalers
• Small-cap inherent volatility
• Dependency on the technology sector performance
Overall Assessment:
• Technically strong setup with favourable risk-reward
• Fundamentally positioned in a high-growth sector
• Regular monitoring required due to small-cap nature
Full Coverage on my Newsletter this Week
Keep in the Watchlist and DOYR.
NO RECO. For Buy/Sell.
📌Thank you for exploring my idea! I hope you found it valuable.
🙏FOLLOW for more
👍BOOST if you found it useful.
✍️COMMENT below with your views.
Meanwhile, check out my other stock ideas on the right side until this trade is activated. I would love your feedback.
As per the Latest SEBI Mandate, this isn't a Trading/Investment RECOMMENDATION nor for Educational Purposes, it is just for Informational purposes only. The chart data used is 3 Months old, as Showing Live Chart Data is not allowed according to the New SEBI Mandate.
Disclaimer: "I am not a SEBI REGISTERED RESEARCH ANALYST AND INVESTMENT ADVISER."
This analysis is intended solely for informational purposes and should not be interpreted as financial advice. It is advisable to consult a qualified financial advisor or conduct thorough research before making investment decisions.
Chola Fin. Formed Short Term BaseNSE:CHOLAFIN made a short-term base of 1168-1185 and is near its BO Levels of 1343.15 with RSI and MACD Trending Upwards.
About:
NSE:CHOLAFIN is one of India's premier diversified non-banking finance companies, engaged in providing vehicle finance, home loans and loans against property.
F&O Activity:
Significant Long Buildup With 1300 CE OI Significantly Decreased.
Trade Setup:
It looks like a good 1:1 Trade with the Recent Base as a Stop Loss for a Swing Trade after it Crosses Key Levels of 1343.15.
Target(Take Profit):
Around 1507 Levels for Swing & Positional Traders
Stop Loss:
The base of Channel 1168 for Positional Traders and Entry Candle Low for Swing Traders.
📌Thank you for exploring my idea! I hope you found it valuable.
🙏FLLOW for more
👍BOOST if useful
✍️COMMENT Below your views.
Meanwhile, check out my other stock ideas below until this trade is activated. I would love your feedback.
Disclaimer: "I am not SEBI REGISTERED RESEARCH ANALYST AND INVESTMENT ADVISER."
This analysis is intended solely for informational and educational purposes only and should not be interpreted as financial advice. It is advisable to consult a qualified financial advisor or conduct thorough research before making investment decisions.

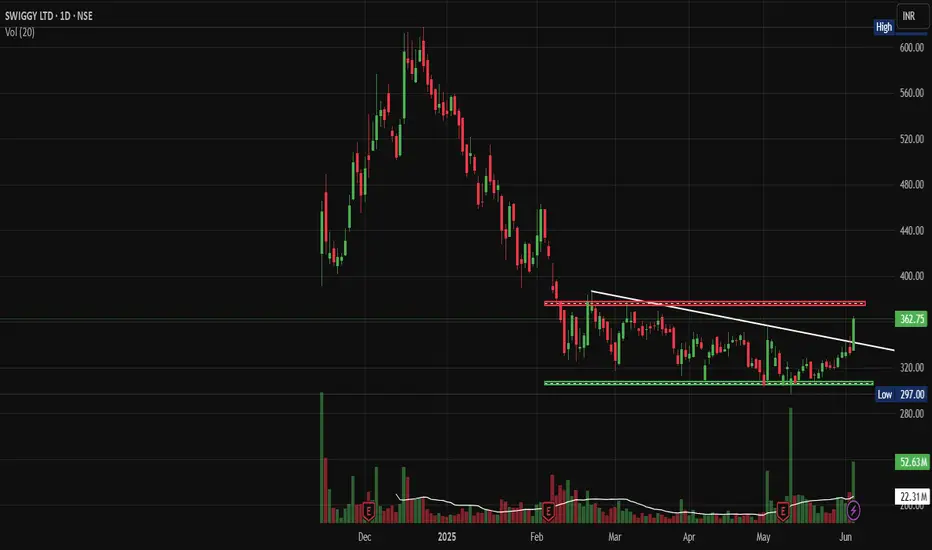
Swiggy Base and Trendline BONSE:SWIGGY gains as Morgan Stanley starts coverage with 'overweight' rating; sees 22% upside.
On Daily Chart, it Could Signal a 35% Breakout - Here's the Exact Level Every Trader is Watching
Price Action Analysis:
The chart reveals a classic consolidation phase following Swiggy's IPO debut in November 2024. After an initial surge to highs around 465 levels post-listing, the stock underwent a significant correction, falling to lows near 297 in March 2025. Currently trading at 362.75, the stock shows signs of building a base in the 310-370 range.
Volume Analysis:
Volume patterns indicate institutional interest with notable spikes during key price movements. The stock gained nearly 17% on its trading debut, signalling growing investor confidence in food and grocery delivery firms. The recent volume of 22.31M shares suggests active participation, though lower than peak trading days.
Key Technical Levels:
Support Levels:
- Primary Support: 305-310 (marked by green horizontal line)
- Secondary Support: 297 (March 2025 low)
- Critical Support: 280 (psychological level)
Resistance Levels:
- Immediate Resistance: 370-375 (red horizontal line marking recent highs)
- Major Resistance: 420-430 (post-IPO consolidation zone)
- Ultimate Target: 465 (all-time high)
Base Formation:
The stock has formed a rectangular consolidation base between 310-370 levels over the past 3-4 months. This 4-month base-building phase indicates potential accumulation by institutional investors, typical behaviour post-IPO as initial volatility settles.
Technical Patterns:
A descending trendline resistance (marked in white) from the March highs is being breached. The current price action suggests a potential breakout from this falling wedge pattern, which is typically bullish.
Trade Setup:
Entry Strategy:
- Conservative Entry: 375+ on breakout above resistance with volume confirmation
- Aggressive Entry: 365-368 on current levels for base play
Exit Levels:
- Target 1: 400 (intermediate resistance)
- Target 2: 430 (major resistance zone)
- Target 3: 465 (all-time high retest)
Stop Loss:
- For breakout trade: 355 (below recent consolidation)
- For base play: 305 (below primary support)
Position Sizing and Risk Management:
- Risk per trade: Maximum 2% of portfolio
- Position size calculation: (Portfolio value × 2%) ÷ (Entry price - Stop loss)
- For a 100,000 portfolio: (100,000 × 2%) ÷ (365 - 305) = 33 shares maximum
- Reward-to-risk ratio: 1:2.5 minimum
Sectoral and Fundamental Backdrop:
NSE:SWIGGY food delivery business achieved profitability in March, with a current market cap of 83,088 crores and revenue of 15,227 crores. However, the company still reports losses of 3,117 crores, indicating it's in a growth investment phase.
The IPO was priced at ₹390 per share, raising ₹11,327.43 crores, providing substantial capital for expansion. The company operates a hyperlocal on-demand delivery model, connecting nearby restaurants and service providers to customers, with diversification into grocery delivery (Instamart) and logistics services.
The food-tech sector in India remains attractive due to increasing digitization and changing consumer behaviour. Recent antitrust concerns regarding discount practices by fast-delivery companies, including Swiggy, indicate regulatory scrutiny, which could impact future growth strategies.
Risk Factors:
- High cash burn rate despite revenue growth
- Intense competition with Zomato, Zepto and other players
- Regulatory challenges in the quick commerce space
- Market volatility affecting new-age tech stocks
My Take:
The technical setup suggests accumulation phase completion with potential for a significant move higher, supported by improving fundamentals in the core food delivery business, achieving profitability. Follow the Strict Trade Plan as Explained Above.
Keep in the Watchlist.
NO RECO. For Buy/Sell.
📌Thank you for exploring my idea! I hope you found it valuable.
🙏FOLLOW for more
👍BOOST if you found it useful.
✍️COMMENT below with your views.
Meanwhile, check out my other stock ideas on the right side until this trade is activated. I would love your feedback.
Disclaimer: "I am not a SEBI REGISTERED RESEARCH ANALYST AND INVESTMENT ADVISER."
This analysis is intended solely for informational and educational purposes and should not be interpreted as financial advice. It is advisable to consult a qualified financial advisor or conduct thorough research before making investment decisions.
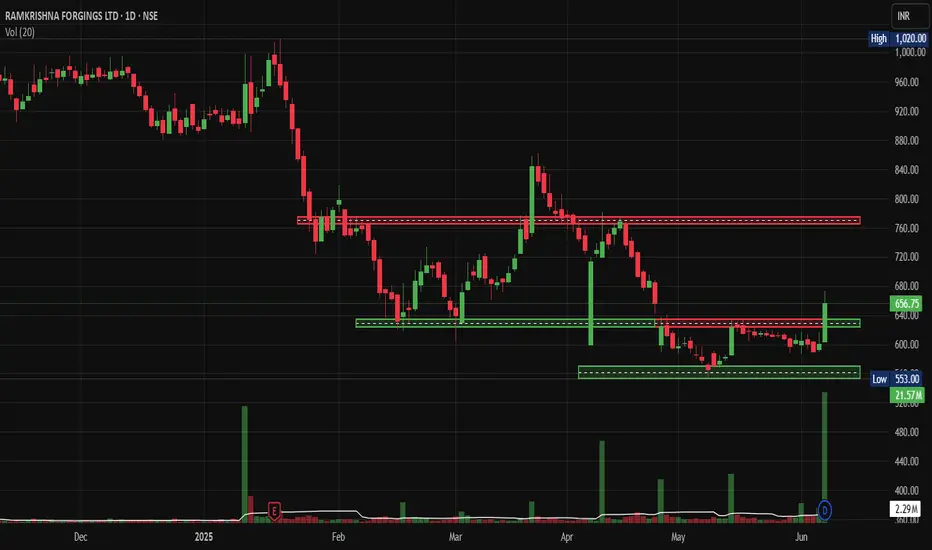
RKF Massive Breakout After 6-Month Consolidation.NSE:RKFORGE Hidden Auto Component Gem Ready for Massive Breakout After 6-Month Consolidation, after Breaking out Today With King Candle and Volumes.
Price Action:
- Current Price: ₹656.75 (+9.37% gain)
- Trading Range: ₹553.00 - ₹1,020.00
- Market Cap Category: Mid-cap stock with decent liquidity
- Chart Pattern: Extended consolidation phase with recent breakout attempt
Support and Resistance Levels
- Primary Resistance: ₹760-780 zone (red horizontal line)
- Secondary Resistance: ₹1,020 (previous high)
- Immediate Support: ₹620-640 zone
- Major Support: ₹553-580 zone (green horizontal rectangle)
- Critical Support: ₹553 (52-week low)
Base Formation:
- Base Type: Rectangle/Sideways consolidation base
- Duration: Approximately 6 months (January 2025 to June 2025)
- Base Depth: ~45% correction from highs
- Base Quality: Tight consolidation with reduced volatility
- Breakout Characteristics: Recent volume spike suggests potential base completion
Technical Patterns:
- Rectangle Pattern: Clear horizontal support and resistance boundaries
- Volume Accumulation: Declining volume during consolidation, spike on recent move
- Flag Formation: Potential bull flag pattern forming at current levels
- Double Bottom: Possible formation around ₹553-580 support zone
Volume Spread Analysis
- Volume Characteristics: 21.57M shares traded (above average)
- Volume Pattern: Higher volume on up days, lower on down days
- *Accumulation Signs: Volume spike coinciding with price breakout attempt
- Volume Confirmation: Recent breakout supported by increased participation
Trade Setup:
Entry Strategy:
- Primary Entry: ₹650-665 (current levels on pullback)
- Aggressive Entry: ₹680-690 (on breakout above resistance)
- Conservative Entry: ₹620-630 (on retest of support)
Exit Levels:
- Target 1: ₹750-760 (15% upside)
- Target 2: ₹850-880 (30% upside)
- Target 3: ₹980-1,000 (50% upside)
Stop Loss Levels:
- Tight Stop: ₹620 (5% risk)
- Swing Stop: ₹580 (12% risk)
- Position Stop: ₹550 (16% risk)
Position Sizing:
- Conservative Allocation: 2-3% of portfolio
- Moderate Allocation: 4-5% of portfolio
- Aggressive Allocation: 6-8% of portfolio (for risk-tolerant investors)
Risk Management:
- Risk-Reward Ratio: Minimum 1:2 for all entries
- Portfolio Risk: Maximum 2% portfolio risk per position
- Position Monitoring: Weekly review of technical levels
- Profit Booking: 25% at Target 1, 50% at Target 2, remainder at Target 3
Sectoral Backdrop:
Auto Components Sector Overview
- Sector Performance: Recovery phase post-COVID disruptions
- Growth Drivers: EV transition, export opportunities, aftermarket demand
- Challenges: Raw material inflation, supply chain disruptions
- Government Support: PLI schemes, Make in India initiatives
Forging Industry Dynamics
- Market Position: Specialised manufacturing with high entry barriers
- Demand Drivers: Commercial vehicle recovery, export growth
- Competitive Advantage: Technical expertise, established client relationships
- Cyclical Nature: Linked to auto industry cycles and capex spending
Fundamental Backdrop
Company Overview
- Business Model: Automotive forging components manufacturer
- Key Clients: Major OEMs in domestic and international markets
- Product Portfolio: Crankshafts, connecting rods, front axle beams
- Manufacturing Facilities: Multiple locations with modern equipment
Financial Health Indicators
- Revenue Growth: Recovery trajectory expected post-consolidation
- Margin Profile: Improving operational efficiency
- Debt Levels: Manageable debt-to-equity ratios
- Cash Flow: Positive operating cash flow generation
Growth Catalysts
- Export Expansion: Increasing share in global supply chains
- Product Diversification: Entry into new automotive segments
- Technology Upgrades: Investment in advanced manufacturing
- Market Recovery: Commercial vehicle segment revival
Risk Factors
- Cyclical Demand: Vulnerability to auto industry downturns
- Raw Material Costs: Steel price volatility impact
- Competition: Pressure from low-cost manufacturers
- Regulatory Changes: Environmental and safety compliance costs
My Take:
NSE:RKFORGE presents a compelling technical setup after a prolonged consolidation phase. The stock appears to be breaking out from a well-defined base with strong volume support. The risk-reward profile is attractive for medium-term investors, with clear support and resistance levels providing good trade management opportunities. However, investors should remain mindful of the cyclical nature of the auto components sector and size positions accordingly.
Keep in the Watchlist.
NO RECO. For Buy/Sell.
📌Thank you for exploring my idea! I hope you found it valuable.
🙏FOLLOW for more
👍BOOST if you found it useful.
✍️COMMENT below with your views.
Meanwhile, check out my other stock ideas on the right side until this trade is activated. I would love your feedback.
Disclaimer: "I am not a SEBI REGISTERED RESEARCH ANALYST AND INVESTMENT ADVISER."
This analysis is intended solely for informational and educational purposes and should not be interpreted as financial advice. It is advisable to consult a qualified financial advisor or conduct thorough research before making investment decisions.
Honasa Consumer - Breakout Brewing After 6-Month Base Formation NSE:HONASA : Breakout Brewing After 6-Month Base Formation - Is This the Perfect Entry Point?
After Q4 FY25 Results, Jefferies Adjusts Price Target to ₹400 From ₹320, Keeps at Buy. They target double-digit revenue growth on retail push, also eyeing Mamaearth revival, thus qualify for my Chart of the Week idea.
Base Formation & Pattern Recognition:
NSE:HONASA has carved out a compelling 6-month consolidation base between November 2024 and May 2025, with the stock oscillating between ₹197-280 range. This extended sideways movement represents a classic accumulation phase, where smart money has likely been building positions while retail investors remained on the sidelines.
The most recent price action shows a powerful breakout above the ₹280 resistance level, accompanied by explosive volume expansion - a textbook technical setup that often precedes sustained upward moves.
Key Technical Levels:
Key Support Levels:
- Primary Support: ₹280 (former resistance, now support)
- Secondary Support: ₹240-250 (mid-range consolidation zone)
- Major Support: ₹197 (base low and critical floor)
Key Resistance Levels:
- Immediate Resistance: ₹350-360 (psychological round number)
- Next Target: ₹400 (measured move from base breakout)
- Long-term Target: ₹472 (0.786 Fibonacci extension visible on chart)
Volume Analysis:
The standout feature is the dramatic volume surge accompanying today's breakout - nearly 5x the average weekly volume at 26.41M shares. This volume expansion validates the breakout and suggests institutional participation rather than retail-driven momentum.
The volume pattern during the 6-month base shows periodic spikes at key support levels, indicating accumulation by informed participants during weakness.
Technical Pattern:
The chart displays a Rectangle/Trading Range pattern that has resolved to the upside. The measured move target from this pattern projects to approximately ₹400, representing the height of the rectangle (₹280-₹197 = ₹83) added to the breakout point.
Trade Setup:
Setup Type: Breakout Play with Volume Confirmation
Entry Strategy:
- Aggressive Entry: ₹325-330 (current levels on any minor pullback)
- Conservative Entry: ₹285-290 (on retest of breakout level)
Position Sizing: Use 1-2% portfolio risk given the setup quality
Exit Strategy:
- Target 1: ₹360 (9-10% upside) - Book 30% position
- Target 2: ₹400 (20% + upside) - Book another 40% position
- Target 3: ₹450-470 (35-40% upside) - Ride remaining position
Stop Loss:
- Tight Stop: ₹310 (6% downside protection)
- Wider Stop: ₹275 (below breakout level for swing traders)
Risk Assessment:
Bullish Factors:
- Clean 6-month base formation
- Volume-confirmed breakout
- Multiple support levels established
- Strong sector tailwinds in the consumer space
Risk Factors:
- Broader market volatility could impact momentum
- Profit-booking likely near psychological levels
- Need to hold above ₹280 to maintain bullish structure
Bottom Line:
Honasa Consumer presents a high-probability technical setup with the stock breaking out of a well-defined 6-month accumulation base on strong volume. The risk-reward profile favours the bulls, with clearly defined support levels for stop placement and multiple upside targets for profit-taking.
The key now is whether the stock can sustain above the ₹280 breakout level and continue its march toward the ₹350-400 zone. Any pullback to the ₹285-290 area would offer an attractive secondary entry point for those who missed the initial breakout.
Keep in the Watchlist.
NO RECO. For Buy/Sell.
📌Thank you for exploring my idea! I hope you found it valuable.
🙏FOLLOW for more
👍BOOST if you found it useful.
✍️COMMENT below with your views.
Meanwhile, check out my other stock ideas on the right side until this trade is activated. I would love your feedback.
Disclaimer: "I am not SEBI REGISTERED RESEARCH ANALYST AND INVESTMENT ADVISER."
This analysis is intended solely for informational and educational purposes and should not be interpreted as financial advice. It is advisable to consult a qualified financial advisor or conduct thorough research before making investment decisions.
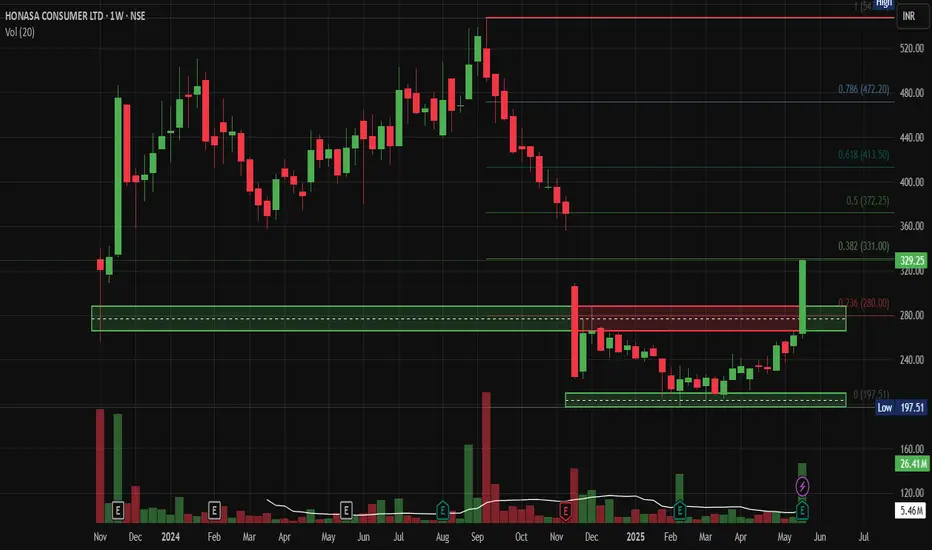
Thomas Cook - Early Trend Reversal SignalsNSE:THOMASCOOK Made Beautiful Chart Structure today Before Q4 Results with Good Price and Volume action.
Price Action and Base Formation Analysis:
Consolidation Base:
The stock has formed a critical consolidation base in the ₹130-140 zone:
1. Base Characteristics:
- Horizontal support zone marked in green
- Multiple tests of this zone (4-5 clear touch points)
- Tight price compression indicates potential energy buildup
2. Breakout Dynamics:
- Today's 13.91% surge represents a decisive breakout from the consolidation zone
- Penetration above ₹140 with strong momentum suggests a potential trend change
- The red arrow indicates the resistance level that might be overcome.
Volume Analysis:
Volume provides crucial insights into the price action:
- Today's volume at 2.46M shares is more than 2x the 20-day average
- Significant volume spikes are visible in February and March
- Recent volume pattern shows increasing participation
- Volume expansion coincides with today's breakout, confirming buying interest
Support and Resistance Levels:
Key Resistance Levels:
1. Immediate Resistance: ₹148-150 (recent swing high)
2. Major Resistance: ₹160-165 (previous structural resistance)
3. Psychological Resistance: ₹150 (round number)
Key Support Levels:
1. New Support: ₹130-140 (previous consolidation zone)
2. Secondary Support: ₹125 (lower boundary of recent base)
3. Strong Support: ₹118-120 (52-week low area)
Technical Pattern:
Several important patterns are evident:
1. Accumulation Base: The ₹130-140 zone represents a classic accumulation pattern
- Tight trading range
- Multiple support tests
- Decreasing volatility
2. Trend Reversal Signals:
- Higher lows forming since February
- Decreasing downward momentum
- Breakout with strong volume
My Take:
The combination of:
- Decisive breakout from a multi-month base
- Substantial volume confirmation
- Clear momentum shift
Suggests NSE:THOMASCOOK could be transitioning to a bullish trend Post Q4.
Price Projection:
1. Near-term Target: ₹160-165
2. Intermediate Target: ₹180-190
3. Long-term Potential: Retest of previous highs near ₹200
Critical Watch Points:
- Ability to sustain above ₹140
- Volume confirmation in subsequent sessions
- Holding the breakout without immediate retracement
Keep in the Watchlist.
NO RECO. For Buy/Sell.
📌Thank you for exploring my idea! I hope you found it valuable.
🙏FLLOW for more
👍BOOST if useful
✍️COMMENT below with your views.
Meanwhile, check out my other stock ideas on the right side until this trade is activated. I would love your feedback.
Disclaimer: "I am not SEBI REGISTERED RESEARCH ANALYST AND INVESTMENT ADVISER."
This analysis is intended solely for informational and educational purposes and should not be interpreted as financial advice. It is advisable to consult a qualified financial advisor or conduct thorough research before making investment decisions.

Knowledge Marine & Engineering WorksThe long-term financing plan for the maritime industry was presented by Union Finance Minister Nirmala Sitharaman on February 1, 2025.
As informed, the Government of India will contribute up to 49 percent to the fund, with the private sector, port authorities, financial institutions and other government entities covering the remainder of the sum. The financial assistance will be provided via equity or debt securities, according to the government.
Objectives of the new fund are:
Development of new and modernization of existing ports;
Financial aid for green shipping initiatives;
Investments in ship repair facilities to make India a global shipping hub;
Encouragement of technological innovation in maritime logistics & fleet efficiency.
As per the government, the MDF is primarily intended for financing ship acquisitions, in line with the country’s strategy to increase the share of Indian-flagged vessels to 20% by 2047.
What is more, the enriched domestic fleet would reduce dependency on foreign ships and improve the balance of payments, contributing to India’s strategic interests.
The Union Budget also provided a ‘shot in the arm’ to India’s domestic shipbuilding industry after it announced new mega shipbuilding clusters in the country in an effort to increase the range, categories, and capacity of ships. The proposed allocation of ₹6,100 crore ($700 million) aims to support India’s existing shipyards in upgrading, modernizing, and automating their operations, enhancing efficiency, utilization, and overall output.
Furthermore, the Union Budget has extended the Shipbuilding Financial Assistance Policy (SBFAP) 2.0, aimed at providing direct financial subsidies to Indian shipyards. This initiative seeks to help in securing orders by offsetting operational cost disadvantages, thereby strengthening the domestic shipbuilding industry.
“It is reassuring to see that the budgetary initiatives for India’s marine sector are focused on unlocking its vast potential and enhancing existing assets through upgrades, modernisation, and automation. A key highlight is our ministry’s development of new shipbuilding clusters of 1.0 to 1.2 Million Gross Tonnage (GT) each,” Sarbananda Sonowal, The Union Minister of Ports, Shipping & Waterways, commented.
“This strategic push is crucial in realising India’s vision of becoming a $30 trillion economy by 2047. By leveraging the Public-Private Partnership (PPP) model, the scheme is designed to attract private investment, promote modernisation, and advance green technologies. These efforts will enhance India’s global competitiveness, drive sustainable growth, and solidify its position as a leading Global Maritime Hub.”
Another innovative scheme announced in the budget is the shipbreaking credit note to promote the circular economy. This scheme incentivizes ship scrapping by issuing a credit note of 40% of the scrap value which can be reimbursed to buy new ‘Made in India’ ships.
Finally, large ships will be now accounted as infrastructure assets, enabling easy access to long-term financing and tax incentives. This will help attract private investments in the maritime sector and enhance fleet modernization, according to the government.
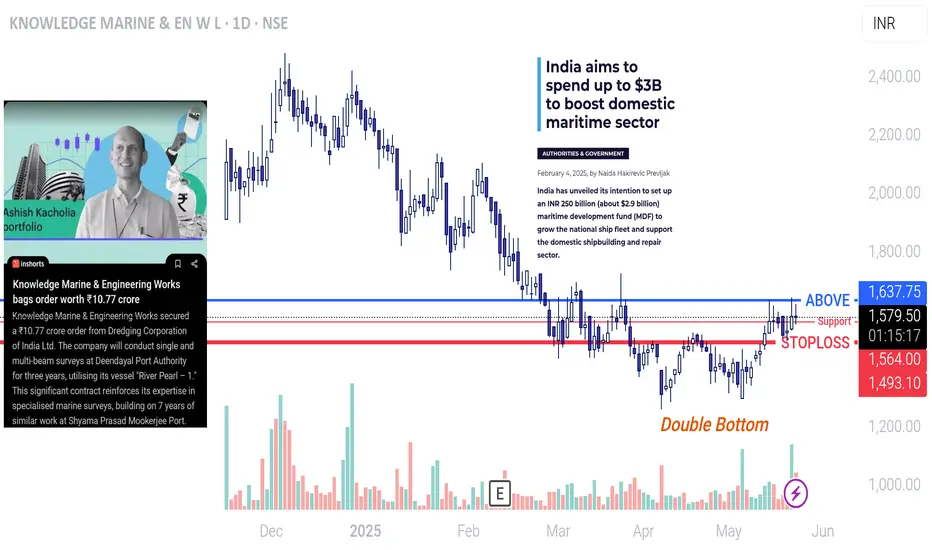
Indian Bank - Crossing Swing High'sNSE:INDIANB is Crossing Swing Highs on Weekly Time Frame and Daily Time Frame with RSI and MACD Trending Upwards, it has seen consistent accumulation around 489-495 Levels.
With the RBI rate cut and 1.16 times Book Value, it's Looking Good for a Swing Trade
About:
NSE:INDIANB is a medium-sized bank that was started in 1907. It offers deposits, loans and services. The Bank's segments include Treasury, Corporate/Wholesale Banking, Retail Banking and Other Banking Operations.
Trade Setup:
Add Few and Buy on Dips if it holds this week's low
Target(Take Profit):
Ideally up to your Swing Apetite Levels and ATH Levels, of course.
Stop Loss:
If aiming for ATH, Current Week's Low, if aiming for More, keep 489-495 Levels in Mind.
📌Thank you for exploring my idea! I hope you found it valuable.
🙏FLLOW for more
👍BOOST if useful
✍️COMMENT below with your views.
Meanwhile, check out my other stock ideas on the right side until this trade is activated. I would love your feedback.
Disclaimer: "I am not SEBI REGISTERED RESEARCH ANALYST AND INVESTMENT ADVISER."
This analysis is intended solely for informational and educational purposes and should not be interpreted as financial advice. It is advisable to consult a qualified financial advisor or conduct thorough research before making investment decisions.

HDFC Bank - Swing Trade NSE:HDFCBANK is looking Super Strong on the Daily time frame after forming a perfect base today it broke out and closed significant levels with MACD and RSI Trending Upwards it Can retest its ATH Levels soon.
About:
NSE:HDFCBANK is an Indian banking and financial services company headquartered in Mumbai. It is India's largest private sector bank by assets and the world's tenth-largest bank by market capitalization as of May 2024.
As of April 2024, NSE:HDFCBANK has a market capitalization of $145 billion, making it the third-largest company on the Indian stock exchanges. It is India's one of 3 systemically important banks with a 15% market share in the banking sector’s advances and a 37% market share in the private sector banks’ advances as of FY24.
F&O Activity:
Short's Getting Covered in Futures with decreasing OI with 1740 CE OI covering Significantly.
Trade Setup:
Buy on Dips if Possible Near Base Levels or Start with a Few Qty to see the momentum if continues further Sharply or Consolidates.
Target(Take Profit):
Ideally around ATH Levels near 1860 to 1880 Levels
Stop Loss:
Entry Candle Low for Swing Traders and Swing Low Base Formed as Mentioned for Positional and Buy on Dips Traders.
📌Thank you for exploring my idea! I hope you found it valuable.
🙏FLLOW for more
👍BOOST if useful
✍️COMMENT Below your views.
Meanwhile, check out my other stock ideas on the right side until this trade is activated. I would love your feedback.
Disclaimer: "I am not SEBI REGISTERED RESEARCH ANALYST AND INVESTMENT ADVISER."
This analysis is intended solely for informational and educational purposes only and should not be interpreted as financial advice. It is advisable to consult a qualified financial advisor or conduct thorough research before making investment decisions.

IEX Bullish Base Formed NSE:IEX today gave a good up move, confirming the recent base as a strong bullish base, recently it posted its monthly volumes in Jan up 16% YoY.
About:
NSE:IEX provides an automated platform and infrastructure for trading electricity units for the physical delivery of electricity.
F&O Activity:
Long Buildup in Futures with 180 PE Gaining Significant OI.
Trade Setup:
Looks like a good 1:1 trade setup with the recent base as a strong support zone, RSI and MACD trending upwards.
Target(Take Profit):
Around 206 Levels for Swing & Positional Trader.
Stop Loss:
Entry Candle Low for Swing Trader and Recent Base for Positional Trader.
📌Thank you for exploring my idea! I hope you found it valuable.
🙏FLLOW for more
👍BOOST if useful
✍️COMMENT Below your views.
Meanwhile, check out my other stock ideas below until this trade is activated. I would love your feedback.
Disclaimer: "I am not SEBI REGISTERED RESEARCH ANALYST AND INVESTMENT ADVISER."
This analysis is intended solely for informational and educational purposes only and should not be interpreted as financial advice. It is advisable to consult a qualified financial advisor or conduct thorough research before making investment decisions.

MAZDOCK - Ready for the next moveThe stock has been a market favorite. Technically it has cooled down owing to the Wave analysis which every stock goes through. Overall the Stock is in Stage 2. The stock is now gearing up to give Range Breakout.
On the Fundamental side:
- Strong Long Term Fundamental Strength with an average Return on Equity (ROE) of 24.14%
- Healthy long term growth as Net Sales has grown by an annual rate of 24.97% and Operating profit at 94.40%
- Company has a low Debt to Equity ratio (avg) at 0 times
- The company has declared Positive results for the last 8 consecutive quarters
- NET SALES(9M) At Rs 8,217.50 cr has Grown at 35.18 %
- ROCE(HY) Highest at 44.63 %
- INVENTORY TURNOVER RATIO(HY) Highest at 2.19 times
- Increasing Participation by Institutional Investors. Institutional investors have increased their stake by 0.56% over the previous quarter and collectively hold 3.02% of the company.

Redington Bounced from a Long Term Base With MACD +veNSE:REDINGTON today confirmed a Strong Base Formation after closing above major Levels RSI Showing Bullish Momentum and MACD turned Positive Today With Good Volumes.
Trade Setup:
It can be a Good 1:1 RISK-REWARD Trade. With the recent base being crucial levels.
Target(Take Profit):
234.25 Levels for Positional Trader.
Stop-Loss:
Around 198.58 For Swing Trade and Recent Base for Positional Trader.
📌Thank you for exploring my idea! I hope you found it valuable.
🙏FLLOW for more
👍BOOST if useful
✍️COMMENT Below your views.
Meanwhile, check out my other stock ideas below until this trade is activated. I would love your feedback.
Disclaimer: This analysis is intended solely for informational and educational purposes and should not be interpreted as financial advice. It is advisable to consult a qualified financial advisor or conduct thorough research before making investment decisions.

Newgen in Blue Sky.NSE:NEWGEN showed a strong upmove today Crossed Key Levels and Hit an all-time high, with RSI bouncing back Sharply again.
Trade Setup:
It can be a Good 1:1 RISK-REWARD Trade for Aggressive Swing Trader.
For Postional Trade let it cool down a bit and then try to enter at swing low.
Target(Take Profit):
1977 will be Levels for Swing/Positional Trader.
Stop-Loss:
Around 1534.15 For Swing Trade and Positional Trader.
📌Thank you for exploring my idea! I hope you found it valuable.
🙏FLLOW for more
👍BOOST if useful
✍️COMMENT Below your views.
Meanwhile, check out my other stock ideas below until this trade is activated. I would love your feedback.
Disclaimer: This analysis is intended solely for informational and educational purposes and should not be interpreted as financial advice. It is advisable to consult a qualified financial advisor or conduct thorough research before making investment decisions.

Minda Corp Breaking Major Levels after Bouncing from 200 DEMANSE:MINDACORP today broke major Levels with good Volumes and Made a Good Base near the demand zone near 200 DEMA, and RSI showing Bullishness.
Trade Setup:
It can be a Good 1:1 RISK-REWARD Trade. With the recent base being crucial levels.
Target(Take Profit):
631.50 Levels for Positional Trader.
Stop-Loss:
Around 504.95 For Swing Trade and Recent Base for Positional Trader.
📌Thank you for exploring my idea! I hope you found it valuable.
🙏FLLOW for more
👍BOOST if useful
✍️COMMENT Below your views.
Meanwhile, check out my other stock ideas below until this trade is activated. I would love your feedback.
Disclaimer: This analysis is intended solely for informational and educational purposes and should not be interpreted as financial advice. It is advisable to consult a qualified financial advisor or conduct thorough research before making investment decisions.

SBI LIFE Looking Good Made A Good BaseNSE:SBILIFE is looking good. It has made a base around 1395-1338; today, it broke above major Levels.
The RSI and MACD are Showing Strength.
Results are Due in a few Days Watch Closely.
F&O Activity:
Short Covering Seen Today With PCR of 0.70 and 1400 PE as Strong Option Base.
Trade Setup:
It can be a Good 1:1 RISK-REWARD Trade. With the recent base being crucial levels.
Target(Take Profit):
Around 200 DEMA For Swing Trade or 1660 Levels for Positional.
Stop-Loss:
Around 20 DEMA For Swing Trade Recent Base for Positional Trade.
📌Thank you for exploring my idea! I hope you found it valuable.
🙏FLLOW for more
👍BOOST if useful
✍️COMMENT Below your views.
Meanwhile, check out my other stock ideas below until this trade is activated. I would love your feedback.
Disclaimer: This analysis is intended solely for informational and educational purposes and should not be interpreted as financial advice. It is advisable to consult a qualified financial advisor or conduct thorough research before making investment decisions.

Medplus-A beautiful W in the making!Medplus has been in a downtrend since couple of years.
Stock is showing strong reversal after a base formation.
Stock has potential to test ATH and also make new highs.
Keep in watchlist. Not a recommendation.

SBICARD - WILL IT RETEST ITS BREAKOUT OR NOT ?SBI Cards And Payment Services Ltd. an interesting chart with Harmonic Pattern under progress
1. Narrowing Bollinger Bands on Weekly chart and price started moving on upper band last week
2. Break out from base formation after 8-9 month's consolidation within 680 - 750 levels.
3. Daily and Weekly RSI above 60
4. Next minor resistance between 830-870 zones
A chart to keen on radar and to watch
Will it RETEST its breakout levels or
Will it complete its pattern journey without any RETEST
Lets see How it evolves.
Disclaimer: NOT A BUY / SELL RECOMMENDATION I am not an expert I just share interesting charts here for educational purpose and not to be taken as buy/sell recommendation. Please seek expert opinion before investing and trading as trading/ investing in market is subject to market risks. I do not hold any position in the stock as on date but I may look to buy on dips with my own Risk Reward matrix.

Mukand Ltd (Weekly Chart) : Breakout Candidate#BreakoutCandidate #breakoutsoon #mukandltd #stocksinfocus #stocktotrade #stocktobuy
#Mukandltd : Weekly Chart
>> VCP formation on the Verge of Breakout
>> Good Trending setup on Weekly TF
>> Consolidation Range Breakout + Base Formation + Ready for Another Breakout
>> Good Strength in Stock & Good Volume Buildup
Swing Traders can lock 10% profit & keep trailing
Please Like or comment if u r Liking the analysis & Learning from it. Keep showing ur Love
Disclaimer : This is not a Trade Recommendations & Charts/ stocks Mentioned are for Learning/Educational Purpose. Do your Own Analysis before Taking positions.
Disc : Charts/Stocks Mentioned r 4 Learning Purpose & not 4 Trade
