ETHUSD · 15M · SMC NarrativePrice has rallied cleanly into a premium HTF supply zone, tapping into a pool of resting buy-side liquidity above prior highs.
HTF Context
Previous range high clearly defined and respected.
Liquidity engineered above equal highs.
Current price trading in premium, far from value.
LTF Structure
Strong impulsive move up, low-quality pullbacks.
Final leg shows momentum expansion, typical of a liquidity run.
High probability this move is exit liquidity, not continuation.
Expectation
Brief push or reaction at highs to fully sweep buy-side.
Sharp bearish displacement post sweep.
Price to rotate lower toward:
Internal range low
Prior demand imbalance
HTF discount zone below
Execution Plan
No longs at these levels.
Patience for:
Liquidity sweep above highs
Bearish displacement
LTF MSS confirmation
Shorts favored after confirmation.
Scale partials at internal lows, runners into deep discount.
Bat

XAUUSD (Gold Spot) Technical Outlook - 17/12/2025XAU/USD – Technical Update
Gold trades near $4,332 and remains in a strong bullish trend across all timeframes, supported by price holding well above key moving averages. Momentum is strong, though short-term indicators are overbought, hinting at minor pullbacks.
Key Levels:
Support: 4300–4305 | 4290 | 4270
Resistance: 4335 | 4367 | 4400
Intraday Strategy:
Buy dips: 4300–4310
Targets: 4335 → 4365
SL: Below 4270
Fundamentals:
US macro data & Fed expectations keep gold supported amid cautious risk sentiment.
Bias: 📈 Bullish trend | Buy on dips
Disclaimer:
For educational purposes only. This is not financial advice. Trading in Forex, Gold, Crypto, and markets involves high risk. Do your own research and trade at your own risk.

XAUUSD – 15M | SMC-Based Trade PlanGold is currently in a corrective phase after a strong impulsive move to the upside. Price has delivered a clear displacement, followed by a pullback into a refined demand zone, highlighted on the chart. This area aligns with prior bullish order flow and acts as a discount zone within the higher-timeframe range.
The current sell-off appears corrective, not impulsive. Expectation is for price to mitigate demand, sweep weak lows if needed, and then resume the primary bullish structure.
Execution Plan (Important):
➡ No blind entries.
➡ Entry will be taken only if LTF confirms bullish intent (CHoCH, BOS, displacement from demand).

GBP/USD – Short Setup Trade Narrative
Price created a lower-high structure after the earlier push up, followed by a sharp sell-off that broke intraday momentum.
A small liquidity grab beneath the prior low caused a corrective pullback into a premium zone, aligning perfectly with the bearish bias.
The current candle shows rejection inside the supply block / retracement zone, giving a clean short entry.
Confluence
Structural lower-high formation
Liquidity sweep before entry
FVG fill during retracement
Higher-timeframe bearish context
Clear risk-to-reward framework

Zydus lifescienceIn weekly time frame forming Half bat pattern NSE:ZYDUSLIFE
only educational purpose
information provided is for informational purposes only and should not be construed as investment advice or an offer to buy or sell securities. Investors are advised to carefully review all materials and consult with a financial advisor considering their own financial situation and risk tolerance before making investment decisions. The disclaimer also often includes statements about no guarantees or warranties regarding the accuracy, adequacy, or completeness of the information provided and emphasizes that investments can fluctuate in value and there is a risk of loss

Retail Investors and Algorithm AdvantagesIntroduction
In the modern financial ecosystem, retail investors—the individual investors who buy and sell securities for their personal accounts—are increasingly sharing the stage with institutional investors powered by sophisticated algorithms. The rise of algorithmic trading, machine learning, and data-driven investment strategies has created a paradigm shift in markets worldwide. For retail investors, this duality represents both opportunities and challenges: they have access to tools that were once exclusively the domain of professional traders, yet they also face markets increasingly influenced by speed, precision, and automation. Understanding the interplay between retail investment behavior and algorithmic advantages is critical to navigating contemporary financial markets.
Who Are Retail Investors?
Retail investors are non-professional market participants who invest their personal funds in stocks, bonds, mutual funds, ETFs, cryptocurrencies, and other financial instruments. Unlike institutional investors—such as hedge funds, pension funds, and mutual funds—which handle large sums and deploy complex trading strategies, retail investors typically operate with smaller capital and limited resources. Traditionally, retail investors relied heavily on brokers, financial advisors, and news media to make investment decisions.
Characteristics of Retail Investors
Limited Capital: Retail investors often trade in smaller volumes, which reduces their market influence but increases their susceptibility to volatility.
Behavioral Biases: Emotional decision-making, overconfidence, and herd behavior can influence retail trades, leading to inconsistent results.
Access to Technology: Recent advances in digital platforms have democratized access to market data, analysis tools, and even algorithmic trading software.
Long-term vs. Short-term Goals: Retail investors may pursue retirement savings, wealth creation, or speculative gains, unlike institutional investors focused on large-scale portfolio optimization.
Algorithmic Trading: An Overview
Algorithmic trading, or algo-trading, involves the use of computer programs to execute trades automatically based on predefined criteria. These algorithms can analyze vast amounts of data, identify patterns, and execute orders at speeds impossible for humans. Algorithmic trading can be broken down into several categories:
High-Frequency Trading (HFT): Executing thousands of trades per second to exploit small price discrepancies.
Statistical Arbitrage: Leveraging mathematical models to identify mispriced securities and market inefficiencies.
Trend Following Algorithms: Using historical price trends to predict future movements.
Machine Learning Algorithms: Learning from historical market data to adapt to new patterns over time.
Advantages of Algorithms for Retail Investors
Algorithmic trading is no longer confined to institutional investors. The democratization of technology has enabled retail investors to harness algorithmic advantages. Here are key benefits:
1. Speed and Efficiency
Algorithms can execute trades within milliseconds, far faster than human capabilities. For retail investors, speed is crucial in volatile markets where prices can change in seconds. Many trading platforms now provide retail traders access to execution algorithms that reduce latency, prevent slippage, and optimize order timing.
2. Emotion-Free Trading
Retail investors often succumb to fear, greed, and panic—buying during market peaks and selling during troughs. Algorithms operate purely on logic, removing emotional biases. By following a disciplined set of rules, retail investors can maintain consistency, minimize impulsive trading, and adhere to predefined risk-management strategies.
3. Backtesting and Strategy Optimization
Algorithms allow retail investors to test trading strategies against historical data before committing real capital. Backtesting provides insights into potential profitability, risk exposure, and drawdowns, enabling retail investors to refine strategies systematically rather than relying on guesswork.
4. Diversification and Portfolio Management
Algorithmic tools allow retail investors to manage multiple assets simultaneously. Automated portfolio rebalancing, risk assessment, and optimization can be achieved without manually tracking every position. This scalability enhances the efficiency of retail investment management.
5. Access to Complex Strategies
Before technological advancements, complex strategies such as options hedging, pair trading, or momentum-based trading were mostly inaccessible to retail investors due to computational or informational constraints. Algorithmic trading platforms now enable retail investors to implement sophisticated strategies with minimal manual intervention.
6. Reduced Transaction Costs
Many algorithms are designed to minimize transaction costs through optimal order execution, splitting orders to reduce market impact, and using predictive models to anticipate liquidity. For retail investors, these cost-saving advantages can significantly improve net returns over time.
Challenges and Risks for Retail Investors Using Algorithms
Despite the advantages, retail investors face unique challenges when using algorithms:
Over-Reliance on Technology: Blindly trusting algorithms without understanding underlying mechanics can be risky. A poorly designed algorithm can amplify losses.
Market Competition: Algorithms deployed by institutional investors often have access to superior data, faster execution speeds, and advanced infrastructure, putting retail traders at a relative disadvantage.
Data Limitations: Accurate algorithmic trading requires high-quality data. Retail investors may lack access to premium market data, potentially reducing algorithm effectiveness.
System Failures: Glitches, server downtime, or software errors can lead to unintended trades or significant losses.
Regulatory Risks: Automated trading is subject to market regulations to prevent manipulation and excessive volatility. Retail investors must ensure compliance with evolving rules.
How Retail Investors Leverage Algorithmic Advantages
Retail investors adopt algorithmic advantages through several approaches:
1. Algorithmic Trading Platforms
Platforms like Interactive Brokers, MetaTrader, Zerodha Streak, and Tradestation allow retail investors to design, test, and execute trading strategies automatically. These platforms offer user-friendly interfaces, reducing the need for deep programming expertise.
2. Copy Trading and Social Algorithms
Some platforms enable retail investors to copy trades from successful algorithmic traders or “quants.” This approach provides indirect access to sophisticated strategies without the need for technical coding skills.
3. Robo-Advisors
Robo-advisors leverage algorithms to manage investment portfolios, adjusting asset allocation based on risk tolerance, market conditions, and long-term goals. For retail investors, robo-advisors offer low-cost, automated, and disciplined portfolio management.
4. Data-Driven Decision Making
Retail investors can use algorithms to process market news, social media sentiment, and economic indicators to make informed investment decisions. For example, sentiment analysis algorithms can detect market trends early, providing a competitive edge.
Case Studies and Real-World Examples
Retail Algorithm Adoption in Equities: During recent market volatility, retail investors using algorithmic trading platforms were able to automate buy-and-hold strategies, reducing panic-selling behavior and capturing rebound opportunities.
Cryptocurrency Markets: Retail investors actively use algorithms for crypto trading, executing arbitrage and trend-following strategies in highly volatile environments. Algorithms provide a crucial speed advantage, given the 24/7 nature of crypto markets.
Options Trading: Retail traders increasingly rely on automated options strategies, such as straddles, strangles, and spreads, executed with precise timing and risk controls.
Strategic Implications
The fusion of retail investing and algorithmic trading has long-term implications for market dynamics:
Increased Market Efficiency: Algorithms help reduce pricing inefficiencies, benefiting both retail and institutional investors.
Changing Investor Behavior: Automation reduces the influence of human emotions on markets, potentially leading to more rational trading patterns.
Leveling the Playing Field: Access to algorithmic tools empowers retail investors to compete more effectively against larger institutional players.
Innovation in Financial Products: The rise of retail algorithmic trading encourages financial institutions to create new investment products, platforms, and educational tools catering to tech-savvy individuals.
Conclusion
The convergence of retail investors and algorithmic trading represents a transformative shift in modern financial markets. Retail investors, once limited by capital, information, and execution speed, now have access to tools that enhance speed, reduce emotional biases, enable complex strategies, and optimize portfolio management. However, this advantage comes with challenges: technological reliability, competition from institutional players, data limitations, and regulatory compliance.
Ultimately, the successful retail investor in today’s environment is one who leverages algorithms not as a replacement for judgment, but as an augmentation of research, strategy, and disciplined trading. By integrating human insight with algorithmic precision, retail investors can navigate markets more effectively, reduce risks, and capitalize on opportunities that were previously beyond reach. The future of investing is increasingly hybrid—where the speed of machines meets the strategic thinking of individuals.

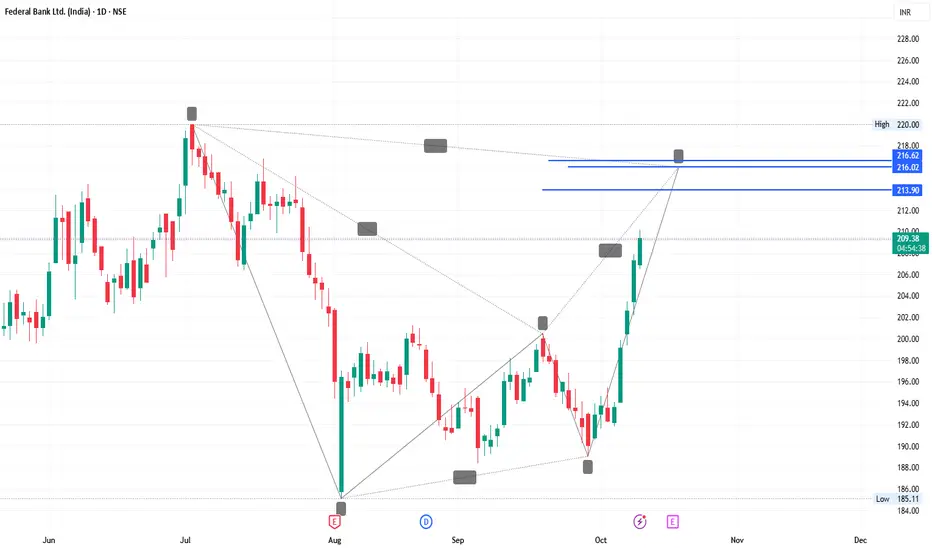
Federal Bank As per BAT Harmonic Pattern in Daily Time Frame.
Disclaimer
Information provided is for informational purposes only and should not be construed as investment advice or an offer to buy or sell securities. Investors are advised to carefully review all materials and consult with a financial advisor considering their own financial situation and risk tolerance before making investment decisions. The disclaimer also often includes statements about no guarantees or warranties regarding the accuracy, adequacy, or completeness of the information provided and emphasizes that investments can fluctuate in value and there is a risk of loss
Central Bank Shows Bullish Bat PatternThe central bank has formed a harmonic Bat pattern and recently experienced a 50% decline, presenting a potential buying opportunity. The current support level is at 33, with a target price around 70.
From a fundamental perspective, the central bank continues to maintain stable monetary policies, aiming to control inflation while supporting economic growth. Its strong regulatory framework and commitment to financial stability enhance its prospects. Additionally, ongoing reforms and interventions to improve liquidity indicate positive long-term potential for investors.

PUNJAB NATIONAL BANKHello & welcome to this analysis
In my previous post on the bank I had suggested the likelihood of it declining to 103 where it had double bullish harmonic patterns. (link to that post is given)
Now the bullish harmonic Bat & reciprocal ABCD patterns are indicating the probability of a rally till 106 & 109 as long as it sustains above 100.
Immediate resistance at 104 with strong support near 102.50
All the best

Linde India Ltd: Analyzing Investment Potential Amidst Recent DeTechnical Analysis: BAT Pattern and Support Levels
Linde India Ltd has formed a BAT pattern in its stock chart, experiencing a 40% decline from its recent highs. The stock is currently positioned with an entry point around ₹5930, while a significant support zone exists at approximately ₹5200, coinciding with a three-year long-term trendline.
Fundamental Performance Overview
Revenue Trends: Linde India reported a 12.16% decline in sales, marking its first revenue contraction in three years. This downturn reflects the challenges faced in the industrial gases sector amid fluctuating demand and pricing pressures.
Net Profit: The company's net profit for the last two quarters has shown a consistent decrease, with figures dropping from ₹120.07 crore to ₹105.41 crore, averaging a decline of 12.2% per quarter.
Price-to-Earnings (P/E) Ratio: The current P/E ratio is significantly high at 116.68, compared to the sector average of 118.28, suggesting that the stock may be overvalued based on its earnings.
Debt Levels: Linde India has maintained a zero debt status for the past five years, demonstrating strong financial health and stability without reliance on external borrowing.
Return on Equity (ROE): The company reported an ROE of 12.91%, indicating effective management of shareholder equity to generate profits.
Dividend Yield: Linde India offers a modest dividend yield of 0.20%, providing some returns to shareholders despite the current market volatility.
Market Capitalization: As of January 2025, Linde India's market cap stands at approximately ₹50,648 crore, reflecting its position as a significant player in the industrial gases sector.

Bharat Forge Ltd: Analyzing Investment Potential Technical Analysis: BAT Pattern and Support Levels
Bharat Forge Ltd has formed a BAT pattern in its stock chart and is currently trading with a 34% decline from its recent highs. The stock is finding significant support around the ₹1100 level, which may present a strategic entry point for long-term investors.
Fundamental Performance Overview
Revenue Trends: For the fiscal year 2023-2024, Bharat Forge reported a 10.54% decline in revenue, reflecting challenges in the automotive and industrial sectors due to fluctuating demand and supply chain disruptions.
Net Profit: The company experienced a net profit of approximately ₹1,200 crore, which indicates a decrease compared to previous periods, primarily due to increased operational costs and competitive pressures.
Price-to-Earnings (P/E) Ratio: The current P/E ratio stands at approximately 60.33, which is significantly higher than the sector average of 42.07, suggesting that the stock may be overvalued based on earnings potential.
Debt Levels: Bharat Forge maintains a debt-to-equity ratio of 1.05, indicating a moderate level of debt relative to equity, which could pose some risk but also allows for growth opportunities.
Return on Equity (ROE): The company reported an ROE of 13.26%, reflecting its ability to generate profits effectively from shareholders' equity, outperforming its five-year average.

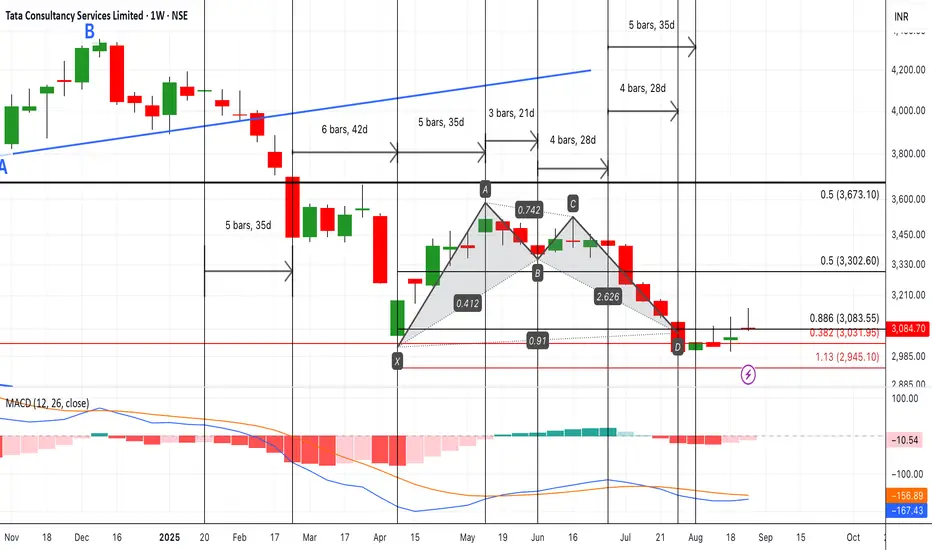
TCS LOOKING FOR TURNAROUND Keep #TCS on radar 🚀 Weekly MACD histogram shows bullish divergence + positive DMI. A bullish alt Bat harmonic also visible on weekly scale. Just a MACD positive cross needed to ignite momentum in next 1–2 months. expecting 3450
GOLDHello & welcome to this analysis
In 4hrs time frame GOLD (MCX) has activated a bearish Harmonic Bat pattern.
It could retrace down to 99500 - 98500, will consider 100750 as stop loss for this set up.
Do keep in mind, GOLD overall is very strong and this could likely be a shallow retracement.
Regards

Nifty Energy Index - Bearish BatNifty Energy Index - Bearish Bat formed Bearish Bat Harmonic Pattern. Sell range, Stop loss and target details are mentioned.
Note: This chart is only for educational purpose. Not suggesting any trade. Please do your own financial assessment before taking trade.
I am not a certified analyst.

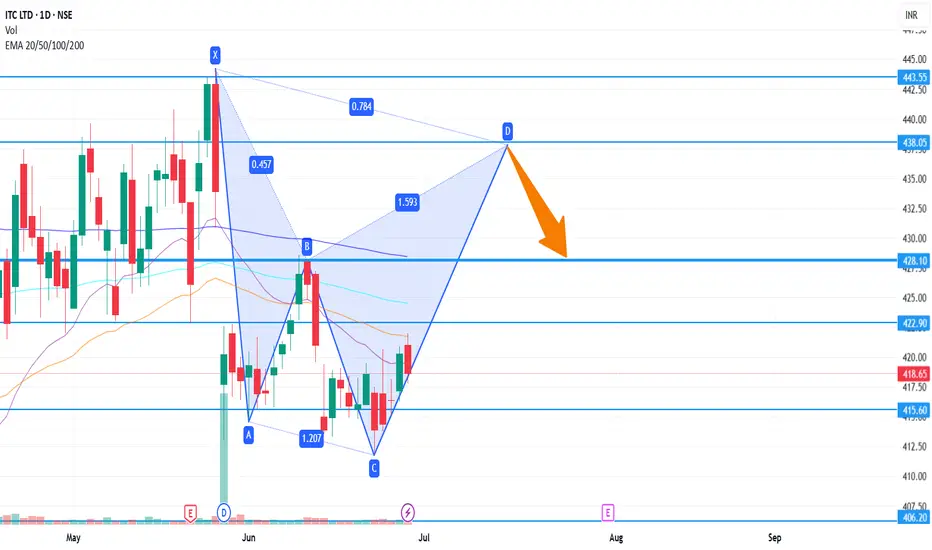
ITC Short Term 438ITC on daily chart is forming a bearish harmonic pattern.
If it follows the pattern formation then next targets at 428 and 438
Stop Loss is 413
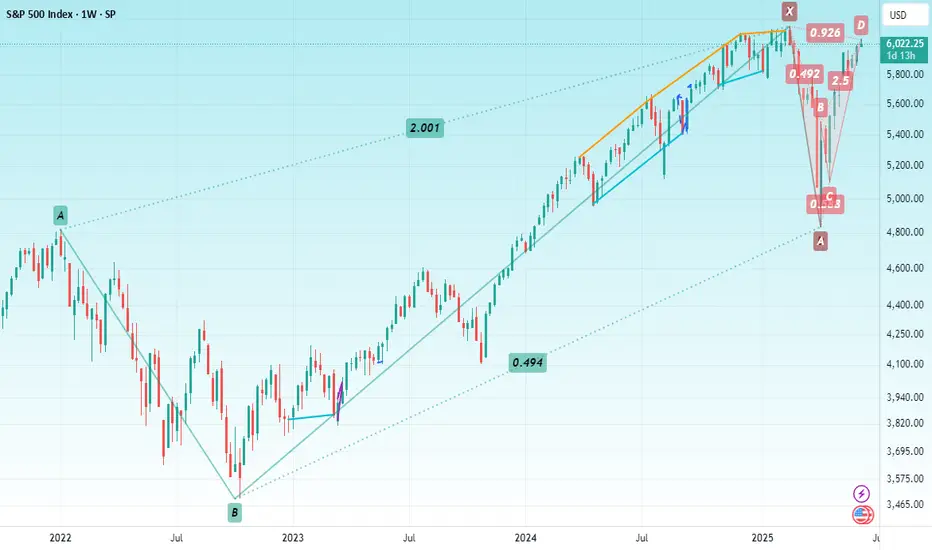
S&P 500Hello & welcome to this analysis
After making a monthly time frame Bullish Harmonic Reciprocal ABCD in April, the index has now formed a Bearish Harmonic Bat in daily time frame.
A pullback till 5800 - 5750 should not be ruled out as long as its below 6100
All the best
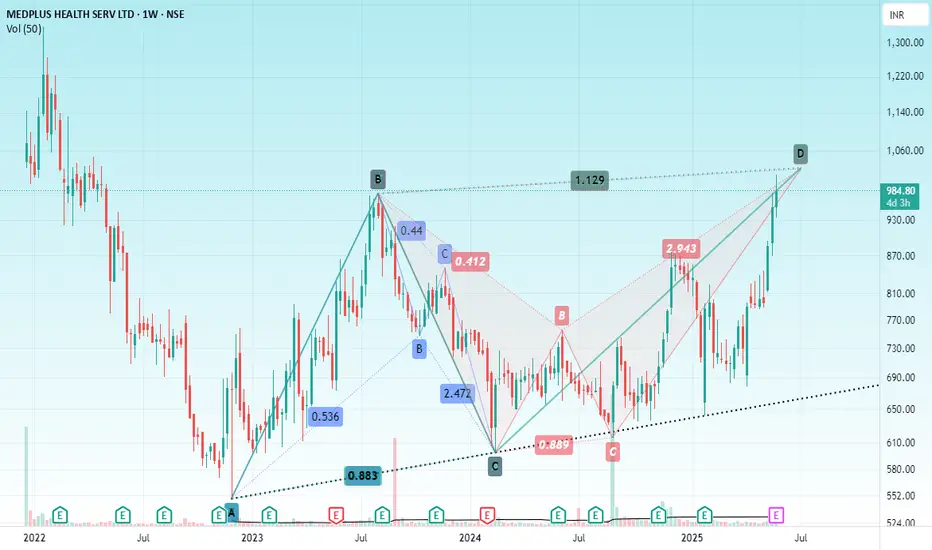
MEDPLUS HEALTHHello & welcome to this analysis
From a bullish Harmonic Bat pattern to a bearish Harmonic Alt Bat & bearish Harmonic ABCD in the weekly time frame.
Stock has entered in to potential reversal zone (PRZ) 1010-1050 of a bearish reversal probability.
Also note the 52w high and recent surge in price has come with low volumes.
A daily close below 940 could further pull it down towards 850-775.
Pattern negates if price moves above 1075
All the best
Bullish BAT on XAU/USDThere is a good chance for a prospective bullish BAT pattern on OANDA:XAUUSD if price touches around 3021.

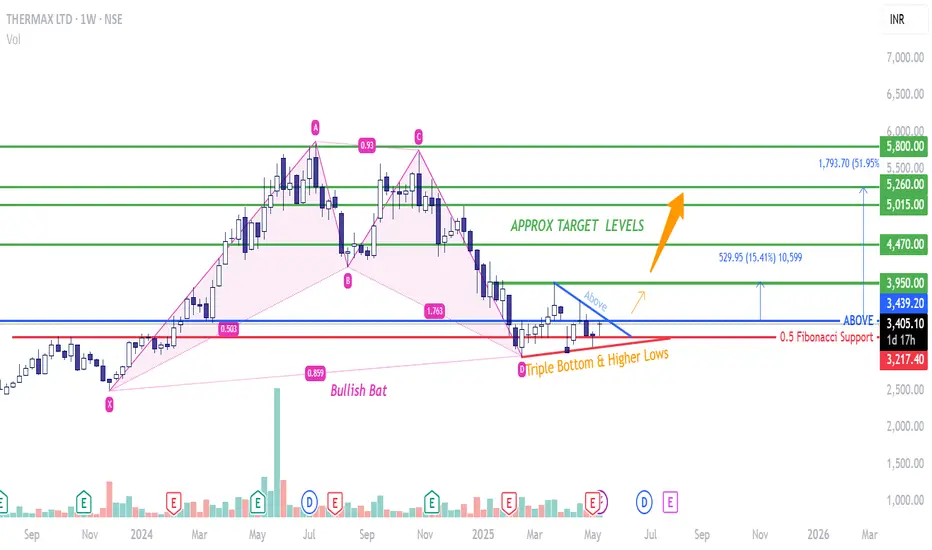
THERMAX - Bullish Bat -Bullish Bat is a harmonic pattern as shown in pink.
-Usually, during the base formation post making a Bullish bat pattern, a lot of big players accumulate which is then followed by a sudden spurt in prices.
- I see a triple bottom being made in an upward trend line suggesting Higher Lows.
- The base length can vary depending on the market scenarios. Patience is required in this kind of bamboo shoot stories.
- Here the base pattern suggests a symmetrical triangle is being formed. Too early to claim but so far looks like one. Hoping for a supersonic breakout from a symmetrical triangle pattern and a harmonic pattern.
Bearish pattern in InfosysIt is a clear neckline breakout with strong displacement candle. This confirms that the price will fall in upcoming days upto D point. This is for educational purposes only.

IDFC First BankIDFC First Bank Trade Setup - Key Levels to Watch! 📊🚀
Stock: IDFC First Bank Ltd (NSE)
Timeframe: 1D Chart
Current Price: ₹58.39
Entry Level: ₹56.45 - ₹57.18
Stoploss: Below trendline break
Again Entry 51 Around.. 3 to% Stoploss
🎯 Bullish Targets:
✅ ₹66.23 (Breaking Range)
✅ ₹75.16
✅ ₹86.30 (Final Target)
🔻 Bearish Breakdown Levels:
⚠ Trendline breakdown → Next major support at ₹51

Kernex Microsys (KERNEX) Short term (6 to 12month) HoldingSL Weekly candle close only, Target Trigger Price
All detail for chat. good entry at mark price only. and must stoploss minimum risk and good profit. risk ratio 1:1 to manage modified SL. This is not call, Just my idea. Please understand your risk and take full responsibility of your actions

Kernex Microsys (KERNEX) 3 month HoldingSL day candle close only, Target Trigger Price
All detail for chat. good entry at mark price only. and must stoploss minimum risk and good profit. risk ratio 1:1 to manage modified SL. This is not call, Just my idea. Please understand your risk and take full responsibility of your actions
