CNX FINANCIAL good short candidateCNX Financial Spot CMP 14200
Bearish Bat Pattern Formation
PRZ range 13950-14150
SLZ zone 14750
Down side 12500-12000-11500 possible.
Any reversal below PRZ zone that is below 13950 would confirm reversal,, Index can see good retracement below this levels once pattern reversal confirms.
RSI Divergence :- Price making higher high, RSI making lower high,, Bearish divergence, RSI overbought ..
Eliot wave :- 3rd Impulse wave of Impulse phase is on verge to mature,, wave 3 have extended around 2% of wave 1.. as per theory wave 3 can be around 1.618,,2,,2.618 % of wave 1,, If Corrective wave 4 unfolds from this levels we can see retracement of 0.236 to 0.382% of wave 3.. Price wise which can be around 12500 to 12000 levels.
Bat
RealTime: (Introducation of Alternate) Bat T-Bar on ITC.The Specification of Alt. Bat Patterns are the following:
The B point retracement must be a 0.382 retracement.
It must have a minimum 2.0BC projection .
Requires a 1.618 AB=CD calculation.
For the targets, I used a previous important level as 171.8 & 168.9 OR you can also use retracement level to secure your profit.
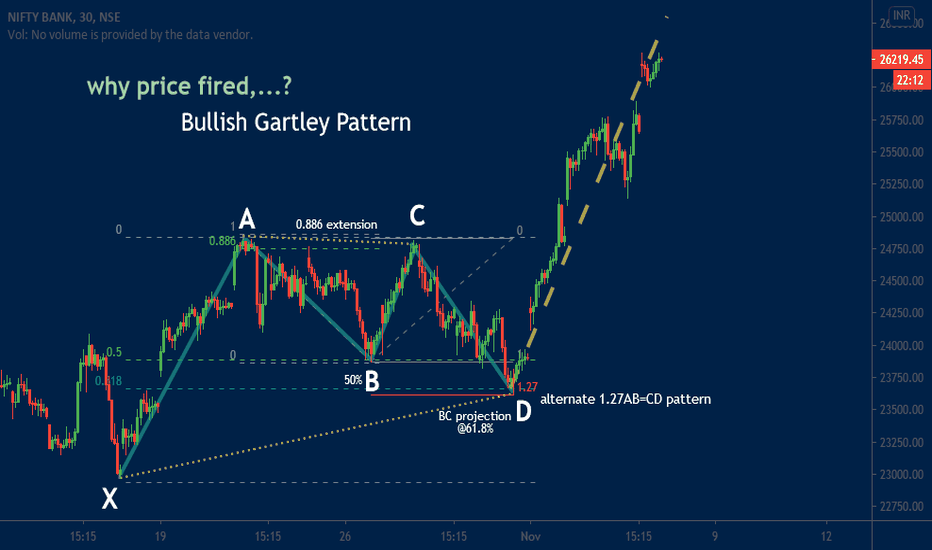
Question for Harmonic Trader & Why price fired? BANKNIFTYQuick reversals from Bat pattern PRZs are quite common.
The mid-point "B" at exactly 50% retracement.
Alternate 1.27AB=CD pattern.
BC projection @61.8%.
The price quickly reversal seen after "D".
Question of Harmonic Trader/Analyst is ,
Bat Or Gartley?
Why did birth to this question?
- The Gartley Pattern required point "B "50% and 1.27AB=CD pattern required. In essence, One of the most important numbers in the pattern is the completion of point D at the 0.786 of XA.
- The Bat utilizes a BC projection that is at least 1.618 & the BC projection must not be a 1.27 but in this case, we have 1.27 AB = CD .
The Bat OR Alternate Bat Pattern forming by USDINR.The price will move upwards towards the PRZ area where I can expect selling pressure and price can fall up-to 38.2 or 61.8%.
Let's watch for the Terminal Bar near the PRZ area to execute the trade.
The Perfect Bullish Bat Pattern on EURUSD...!!!
The mid-point "B" has retraced 50% of leg XA.
Either the Alternate 2AC=CD at 1.16791, or 1.618 AB=AC
The 0.886 "D" point retracement of XA leg as defined at 1.17108 is the starting of the PRZ to enter a long position after the Terminal Bar is verified.
The range of the PRZ is 300 pips starting from 1.17108 to 1.16791. The TERMINAL BAR of this pattern will then be defined for the accurate reversal .
District Bullish Bat pattern is going formed on the DIVISLAB.(i) A Bullish Bat pattern is defined when the B point is less than a 0.618% retracement and In the above chart there is 50% B point of XA leg retraced.
(ii) A Bearish Bat Pattern occasionally forms after retracing from a critical high point. ie, 3388.70
the retracement 0.886 will occur close to the prior high when completed, which is X.
Wait for the entire Potential Reversal Zone to be tested before executing, to validate.
Terminal Bar means reversal bar is important to excuse our trade setup.
For target, You can use Fib Ratio 62.8% and 38.2% as targets.
LONG HINDPETRONSE:HINDPETRO
#HINDPETRO have formed a bullish candlestick pattern around the bullish Harmonic pattern with bullish divergence on the daily chart but 170 being the imidate resistance looking at the past price structure. ABOVE 170 WE CAN SEE THE STOCK TO GIVE A GOOD MOVE TILL 177 / 186 / 199 TRAILING SL IS MUST KEEP PREVIOUS 3 BAR CANDLESTICK AS SL AND CAN TRAIL. DO YOUR OWN RESEARCH.
HDFC BANKHDFC Bank reversed from a Bearish Harmonic Bat and now has activated a Bearish C Clamp as per Ichimoku study. It faces resistance at 1210 and it could retrace till 1130/1080 provided it does not breach above 1240
Harmonic Trading Patterns are formations based on Fibonacci Ratios which indicate reversal of a trend with retracement levels of 38-50-62% of the trend line.
Ichimoku is a Japanese origin study of charts based on specific Moving Averages combined together to give a trend based signal in terms of both Price and Time.
Bharti Airtel is on the verge of breakoutFollow these three rules to take a trade :
1. It should break the ongoing triangle pattern.
2. The breaking candle should have high volume.
3. There should be a retest.
4. Take the entry at the second green candle after retest.
Do comment if you have any other doubts as well.
TITANIt has made a Bearish Harmonic Bat in daily time frame. It could retrace till 1200/1175/1100 provided it does not start sustaining above 1270 once again.
Harmonic Patterns are derived from Fibonacci Ratios when each angle of retracement aligns to confirm a reversal probability of 38-50-62 % of the existing trend.


