BANDHAN BANKshare name : bandhan bank
call type : positional
- share is forming a falling wedge pattern with
morning star on c point and hammer candle on
monthly time frame which shows the buyer
presence in this stock
- we can accumulate this share at this level and
look for the targets of 333 and 367 as per
cypher
- stop loss is 209 for this script
thanks
Bearish Cypher

BEARISH CYPHER IN MCX CRUDEOIL IN 15 MIN TIMEFRAMEEntry and Exit Levels Marked In Red and Blue Lines, SL Marked In Black
This Is Just A View
Trade As Per Your Own Analysis
Good Luck

BEARISH CYPHER IN CRUDEOILWe have bullish ABCD extended pattern already in Crudeoil, still we have minor patterns inside pattern we got, If break yesterdays high i will take sell entry as per attached setup.
This is just my own idea.
You take your own analysis to take this entry.
GOOD LUCK!

KOTAKBANK: A Bearish Trend "
TECHNICAL ANALYSIS OF NSE:KOTAKBANK
The LAST CLOSE PRICE of NSE:KOTAKBANK is 1733 . The PARABOLIC SAR is showing the DOWNWARD SIGNAL with TREND as DOWN TREND . The FIBONACCI LEVELS analysis shows that the CLOSEST FIBONACCI LEVELS is 0.618 at the FIBONACCI STOCK PRICE LEVEL of 1733.05. From here, the Key Support and Resistance levels are SUPPORT 1 at 250.07, SUPPORT 2 at 1773.43 with RESISTANCE 1 and RESISTANCE 2 at 1716.55 and 1685.05 respectively. The Key 50% FIBONACCI LEVEL stands at 1756.47 which is the crucial Fibonacci Level determining whether the scrip will maintain the trend or not.
The STOC RSI has the values K and D as 0.72 and 0.72 respectively. At this level it the status is OVER SOLD. When we look at the Moving Averages, MACD is the crucial indicator to look into. With MACD VALUE at -9.75 and 26.01 at -3.79 along with HISTOGRAM showing values of -5.97, the STATUS is clearly DOWNWARDS.
The best indicator to determine the Trend Reversal is FISHER TRANSFORM and currently the values of FISHER and TRIGGER stand at -2.79 and -2.51 with TREND CHANGED TO SELL as DOWNTREND. A very important factor while making the investment is to see if there has been already too much of Buying or Selling, and that are we entering too late into the transaction or not. Thus, with WILLIAM's R% value at -0.8666 the STATUS is OVER SOLD.
No one wants to buy costly things, and thus always look for the bargain or appropriate price levels to buy things. Same applies to Stocks, however the only exception would be some Hot Stocks that one wants to have any price. Looking at this perspective, the P/E RATIO of the stock stands at 34.35 which signifies its Price Level to be TOO EXPENSIVE.
>>> RECOMMENDATION is : SELL ."
Disclaimer:
The analysis is only for illustration purposes only. Please consult your financial advisor, agent, broker before acting on any information. We may or may not have positions in the stock and our actions may be contrary to the one mentioned here. This analysis may or may not be updated. We would not be responsible for the profit/loss resulting from this analysis.

LTTS two opportunites Long and Short first long with the target 2900, then short with the target of 2800 always trail your stop loss
LTTS buy around 2500-2530 with the sl of 2430 ( sl on 15 min candle close )
Sell around 3000-2950 with sl of 3070 (sl on 15 min candle close )

Jamna Auto Harmonic bearish Reversal Jamna Auto in the daily chart showing a bearish reversal as per Harmonic Cypher Pattern.
Strategy:
One can enter a short trade at or below 57 ( Fibonacci 0.786 level) with a Stoploss of 65. The exit may be planned at 31 marks.
Risk Reward ratio -: 1:2.5

Nifty - Bearish Cypher in 15180-15200 Pattern Fails & Do not sell if Nifty crosses above 15200 - Sell only in 15180-15200 zone

NIFTY Target 13200 before 13 Feb 2021Support line post-Mar 2020 are Resistance line pre-Mar 2020 are clearly coinciding at 13200 levels. Also, if you see Fibonacci retracement level also falls around 13000 levels. A 3-day continuous fall clearly reflects a weakness in the market with all global markets bleeding red.
Finally #bears will be able to take control of the market. #Nifty50 #fall #bearmarket #crash
Sell Nifty Feb Fut or add puts into your positions.

Bearish Cypherleg CD should be around 0.78 times X to C but its around 0.9 .. nevertheless .. suggestions are welcome

NiftyNifty hourly is at the PRZ of a Bearish Harmonic Cypher. It also happens to be a resistance as per Ichimoku in hourly time frame. A retracement till 12100 could be probable from here provided it does not give an hourly close above 12250.

CENTURY TEXIn weekly time frame it is showing signs of revering from a Bearish Harmonic Cypher PRZ. In hourly time frame it has made a Bearish Harmonic Gartley and reversed. Failure to hold 490 on closing basis in daily time frame could be a trigger for the expected down move till 450. In hourly time frame trading above 513 would negate the move for now.

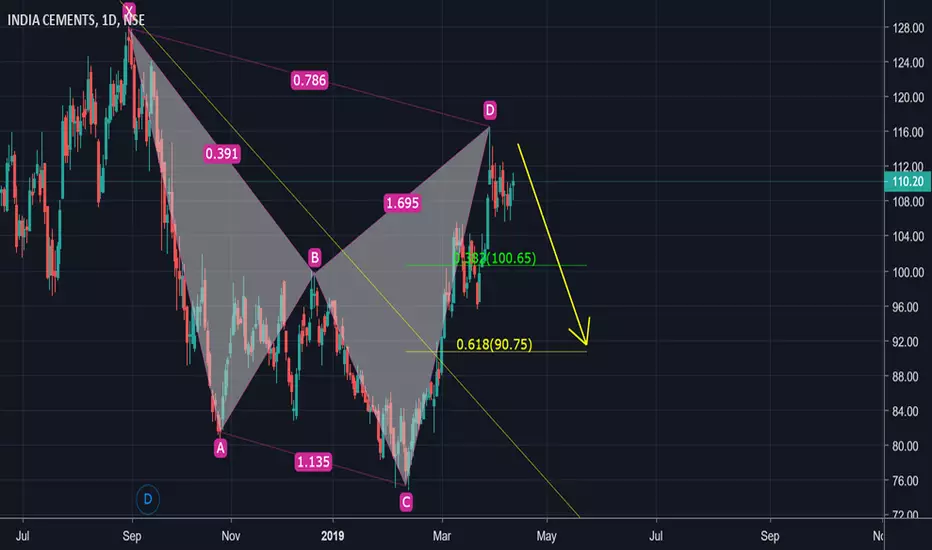
India cement heading southward ?Bearish Cypher Harmonic Pattern has been formed in the daily chart of India cement, which is highly reliable. It is neither end of uptrend nor start of downtrend, but as per the completion of Cypher harmonic pattern, Price may fall upto 0.618 retracement of CD leg. Hence first target would be 0.382retracement of CD leg i.e 100.65 and next target would be 0.618 retracement of CD leg i.e 90.75.
Disclaimer: This is for education purpose only
#tatamotors ready to fall now?NSE:TATAMOTORS
Tatamotors shown good rally but now near to reversal zone
minor resistance is near 234 - 238
Major resistance is near 247 - 453


Bearish Cypher Colpal Bearish Cypher Colpal
Prz - 1244.50 - 1247
Sl - 1250
Target 1 - 1236
Target 2 - 1231


Bearish Cypher Jsw SteelBearish Cypher Jsw Steel
Prz- 296.50 - 300
Sl - 302
Target 1 - 294
Target 2 - 292.50


Bearish Cypher Pattern in RComBearish Cypher Pattern completes in NSE:RCOM . RSI is massively Over Bought
Target - Rs. 25


SBI : That Potential Cypher...In SBI, we have perfect-potential cypher formation if all goes as expected we will be getting reversal around the 305's zone to downside. RSI also looks bit oversold but on cypher completion it may go well above current levels.
Aggressive traders can enter Right on touch of 305's zone
Conservative traders look for additional setups in the zone or an reversal before entering !
Moreover Trade only if you have traded harmonics earlier, if No, its not at all a problem, Look for other simple setups in the same zone in SBI. As we usually say, all strategy's are good as long as it's followed with discipline, there is no need of complex ones.

Bearish Harmonic Cypher @ 178.5 _ KARNATAKA BANK 15 MinsHi,
A Bearish Cypher near completion on 15 mins chart of KARNATAKA BANK.
Trade levels are as follows - Wait for price to test the Potential reversal zone & watch price action before making entry.
ENTRY ( PRZ Completion) : 178.5
TARGET 1 : 175
TARGET 2 : 172.9
STOP : 182.3
Trade with Care
Gulz

Bearish Cypher on Axis Bank Hi,
A Bearish Cypher may complete axis bank on this week.
Trade levels highlighted on chart.
Watch price action once the price hit potential price reversal zone (PRZ) before making entry.
Trade with Care
Gulz.
