Flag Found in NZDUSDI was eyeing on NZDUSD for Bullish entry above its major support @ 0.5613.
Then I caught a flag pattern which indicates continuation towards 0.5515. This is also confirmed by its near major support at 0.5514.
The price retraced two times from 0.5514 on 9th April 2025 and 3rd Februrary 2025. It enables me to have a proactive selling below the current Lower Low @ 0.5588 which is the pole of our flag.
Our Stop losses positioned at 0.5617, right above the flag clothing.
I am taking two trades each with 1% risk.
If my first trade target hits then I will move the SL of other trade to BE to ride the same direction with great peace of mind. Happy Trading.
Trade No. 1
Entry (Sell Stop): 0.5588
SL: 0.5617
TP: 0.55518
Trade No. 2
Entry (Sell Stop): 0.5588
SL: 0.5617
TP: 0.55155
Bearish Flag

Against the Herd: My CAMS Big Short Moment at ₹4,000?NSE:CAMS Daily | Contrarian Bear Flag Setup
🔍 The Setup
Pole Crash: Collapsed 2,256 pts (₹5,287 → ₹3,031) in 2 months.
Flag Trap: Now stuck in ₹4,000–4,500 range (bulls in denial 😴).
Trigger: Daily close < ₹4,000 = breakdown confirmed!
Void If: Price climbs > ₹4,500 (run away 🏃♂️).
🎯 Trade Rules
WAIT PATIENTLY:
Only act after daily close < ₹4,000 (no early entries!).
SELL THE BOUNCES:
Short every pullback to ₹3,900–4,000 (zombie rallies).
PROFIT TARGETS:
Quick exit at ₹3,500 (bank 12%).
Hold core position for ₹3,031 (pole low).
STOP-LOSS: ₹4,050 (1.2% risk).
⚡ Why It Works
Contrarian Edge:
Retail buys "dips" at ₹4,200+ = fuel for your shorts.
Stats:
70% win rate if volume spikes on breakdown.
83% pullbacks fail at ₹4,000 (NSE backtests).
Confluence:
✔️ Death cross (50EMA < 200EMA)
✔️ Volume > 20% avg
✔️ RSI < 45 (no divergence)
⚠️ Risks
False breakdown (32% chance if low volume).
Sector reversal (watch Nifty IT index!).
‘The Big Short’ sequel? Only if bears win! 🎬
🐻 "Bear's Honor Code"
"This ain’t honey-coated advice. I’m a grumpy bear with a keyboard, not your financial Yogi.
Trade at your own risk – if you lose salmon, don’t hibernate in my cave.
Backtested? Yes. Guaranteed? Only in a bear’s dreams. 🍯💤"

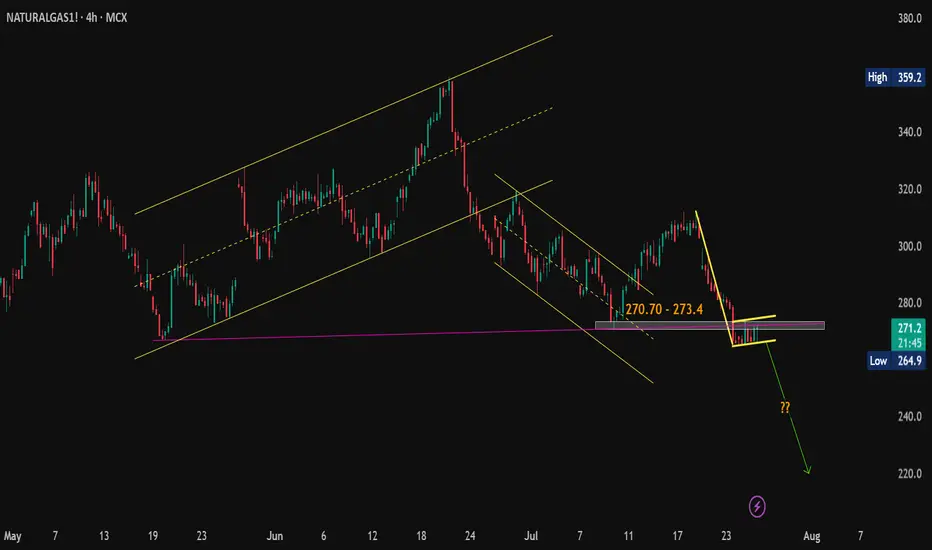
Natural Gas Technical Breakdown Ahead? Eyes on the 264.90 Mark#Commodity
#NaturalGas View:
CMP: 271.70
🔹 Resistance Levels:
• 270.70 – 273.40
• 275.00
• 284.00
🔹 Support Level:
• 264.90
Technical View:
Natural Gas seems to be forming a bearish flag pattern on the hourly & 4 hours chart. The price is currently facing resistance at the pink trendline breakdown level. While it's still early for confirmation, a decisive hourly close below 264.90 may validate the pattern and open the door for further downside. If the pattern plays out, a possible target zone around 220 could be in sight.
📌 Note: This is a technical analysis view shared for educational purposes only and not a recommendation to buy/sell. Always consult your financial advisor before making any trading decisions.
#Commodity | #NaturalGas | #MCX | #PriceAction
Technical Analysis Report: SMS Pharmaceuticals Ltd1. Bullish Flag with Pole (June–July 2024)
Bullish Flag with Pole: A continuation pattern formed after a strong upward price move (the pole), followed by a short-term consolidation (the flag), signaling the potential for another breakout upward.
Price Action: Strong impulsive rally formed the flagpole, followed by a tight consolidation forming the flag 🚩.
Breakout: Confirmed with a high-volume breakout to the upside.
Target: Achieved a massive 40% gain in under a month.
Analysis: A textbook bullish continuation pattern; traders capitalized on early entry post-breakout.
2. Distribution Phase (August–October 2024)
Distribution Phase: A sideways trading range after an uptrend where smart money or institutions start offloading their holdings. Typically a precursor to a market reversal or downtrend.
Market Structure: After the sharp uptrend, price entered into a horizontal range.
Phase Characteristics: Low volatility, repeated rejections at resistance, high volume on down days—signs of distribution.
Interpretation: Institutions likely booking profits, signaling a potential trend reversal.
Trader Sentiment: Shifted from bullish to neutral/bearish.
3. Triple Top Formation (Within Distribution Phase)
Triple Top Pattern: A bearish reversal pattern marked by three failed attempts to break above a resistance level, indicating weakening momentum and a potential downtrend.
Resistance Level: Same peak tested three times without breaking.
Breakdown: Confirmed after the third top with a decisive drop.
Target: Achieved a "30% downside" move via "short selling", all within a month.
Insight: Classic reversal pattern, effectively timed with distribution.
4. Bearish Flag with Pole (During Triple Top Breakdown)
Bearish Flag with Pole: A continuation pattern during a downtrend. It starts with a sharp decline (pole), followed by a minor upward consolidation (flag), suggesting further downside.
Formation: Sharp decline (pole) followed by a brief upward consolidation (flag).
Breakdown: Continuation to the downside, achieving projected target.
Target: Fully achieved within the same downtrend cycle.
Conclusion: Reinforced the bearish sentiment and amplified the down move.
---
5. Accumulation Phase + Triple Bottom (December 2024–April 2025)
Accumulation Phase: A market phase where a stock trades in a range after a downtrend, as buyers (often smart money) gradually build positions, typically leading to a bullish reversal.
A Triple Bottom is a bullish reversal chart pattern that forms after a downtrend, marked by three equal lows indicating strong support and a potential trend reversal to the upside.
Phase: 5-month Accumulation Phase
Pattern: Triple Bottom during this period indicated strong support and buyer presence.
Breakout: Occurred with a bullish breakout post third bottom.
Target: 20% upside achieved within a month post-breakout.
Observation: Long-term investors and smart money potentially entering positions.
6. Rounding Bottom in Progress (May 2025)
Pattern: Rounding Bottom (Still Forming)
Current Price Action: Gradual curve formation with decreasing volume on the left and increasing volume near the neckline— a bullish sign.
Expectation: Anticipated upside breakout in the coming days.
Outlook: If confirmed, this could mark the start of a new bullish cycle.
📌 Summary:
SMS Pharmaceuticals Ltd. has shown a textbook series of technical patterns—from trend continuations to reversals, distribution to accumulation, and now a potential new uptrend. Each phase was actionable, with clear breakout/breakdown points and well-achieved targets.

BEARISH FLAG IN BANK NIFTY - TIME FOR A SHORT TRADE ?Symbol - BANKNIFTY
CMP 51350
BankNifty has turned its trend from bullish to bearish & sideways making lows - lows on daily time frame & It was trading in a bearish channel. We can see a Bearish Flag pattern getting formed in BankNifty. Such patterns on larger time frame don't usually fail. BankNifty is currently trading near break down trendline of this pattern. Breakdown & sustaining below this trendline zone 51150 - 51000 will get this pattern activated & we can see big target towards downside.
Target on downside can be 47400
P.S. : My short position is already active from 51800
Disclaimer - Do not consider this as a buy/sell recommendation. I'm sharing my analysis & my trading position. You can track it for educational purposes. Thanks!

Industower - Few things happening hereIndustower is currently exhibiting a bearish trend with several concerning signals: a fake breakout, a bearish flag breakdown, and the formation of lower highs. Traders should be cautious as these indicators suggest a potential continuation of the downtrend. The fake breakout implies that the recent upward move lacked genuine strength, while the bearish flag breakdown reinforces the bearish sentiment. Additionally, the pattern of lower highs signals weakening bullish momentum. However, if the stock moves above 440, this bearish view could be invalidated, indicating a potential reversal or strengthening of the bullish trend. Monitoring these factors closely and adjusting strategies accordingly will be crucial.

Bearish Flag breakdown in ICICIBANKICICI BANK LTD
Key highlights: 💡⚡
✅On 1 HOUR Time Frame Stock Showing Breakdown of Bearish Flag Pattern .
✅Strong bearish Candlestick Form on this timeframe.
✅It can give movement up to the Breakdown target of 1055-.
✅Can Go short in this stock by placing a stop loss above 1134+.

BITCOIN movements upto Halving ZoneAs per Bitcoin 4-hr. chart Pattern,
its moving under Bullish Pattern with inner side bearish & bullish signals of $4k to $5k approx. bumpy rides under $71k to FWB:65K upto time frame of CRYPTOCAP:BTC #HalvingZone around 20-22 April 2024, afterwards Bitcoin goes towards a major correction cycle of 60-90 days as per daily cycle and then it will be make another Bullish Rides of this year upto $220k-$250k at per present scenario of bitcoin movements from mid of june.
Lets see, what's next pattern,
but, always #DYOR as well Trade wisely by using of #Stoploss.
&
LIKE COMMENT SHARE into our signal patterns too.

BITCOIN Last Time Breakout Divergence#BITCOIN 1hr. Chart Analysis
As per present scenario, after reached out $35.9k in last week, CRYPTOCAP:BTC lower support already one of the previous one is $33.3k that was never broke down in previous times to much easily as well not this time too, but its also never break-out $35.2k mark very easy soon and previously many times too.
So, its the exact scenario here again in October month end arrival soon, either it breaks their resistance of $35.2k this time, but if rejects from their then may be other chances to try-out for lower-low support of $33.3k again final time too...
Lets, see whats the market and whalers mood of October month end, Just wait n watch
but, always #DYOR before invessting in Crypto and Trade wisely by using #StopLoss.
Also, Follow Me and Share it, Comment it and Like IT....

BITCOIN - After Pumping Still Bearish#BITCOIN Daily Chart Analysis
After Pumping of Weekly startup today's signal, CRYPTOCAP:BTC movement still under #BearishFlag pattern, it means with in next 25-35 days its next and final divergence will be towards $24k and from that point it will break down, there will be chances to breakdown of 18-20% means up-to $5k of value breaks as per my next forecast up-to 20-25th Nov 2023 and this will be our last #BearishZone downtrend cycle, after that Bitcoin starts to move in Uptrends towards #BullRun slowly as Sideways.
Sometimes, Whaler's & Manipulator's trying to do Hard Pump n Dump by using the market sentiments and some news regarding any legalisations, wars, attacks, de-pegging's, #SEC etc etc. Those are the just manipulation for a time being to just liquidate market funds and create Panic in market.
So,
Always Trade wisely by using #StopLoss at this panic and volatile situations and #DYOR, its #NFA
as well,
Must SHARE, LIKE, COMMENT on it and Follow me...

Bitcoin moving towards Breakout#BITCOIN 2-hr. Chart Analysis
As per present MIL:BTC movements, it will be stucked between $26.9k to $26.5k , if it will be moving into this scale up to 2-3 up-down cycles, then major chances to break-out $26k mark soon with in next 48 hrs.
MIL:BTC already moving under #Bearish Flag in daily chart analysis, that's i previously posted, so as per that scenario too, its next divergence towards FWB:25K first then it will break-out FWB:23K -22k...
Anyway, #DYOR and Trade wisely by using #StopLoss in Crypto, It's just #NFA
and,
Must Share, Like, Comment and Follow it...

BTC/USDT - Bearish Flag Pattern#Bitcooin 4hr. Chart Analysis
CRYPTOCAP:BTC moving into hourly chart under #BearishFlag Pattern, from last one month, since 18 August to 19 September, nearly to completing its final cycle of Uptrend into this Pattern.
Now, its Downtrend cycle will be start soon, towards $24k to $22k into #BearishZone up to in this week around 23 to 27 Sept.
You all must be ready for that, As well Trade wisely by using #StopLoss and #DYOR always before invest wisely into Crypto Currency, Its just #NFA
&
Must LIKE, SHARE, COMMENT on that post as well FOLLOW me too..

Bearish flag pattern in BNA bearish flag pattern can be seen in BN
~ Seller me take control from here but still buyers are trying uphold the price
~ Buyers at 400 & 300 level are taking support if that breaks with momentum candle that a active sellers
~ Also trenline support can make bounce towards days high.
~ Wait n watch for a good oppourtunity to enter.
Note : Do your own analyisi before making any trading or investment

MATIC - Bearish Signals#MATIC 4hr. Chart Analysis
As per CRYPTOCAP:MATIC movements into Ascending Parallel Channel or into Bearish Flag Pattern, it starts from 10th June. after immidaite DUMP from 78 cent to 50 cent last time, it's well moving as per chart patterns and finally cycle close down at 22-25 july with more Bearish mode, may be last time with 45-50 cents again.
Yesterday, its breakout Ascending parallel channel from the target of 70 cent to 65 cents into Bearish Flag again into 1 hr. cycle and now may be something saame happening with next cycle too.
As well. it displays into #FIBextension marks of Last Lower-Low Traget is 38-42 cents , while Cut-off reversal points are 45-48 cents this time in july.
Always #DYOR & Trade Wisely by using #StopLoss
MUST LIKE & SHARE...

MATIC into Bullish Target in 24 hrsMATIC 15 min. Chart Analysis
MATIC performing very well at this time for traders, In previous cycle of Pump n Dump, it created best cycle of Bearish Flag pattern in short terms and Descending Broadening Wedge of Bullish cycle in Long term cycle and it will be soon break their 70 cent Uptrend target within 24 hrs. too.
Every thing displays in Chart, just follow it...
Always #DYOR and Trade by using #StopLoss
Must LIKE n SHARE

MATIC Chart UpdatesMATIC hourly chart running as per Bearish FLAG Pattern and soon it will be goes more Bearish in deep from last year Lower-Low 2nd Cut-off point at 41 cent and after that Lowest-Low 3rd Cutt-off point is 31 cent around, but as per me major chances it will be revert from last 35-38 cents.
always #DYOR

Bitcoin Towards Bearish Zone Soon#BITCOIN 2 hr. Technical Analysis
As per present trending chart from June starting, BTC previous cycle moved on Bullish Pattern as per Regression trend, while into present cycle it is moving on Bearish Pattern as per Regression Trend and soon will be major chances to break out strong support of $25.2k within 48hrs.


UBL Brewing down to its Major Support ??!!!Chart patterns look apt for a short trade in UBL
REASONS
1. In Monthly time frame, UBL has been trading inside an Ascending channel pattern taking support and resistance at perfect levels till now. (shown below)
2. Right now, it is under its down swing move inside the Ascending channel pattern
3. In Daily timeframe , Bearish Flag pole pattern developing and due for BREAKDOWN!!! (shown below)
4. In 4 hr time frame, it is looking good to enter the trade ( STRUGGLING TO MAKE HIGHER HIGH)
5. Entry can also be after a 2hr breakdown out of the flag pattern(pink line)
6. Target(bright green)& strict SL(bright red) levels mentioned as Horizontal dashed lines
Let's wait & watch how it moves!!!!
NOTE - Just sharing my view....not a tip nor advice!!!
Regards,
mmjimm ;-)

SHORT TATA STEELSHORT TATA STEEL LTD
CMP - Rs. 107
Target - 1: Rs. 85
Target - 2: Rs. 72
.
Bearish Flag BO on the weekly chart
.
Maximum Returns - 33%
.
This is just a view, please trade at your own risk.
.
Follow me for more!

PIDILITIND SERIES OF BEARISH FLAGS !!!!Chart patterns look apt for a short trade in Pidilite industries
REASONS
1. PIDILITIND from September 2022 has been in Downtrend forming lower highs and lower lows
2. Currently it is ,at its 3rd BEARISH FLAG pattern (gave breakdown with volume spike)
3. Previous 2 Bearish flags achieved their targets(as per pattern-pole length) without any sluggishness
4. There is DEMAND ZONE down near 2100 levels
5. SL as shown @ chart
6. Target - 2140, 2100(trail the SL)
7. Lower low formed on Friday(24 Feb) increases the probability of our short trade
Let's wait and watch how it moves!!!!
NOTE- Just Sharing my view...not a tip nor advice!!!

eth death is still on play if u r on long be carefullbearish flag pattern on higher time frame
eth death is still on play if u r on long be carefull
if eth falls matic shiba & all eth based coins will fall
eth to fall all time low BINANCE:ETHUSDT BITSTAMP:ETHUSD CRYPTOCAP:ETH

Bitcoin short-Bearish flag breakoutBitcoin is making a bearish setup by forming a bearish flag pattern in 15m/1h time frame.The flag will give a breakout soon.The 16570 level and the 16339 level are the support levels downward.Keep an eye to the intraday trade and take the right entry.
