Beyond Technical Analysis

NIFTY Analysis for 05th JAN 2026: IntraSwing Spot levels💥 NIFTY Analysis for 05th JAN 2026: IntraSwing Spot levels 💥
🚀Follow GIFTNIFTY Post for NF levels
💥Level Interpretation / description:
L#1: If the candle crossed & stays above the “Buy Gen”, it is treated / considered as Bullish bias.
L#2: Possibility / Probability of REVERSAL near RLB#1 & UBTgt
L#3: If the candle stays above “Sell Gen” but below “Buy Gen”, it is treated / considered as Sidewise. Aggressive Traders can take Long position near “Sell Gen” either retesting or crossed from Below & vice-versa i.e. can take Short position near “Buy Gen” either retesting or crossed downward from Above.
L#4: If the candle crossed & stays below the “Sell Gen”, it is treated / considered a Bearish bias.
L#5: Possibility / Probability of REVERSAL near RLS#1 & USTgt
HZB (Buy side) & HZS (Sell side) => Hurdle Zone,
*** Specialty of “HZB#1, HZB#2 HZS#1 & HZS#2” is Sidewise (behaviour in Nature)
Rest Plotted and Mentioned on Chart
Color code Used:
Green =. Positive bias.
Red =. Negative bias.
RED in Between Green means Trend Finder / Momentum Change
/ CYCLE Change and Vice Versa.
Notice One thing: HOW LEVELS are Working.
Use any Momentum Indicator / Oscillator or as you "USED to" to Take entry.
⚠️ DISCLAIMER:
The information, views, and ideas shared here are purely for educational and informational purposes only. They are not intended as investment advice or a recommendation to buy, sell, or hold any financial instruments. I am not a SEBI-registered financial adviser.
Trading and investing in the stock market involves risk, and you should do your own research and analysis. You are solely responsible for any decisions made based on this research.
"As HARD EARNED MONEY IS YOUR's, So DECISION SHOULD HAVE TO BE YOUR's".
Do comment if Helpful .
Do Comment for In depth Analysis.
❇️ Follow notification about periodical View
💥 Do Comment for Stock WEEKLY Level Analysis.🚀

NIFTY Weekly Level Analysis: From 05th - 09th JAN 2026💥Compare NIFTY Spot DAILY Post
🚀 Follow GIFTNIFTY Post for NF levels
💥Level Interpretation / description:
L#1: If the candle crossed & stays above the “Buy Gen”, it is treated / considered as Bullish bias.
L#2: Possibility / Probability of REVERSAL near RLB#1 & UBTgt
L#3: If the candle stays above “Sell Gen” but below “Buy Gen”, it is treated / considered as Sidewise. Aggressive Traders can take Long position near “Sell Gen” either retesting or crossed from Below & vice-versa i.e. can take Short position near “Buy Gen” either retesting or crossed downward from Above.
L#4: If the candle crossed & stays below the “Sell Gen”, it is treated / considered a Bearish bias.
L#5: Possibility / Probability of REVERSAL near RLS#1 & USTgt
HZB (Buy side) & HZS (Sell side) => Hurdle Zone,
*** Specialty of “HZB#1, HZB#2 HZS#1 & HZS#2” is Sidewise (behaviour in Nature)
Rest Plotted and Mentioned on Chart
Color code Used:
Green =. Positive bias.
Red =. Negative bias.
RED in Between Green means Trend Finder / Momentum Change
/ CYCLE Change and Vice Versa.
Notice One thing: HOW LEVELS are Working.
Use any Momentum Indicator / Oscillator or as you "USED to" to Take entry.
⚠️ DISCLAIMER:
The information, views, and ideas shared here are purely for educational and informational purposes only. They are not intended as investment advice or a recommendation to buy, sell, or hold any financial instruments. I am not a SEBI-registered financial adviser.
Trading and investing in the stock market involves risk, and you should do your own research and analysis. You are solely responsible for any decisions made based on this research.
"As HARD EARNED MONEY IS YOUR's, So DECISION SHOULD HAVE TO BE YOUR's".
Do comment if Helpful .
Do Comment for In depth Analysis.
❇️ Follow notification about periodical View
💥 Do Comment for Stock WEEKLY Level Analysis.🚀


Market View: Strong Uptrend Confirmation for Indian MarketMarket View: Strong Uptrend Confirmation for Indian Market
Key Condition for a Sustainable Rally
For a high-confidence and low-failure bullish phase in the Indian stock market, both of the following must hold:
NIFTY 50 sustains above its All-Time High
RELIANCE sustains above its All-Time High
> These two act as the backbone of the Indian indices. When they move together, the probability of a broad-based rally increases significantly.
Why NIFTY + RELIANCE Together Matter
NIFTY represents overall market sentiment and institutional positioning
RELIANCE carries heavy index weight and reflects FII + DII conviction
When both are above ATH:
Distribution risk reduces
Pullbacks turn into buying opportunities
Trend failures become rare
Impact on Small-Cap & Mid-Cap Stocks
Once NIFTY and RELIANCE confirm strength:
Liquidity flows down the market cap ladder
Small-caps and mid-caps outperform
Sector rotation accelerates
Stocks start moving toward their own All-Time Highs
Breakout + momentum strategies work exceptionally well
> Historically, real wealth-creating phases begin only after large-cap leadership confirms.
Trading Strategy (Action Plan)
Prefer buy on dips, not shorting
Focus on:
Stocks near 52-week high / ATH
Strong relative strength vs NIFTY
Volume expansion on breakouts
Avoid counter-trend shorts in mid & small caps
Risk Note
If either NIFTY or RELIANCE fails to sustain above ATH, market may:
Turn sideways
Enter selective stock-specific moves
See false breakouts in small caps
> NIFTY + RELIANCE above All-Time High = Green signal for Indian Market.
This combination unlocks powerful momentum in small-cap and mid-cap stocks, pushing the broader market toward new highs.

How to measure big collections with the help of astrology.Friends, These are patterns that are often not detected or are difficult to understand using chart patterns and price action alone. And this can be easily detected through astrology. There are many Amits running around in the market, so don't get confused by all of that. I will try to explain everything to you in a simpler way.
Market strength is observed with the help of Jupiter, and the entire index depends on Jupiter. And if you want to predict major market movements in advance, you need to observe certain movements and understand certain conjunctions that help you predict market declines.
You can easily find two types of market correction help of astrological.
Normal correction :-The general definition of a market correction is a market decline that is more than 10%, but less than 20% normal correction that come out every two or three years.
Big correction:- which are larger(appox 50%& plus) and appear in the market every seven or eight years after (big Time cycle).

Part 8 Trading Master ClassImportant Points for Traders
✔ Always check IV (Implied Volatility)
High IV → Selling strategies
Low IV → Buying strategies
✔ Avoid naked selling unless hedged
Unlimited risk is dangerous.
✔ Start with defined-risk strategies
Vertical spreads, iron condor, butterfly
✔ Probability matters more than profit per trade
Most professionals use credit spreads for consistency.
✔ Adjust if market moves aggressively
Rolling helps avoid full losses.

Coiled Spring Bitcoin is holding structure on the high time frames, currently reclaiming the $90k level after testing the lows. I’ve got my weighted average bands on the chart and price is respecting them so far. You can see on the daily chart how we’ve just poked back above the latest FOMC anchor (the blue line) and are squeezing between that and the breakdown AVWAP overhead. I try not to preempt levels though, I only really care about them once price actually reacts there.
Macro wise, things look decent. Yield curves like the 5y-03m and 10y-03m are positive. We’re seeing a bull steepening, not the textbook version since the 2y is still lower than the 3m, but not a cause for concern.
Other signals I’m tracking:
VIX is stable.
USDJPY is trending up but getting close to resistance, so that’s one to watch.
MOVE index is chilling, down at 63% which is historically a good zone for us.
DXY is high at 98 but trending down.
Credit spreads are super low at 2.84, so no stress there.
TGA is pivoting down now too.
Real yields aren’t doing much since nominals and breakevens are falling together.
Current pricing suggests no cut at the next FOMC, which is fine. But if a cut comes as a surprise that would be very interesting to say the least.

Exalted Jupiter in Cancer: Analyzing the Bull Run of 2026Friends, today we'll talk a little about Jupiter's astro cycle. While the trading session is influenced by Mercury, which controls the daily trading system, when it comes to long-term trends, it depends on Jupiter.
This means that if Jupiter is in a good position, in its own sign, a friendly sign, or in its own or a friendly nakshatra (constellation), it gives good results.
Two more things to keep in mind are that it is afflicted by the Rahu and Ketu axis and the Kendra houses (angular houses), as is the case when Saturn and Mars are together in the Kendra houses. That's when it keeps the market stable.
And another important point is that when it is retrograde, the market moves sideways, or finds it difficult to make new highs, especially when it is not in its own or a friendly nakshatra.
As you all know, Jupiter went retrograde in Cancer on November 11, 2025 (that was also the day of the index cycle, it was the day of the conjunction of two cycles), and will move backward until it becomes direct on March 10 or 11, 2026. During this time, it will re-enter Gemini for some time around December 5th, and this will be a time for introspection and reconsidering past events. However, at this time, Jupiter is situated in its own nakshatra. That is why there has been no significant decline in the stock index. And after January 17th of this month, the market will become even more stable. Because there will be no malefic planets in the Kendra houses, and as soon as Jupiter becomes direct, you will see even better growth in the market. In June, Jupiter is moving into Cancer, which is considered its sign of exaltation,
and at the same time, the "Hamsa Yoga" is going to form.
Just before this rally, keep an eye on the conjunction of Mars and Saturn in Pisces around April 2026. This may cause a temporary "dip" or correction. This correction could actually be the "last chance" to buy in these sectors before they surge upwards in June when Jupiter and Mars conjunct in their powerful signs.
Since we're talking about Jupiter, I'd like to share a few more things with you. In Vedic astrology, constellations are known as Nakshatras. Because the zodiac is a 360° circle divided into 27 Nakshatras, each Nakshatra occupies exactly 13° 20' (13 degrees and 20 minutes) of space.
Duration of Jupiter's stay in a Nakshatra
On average, Jupiter stays in a Nakshatra for approximately 120 to 130 days (about 4 to 4.5 months).
A market rally may be seen until November 5th when Jupiter enters the Nakshatra of Ketu in Leo.

BANKINDIA – Inverse Head & Shoulders Breakout on Weekly ChartBANKINDIA has formed a clear Inverse Head & Shoulders pattern on the weekly timeframe after a prolonged decline. The left shoulder, deeper head, and higher right shoulder reflect a gradual shift from selling pressure to accumulation.
Price has broken above the neckline, confirming the structure. After the breakout, a healthy retest of the neckline zone was completed, where price found acceptance instead of rejection. The latest candles show renewed strength, indicating follow-through after the retest.
This move highlights a structural transition from weakness to strength, driven purely by price behavior and long-term positioning.

Nifty50 and Overall Market analysisIn this video, we discuss Nifty50 and Overall Market analysis
Current market scenario
Long term vs Short term chart analysis
Major sector index analysis and my views on them
Long term vs Short term Investment approach

Hdfc life Longattached chart is of hdfc life where the stock is trying to absorb the supply from the last 1 month around 770 levels. The stock is likely to move towards 800 levels in the coming session. We can attempt this one with the stop loss around 754 and entry around 770 levels.

XAUUSD (ONDA) IntraSwing Levels For 02nd - 03rd JAN2026(3.30 am) $💰$ 🏃🏽 🏃🏼♀️ 🏃🏽♂️ $💰$
💥 Have a Pr💰fitable
New Year 2️⃣0️⃣2️⃣6️⃣🚀
1st Trading Day of New SUN
💥Level Interpretation / description:
L#1: If the candle crossed & stays above the “Buy Gen”, it is treated / considered as Bullish bias.
L#2: Possibility / Probability of REVERSAL near RLB#1 & UBTgt
L#3: If the candle stays above “Sell Gen” but below “Buy Gen”, it is treated / considered as Sidewise. Aggressive Traders can take Long position near “Sell Gen” either retesting or crossed from Below & vice-versa i.e. can take Short position near “Buy Gen” either retesting or crossed downward from Above.
L#4: If the candle crossed & stays below the “Sell Gen”, it is treated / considered a Bearish bias.
L#5: Possibility / Probability of REVERSAL near RLS#1 & USTgt
HZB (Buy side) & HZS (Sell side) => Hurdle Zone,
*** Specialty of “HZB#1, HZB#2 HZS#1 & HZS#2” is Sidewise (behaviour in Nature)
Rest Plotted and Mentioned on Chart
Color code Used:
Green =. Positive bias.
Red =. Negative bias.
RED in Between Green means Trend Finder / Momentum Change
/ CYCLE Change and Vice Versa.
Notice One thing: HOW LEVELS are Working.
Use any Momentum Indicator / Oscillator or as you "USED to" to Take entry.
⚠️ DISCLAIMER:
The information, views, and ideas shared here are purely for educational and informational purposes only. They are not intended as investment advice or a recommendation to buy, sell, or hold any financial instruments. I am not a SEBI-registered financial adviser.
Trading and investing in the stock market involves risk, and you should do your own research and analysis. You are solely responsible for any decisions made based on this research.
"As HARD EARNED MONEY IS YOUR's, So DECISION SHOULD HAVE TO BE YOUR's".
Do comment if Helpful .
Do Comment for In depth Analysis.
❇️ Follow notification about periodical View
💥 Do Comment for Stock WEEKLY Level Analysis.🚀

UCO BANK- BIG INVESTMENT OPPORTUNITYUCO BANK have currently taken support of HYDZ+QDZ+MDZ
LONGTERM TARGET should be at least 70 which is around 100% from current market price
have shared the QDZ chart
this stock should be added for regular trading opportunities as well

BTC at strong support levelBTC seems to have completed wave E of an expanding triangle.
-- EXPANDING TRIANGLE--
Wave E is generally equal to (101-161.8)% of Wave C.
In rare cases it could also be equal to 261.8% of Wave A or Wave C
---------------------------------
Wave E is already equal to twice of wave C and if it sustains above ~93,800, we could expect an upside from here.
Will keep you guys posted as the move progresses.
HAPPY TRADING !!

At last reversalWas beaten down for a long time even though the company is undervalued and fundamentally strong. Technicals were pushing it down but for the past few sessions had formed a stable buy at the long time support of 250s. If able to break above the resect high - forms a doble bottom and hence the end of downtrend

GIFTNIFTY IntraSwing Levels For 02nd JAN 2026🚀Follow & Calculate Premium with NIFTY Post for NF Trading
💥Level Interpretation / description:
L#1: If the candle crossed & stays above the “Buy Gen”, it is treated / considered as Bullish bias.
L#2: Possibility / Probability of REVERSAL near RLB#1 & UBTgt
L#3: If the candle stays above “Sell Gen” but below “Buy Gen”, it is treated / considered as Sidewise. Aggressive Traders can take Long position near “Sell Gen” either retesting or crossed from Below & vice-versa i.e. can take Short position near “Buy Gen” either retesting or crossed downward from Above.
L#4: If the candle crossed & stays below the “Sell Gen”, it is treated / considered a Bearish bias.
L#5: Possibility / Probability of REVERSAL near RLS#1 & USTgt
HZB (Buy side) & HZS (Sell side) => Hurdle Zone,
*** Specialty of “HZB#1, HZB#2 HZS#1 & HZS#2” is Sidewise (behaviour in Nature)
Rest Plotted and Mentioned on Chart
Color code Used:
Green =. Positive bias.
Red =. Negative bias.
RED in Between Green means Trend Finder / Momentum Change
/ CYCLE Change and Vice Versa.
Notice One thing: HOW LEVELS are Working.
Use any Momentum Indicator / Oscillator or as you "USED to" to Take entry.
⚠️ DISCLAIMER:
The information, views, and ideas shared here are purely for educational and informational purposes only. They are not intended as investment advice or a recommendation to buy, sell, or hold any financial instruments. I am not a SEBI-registered financial adviser.
Trading and investing in the stock market involves risk, and you should do your own research and analysis. You are solely responsible for any decisions made based on this research.
"As HARD EARNED MONEY IS YOUR's, So DECISION SHOULD HAVE TO BE YOUR's".
Do comment if Helpful .
Do Comment for In depth Analysis.
❇️ Follow notification about periodical View
💥 Do Comment for Stock WEEKLY Level Analysis.🚀

gold chartgold looking for sell which is good sign for equity market below 135000 we can expect fall in gold im totally bearish on gold there is no risk reward in gold let it correct then only invest in gold

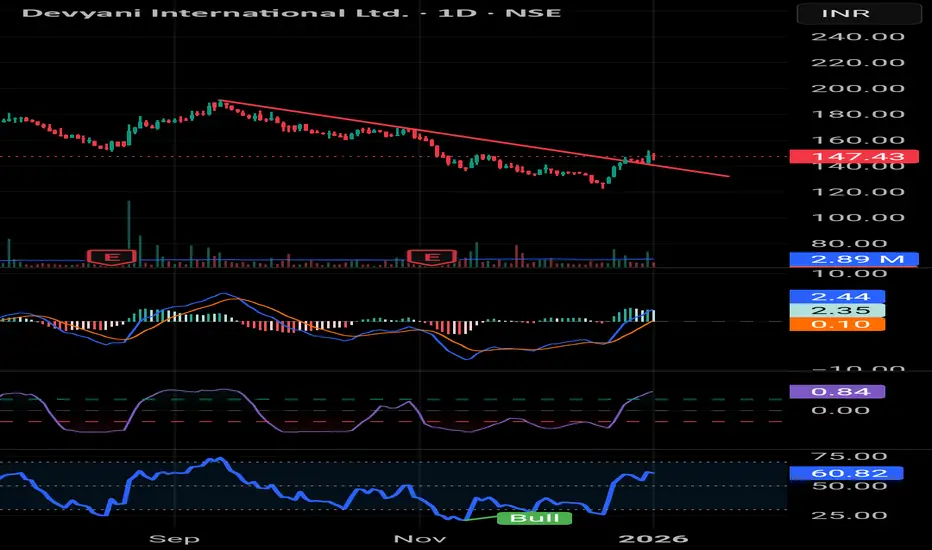
Devyani with merge catalyst at the verge of potential reversalDevyani International (DEVYANI) at ₹145-147 shows potential reversal signals.
Bearish trend persists (price below SMAs, MACD histogram negative at -2.9), but RSI ~60 hints at momentum shift from oversold (prior lows ~50), Stochastic dipping into bullish territory, and RSI divergence emerging—classic reversal cues
Merger catalyst amplifies:
Sapphire Foods board nod (177:100 swap ratio) eyes Apr 2026 close, forming QSR giant (3,000+ stores). Despite Q3 loss (-₹24 Cr), synergies promise 15-20% EBITDA boost, FII buying (Nippon/Kotak holdings up). Support holds ₹142; break ₹148 targets ₹160+
Action: Watch volume spike + MACD zero-line cross for buy.
Risk: NCLT delays.
one last push🏋🏻
Before we step down, domestic big money sees a window while most global markets are on holiday. Think of it like a child left home alone—they’ll try to clean up the mess by the time you return.
Local players are expected to dominate until tomorrow’s first session, with a strong chance of testing a triple top or nudging that level slightly. In the second half, global markets may bring the fire back into the room. Like the kid, attempts to “clean up” won’t fully succeed. Expect major manipulation—money moving between futures and cash, while quietly profiting through options in the background.

NIFTY Analysis for 2nd JAN '26: IntraSwing Spot level🚀Follow GIFTNIFTY Post for NF levels
💥Level Interpretation / description:
L#1: If the candle crossed & stays above the “Buy Gen”, it is treated / considered as Bullish bias.
L#2: Possibility / Probability of REVERSAL near RLB#1 & UBTgt
L#3: If the candle stays above “Sell Gen” but below “Buy Gen”, it is treated / considered as Sidewise. Aggressive Traders can take Long position near “Sell Gen” either retesting or crossed from Below & vice-versa i.e. can take Short position near “Buy Gen” either retesting or crossed downward from Above.
L#4: If the candle crossed & stays below the “Sell Gen”, it is treated / considered a Bearish bias.
L#5: Possibility / Probability of REVERSAL near RLS#1 & USTgt
HZB (Buy side) & HZS (Sell side) => Hurdle Zone,
*** Specialty of “HZB#1, HZB#2 HZS#1 & HZS#2” is Sidewise (behaviour in Nature)
Rest Plotted and Mentioned on Chart
Color code Used:
Green =. Positive bias.
Red =. Negative bias.
RED in Between Green means Trend Finder / Momentum Change
/ CYCLE Change and Vice Versa.
Notice One thing: HOW LEVELS are Working.
Use any Momentum Indicator / Oscillator or as you "USED to" to Take entry.
⚠️ DISCLAIMER:
The information, views, and ideas shared here are purely for educational and informational purposes only. They are not intended as investment advice or a recommendation to buy, sell, or hold any financial instruments. I am not a SEBI-registered financial adviser.
Trading and investing in the stock market involves risk, and you should do your own research and analysis. You are solely responsible for any decisions made based on this research.
"As HARD EARNED MONEY IS YOUR's, So DECISION SHOULD HAVE TO BE YOUR's".
Do comment if Helpful .
Do Comment for In depth Analysis.
❇️ Follow notification about periodical View
💥 Do Comment for Stock WEEKLY Level Analysis.🚀

FEDFINA Price ActionFEDFINA is in a steady uptrend with price holding above key moving averages and momentum indicators in the positive zone, but it is close to near-term resistance so risk‑reward for fresh entries is moderate rather than aggressive

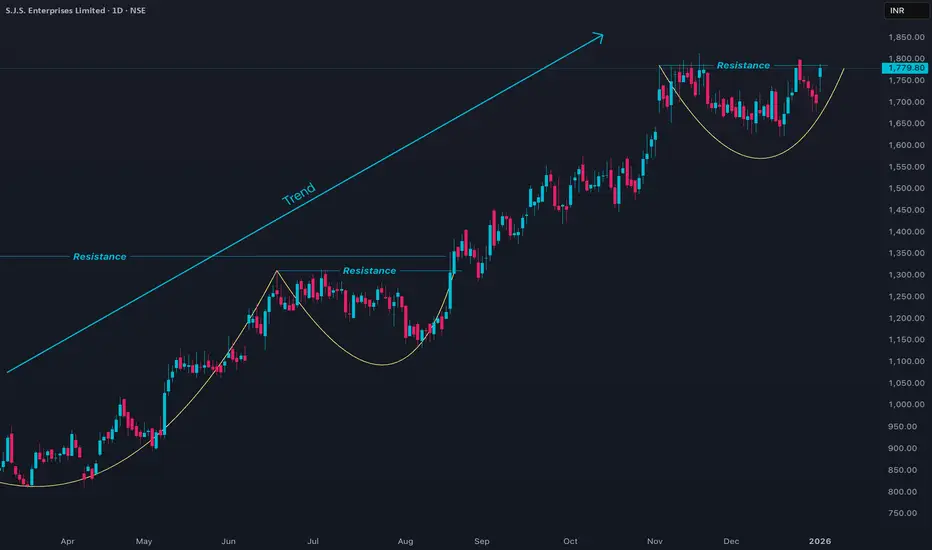
SJS Price Action1. Trend Bullish
2. Set up - rounding pattern
3. RR is lucrative
SJS is in a medium‑term uptrend but currently consolidating just below recent highs, with mixed momentum and nearby resistance, so fresh longs need staggered entries and tight risk.