ASHOKLEY Price Action1. Trend Bullish
2. Breakout & reveral set up
3. Resistance turning into support
4. Higher protected lows through out the trend and still continues
Beyond Technical Analysis

MUTHOOTFIN Price ActionTrend - Bullish
Strength - Strong
Set up - Breakout
- Very small consolidation and price breaking out faster as trend is stronger

NATIONALUM Price ActionNational Aluminium Company Ltd (NATIONALUM) closed today at ₹213.87. The stock rallied strongly, rising nearly 5% during the session and trading in a range between ₹204.20 and ₹215.40. Today’s large volume signals solid investor participation and bullish momentum, while the price sits near the upper end of the daily band.
Technically, NATIONALUM remains in a clear short-term uptrend, outperforming its sector with recent moving average crossovers strengthening the bullish case. The key support is now located near ₹204, which was today’s low, and resistance lies at ₹224—the stock’s upper circuit limit. Momentum indicators are in positive territory, reflecting strong buying interest, but short-term traders should be aware that overbought readings could invite some consolidation or profit booking.
On the fundamental side, the company’s financials show robust quarterly revenue and profit growth, with strong operating margins and minimal debt. As a major aluminum producer, NATIONALUM benefits from stable commodity prices and high export demand. Overall sentiment is upbeat, suggesting potential for further gains if market conditions remain supportive and the company sustains its operational efficiency.

360ONE – Strong Resistance Above, Support Still HoldingIn this chart, price has tried multiple times to move above the same upper zone, but each time it failed to sustain there. After these attempts, price came down sharply with large gap-down moves. This clearly shows strong selling pressure and supply at that level.
On the downside, price is still respecting the rising support line. Whenever price moves lower, buyers are stepping in near this support and pushing it back up. So currently, price is trapped between strong resistance above and rising support below.
This puts the stock in a decision phase. Strength will be confirmed only if price is able to move above the resistance and hold there. Until that happens, caution is needed.
This is also a good example of why one should avoid blindly buying near resistance. It is important to understand the price action and the situation on the chart, rather than taking impulsive decisions. Reading how price behaves at key levels always gives better clarity.
I share only selective charts. The focus is on understanding price behaviour, not blind entries. Quality over quantity.

Unlocking Market Insights through Volume AnalysisTrading in financial markets is often considered both an art and a science. Among the various analytical tools traders use, volume analysis stands out as a crucial method for understanding market behavior, predicting price movements, and making informed trading decisions. Volume refers to the total number of shares, contracts, or units of an asset traded during a specific time frame. By combining price action with volume, traders can gain insights that are often invisible through price analysis alone.
Understanding Volume in Trading
Volume is essentially a measure of market activity. High trading volume indicates strong participation and interest in a particular security, whereas low volume suggests weak participation. Importantly, volume is not just a number; it reflects the strength or weakness of price movements.
High volume with rising prices typically indicates strong buying interest and can signal the continuation of an upward trend.
High volume with falling prices often signals panic selling or strong bearish sentiment.
Low volume with rising or falling prices may indicate weak conviction, suggesting that the trend may not be sustainable.
Volume analysis is used by both short-term traders, such as day traders and swing traders, and long-term investors. Understanding how to read volume can improve entry and exit timing, risk management, and the identification of market trends.
The Role of Volume in Technical Analysis
Technical analysts use volume to confirm chart patterns, trend reversals, and breakouts. Some of the key methods include:
Volume Confirmation of Trends
A strong trend is often accompanied by increasing volume. For instance, in an uptrend, volume should increase as prices move higher and decrease during minor pullbacks. Conversely, in a downtrend, volume tends to rise on declines and shrink during temporary rallies. This confirms the trend’s legitimacy.
Volume and Breakouts
Breakouts are more reliable when accompanied by a significant increase in volume. If a stock breaks a resistance level on low volume, it could indicate a false breakout. Traders often wait for a spike in volume to confirm the move before entering a position.
Volume Oscillators and Indicators
Several technical indicators help analyze volume, including the On-Balance Volume (OBV), Chaikin Money Flow (CMF), and Volume Weighted Average Price (VWAP). These tools combine price and volume to provide insights about buying and selling pressure.
Volume in Reversal Patterns
Volume plays a key role in identifying reversals. For example, in a double-top pattern, the volume often declines on the second peak, signaling weakening bullish momentum. Similarly, in a head-and-shoulders pattern, rising volume on the breakout confirms the reversal.
Practical Applications of Volume Trading
Volume analysis is not just theoretical; it has practical implications in real trading:
Identifying Institutional Activity: Large institutions, such as mutual funds and hedge funds, leave traces in volume patterns. Sudden spikes in volume without significant news often indicate institutional buying or selling. Retail traders can use this information to anticipate larger market moves.
Improving Entry and Exit Points: Traders can use volume to fine-tune their entry and exit points. Entering trades on low-volume pullbacks in an uptrend reduces risk, while exiting when volume indicates trend exhaustion can protect profits.
Detecting Market Sentiment: Volume reflects market psychology. Rising volume on up moves indicates confidence and optimism, while increasing volume on down moves reflects fear and panic. Traders can gauge sentiment and adjust strategies accordingly.
Supporting Risk Management: Volume can help traders validate stop-loss levels. For example, if a price breaches a support level on high volume, it is more likely a genuine breakdown than a low-volume spike, guiding traders to exit positions promptly.
Volume in Different Market Conditions
Volume analysis can vary depending on market conditions:
Trending Markets: Volume helps confirm the strength of a trend. Traders look for volume expansion during trend continuation and contraction during consolidation periods.
Range-Bound Markets: In sideways markets, volume analysis can identify accumulation (buying) and distribution (selling). A sudden surge in volume at a support or resistance level can hint at a future breakout.
Volatile Markets: During high volatility, volume spikes are common. Traders need to differentiate between normal high-volume fluctuations and significant market moves by considering context and historical volume levels.
Advanced Volume Techniques
Professional traders often combine volume with other tools for a deeper analysis:
Volume Price Trend (VPT): This technique combines price changes with volume to evaluate the strength of a trend.
Volume Spread Analysis (VSA): VSA examines the relationship between volume, price spread, and closing price to detect accumulation or distribution by smart money.
Volume Profiles: These provide a graphical representation of traded volume at different price levels, helping traders identify key support and resistance zones.
Challenges in Trading with Volume
While volume is a powerful tool, it is not foolproof:
Delayed Data: Volume analysis works best with up-to-date and accurate data. Delays in reporting can mislead traders.
Market Manipulation: In some markets, volume can be artificially inflated through wash trades or spoofing, potentially giving false signals.
Context Matters: Volume should always be analyzed in conjunction with price action, market news, and broader economic factors.
Conclusion
Trading with volume is a cornerstone of market analysis. By understanding the relationship between price and volume, traders can gain deeper insights into market dynamics, identify trends, anticipate reversals, and manage risk more effectively. Volume analysis provides a window into market sentiment, revealing the actions of major players and helping traders align their strategies accordingly. While it requires careful observation and practice, mastering volume trading can significantly improve both the accuracy and confidence of trading decisions. For any trader seeking to combine technical analysis with practical market intelligence, volume is an indispensable tool that illuminates the hidden currents beneath price movements.

UPL Trend Is Clear, Now Waiting for ConfirmationUPL has been moving inside a clear rising channel for a long time. Each time price comes near the lower line, buyers step in. Each time price reaches the upper line, some profit booking appears. This behaviour has repeated again and again, showing that the trend is healthy and well controlled.
Recently, price moved close to the upper part of the channel and then started moving sideways. Instead of falling back sharply, it is holding near resistance. This tells us that sellers are not strong enough to push price down, and buyers are still active.
Right now, price is moving in a small tight range near the top of the channel. This phase is important. A strong move usually comes after such tight consolidation, but the direction becomes clear only after a proper breakout and hold.
So instead of guessing, the better approach here is to wait for clear breakout confirmation. Once price shows strength by moving out of this range and sustaining, the next move becomes easier to understand.
This chart is about reading behaviour, not predicting.
As long as the channel holds, the trend remains intact — patience is the key here.

Bank Nifty: Hanging Man Confirmed Despite Fed CutLast week, Bank Nifty printed a valid Hanging Man at the Wave (5) zone, signaling potential trend exhaustion near a key Fibonacci cluster. The setup was deliberately framed as a warning, with confirmation dependent on a close below the candle’s real body.
That condition has now been met.
This week delivered a weekly close below the Hanging Man’s real body , providing bearish confirmation per classical candlestick principles. Notably, this occurred despite supportive macro developments , including a Fed rate cut mid-week , which failed to revive upside momentum. Similar to the earlier RBI action, bullish news once again struggled to extend the rally.
This combination of technical confirmation and macro tailwinds failing to lift price reinforces the view that Wave (5) topping risk is now active . While the candlestick signal confirms reversal risk, the depth and structure of the corrective phase will be determined by how price evolves from here.
Link to last week’s analysis for full context:
Disclaimer:
This analysis is for educational purposes only and does not constitute investment advice. Please do your own research (DYOR) before making any trading decisions.

Pidilite Industries Contraction Inside a Rising StructurePidilite has been moving inside an upward channel for many months. The lower line has given support every time price came near it, and the upper line has acted as resistance.
In the last few candles, price again bounced from the support line, showing buyers are still active at that level. Now price is coming close to the point where both trendlines meet. Once price moves out of this tight zone, a bigger move can happen.
Follow for more clean structural charts and pattern-based studies.

ACC | On the Verge of a Breakdown? | Daily Chart | Bearish Bias
📉 Summary
ACC has been compressing into a descending structure, forming Lower Highs since 24 April 2025, while holding Equal Lows near ₹1770 since 03 March 2025.
Repeated tests (4+ times) of the same support zone have reduced its strength, hinting at a potential breakdown setup.
Price action suggests sellers are absorbing demand every time the stock revisits this level — a classic bearish continuation structure.
📌 Structure Breakdown
1. Lower Highs (24/04/2025 onward)
- Each rally has been weaker than the previous one - Shows sustained supply and lack of aggressive buyers.
2. Equal Lows at ₹1770 (03/03/2025 onward)
- Multiple tests → Support weakening.
Hammer-type candles here indicate buying attempts, not strength — repeated hammers near support often show demand exhaustion, not reversal.
3. No Recent Swing Lows
- Due to tight compression, reference swings are taken from the 2023 structure, which aligns well with projected breakdown targets.
📉 Trade View: Bearish (Daily Time Frame)
🔻 Breakdown Conditions (Mandatory)
Enter ONLY IF:
✔ Price closes below ₹1770
✔ Breakdown candle is a Thick Red Marubozu
✔ Volume is higher than the 20-day average
✔ Close is below support, not just an intraday wick violation
This ensures you avoid a fake breakdown and enter only on momentum.
🎯 Bearish Targets (Based on 2023 swing levels)
1️⃣ ₹1730 – Initial target
2️⃣ ₹1680 – Next demand zone
3️⃣ ₹1570 – Major swing support from 2023; final target
Targets align with earlier swing reaction zones where price historically paused or reversed.
🛑 Stop Loss
Stop Loss:
High of the Breakdown Candle
(not the previous swing high — too far, reduces R:R)
This keeps the trade logical, tight, and rule-based.
📉 Final Thoughts
- ACC is nearing a classic descending compression pattern.
A decisive break below ₹1770 could open a clean downside move toward the mentioned targets.
But no breakdown → no trade.
Wait for confirmation — momentum + volume + structure alignment.
📝 Disclaimer
This analysis is created purely for educational and informational purposes and reflects my personal view based on simple price-action rules.
It is NOT investment advice.
Please do your own research or consult a registered financial advisor before taking any trade.
Trading and investing in the stock market involve risk. Manage your position size and follow strict stop losses.
📢 Support the Idea
If you found this analysis helpful:
👍 Boost the idea
⭐ Follow me on TradingView for more price-action based setups
💬 Comment below and suggest any stock you want me to analyse next — I’ll pick the best requests for upcoming ideas!

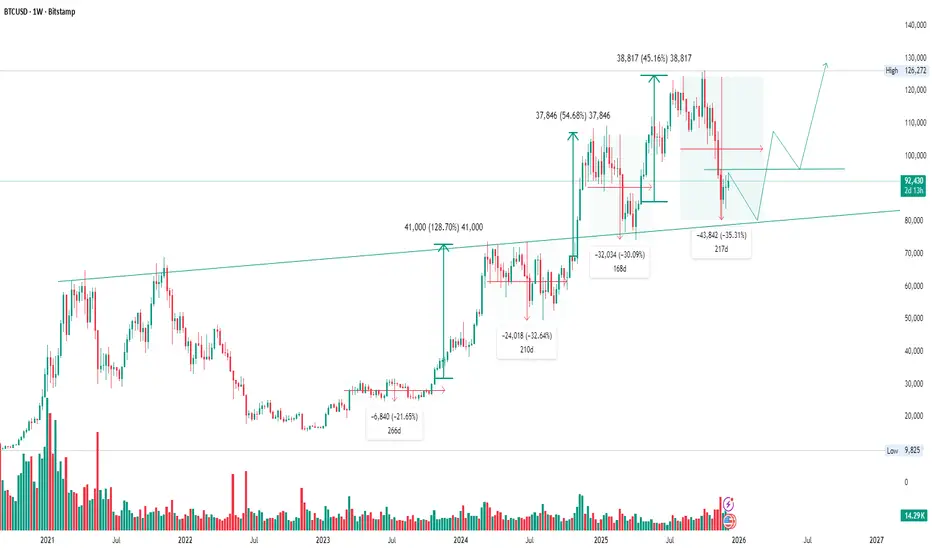
Bitcoin Weekly Structure Alternating Expansions and Deep CorrecThis chart highlights how Bitcoin has moved through a repeating long-term structure of strong expansions followed by deep corrective phases. Each major upward advance has been followed by a sizeable retracement, often returning toward or interacting with the long-term rising structure line. This rhythm of expansion and contraction has appeared multiple times across the chart and forms the basis of the broader market structure shown here.
The recent price behaviour continues to reflect this pattern. After a sharp expansion, price entered a broad corrective phase, marked on the chart. The two projected paths on the right are not forecasts but visual guides illustrating how price has interacted with this long-term structure during previous cycles. They show possible ways in which the asset may continue to develop, either by forming a base above the structure or by retesting it more directly before attempting a continuation. These paths reflect the historical behaviour visible on the weekly time frame.
Beyond technical structure, the broader market environment around Bitcoin has also evolved. Over recent years, several major institutional players — including global asset managers such as BlackRock and Fidelity, as well as insurance companies, pension funds, and research divisions within firms like JPMorgan — have begun integrating Bitcoin into regulated products, custody frameworks, or macro-level analysis. This does not imply a specific directional outcome, but it does indicate a shift in how the asset is evaluated within traditional financial systems.
As institutions increasingly reference Bitcoin in discussions of long-duration value, diversification frameworks, and digital hard assets, the narrative of Bitcoin as an emerging “digital store of value” has gained more recognition. This institutional perspective forms part of the long-term context within which the price structure continues to evolve.
This idea focuses on the multi-cycle behaviour of expansions and corrections, the repeated interaction with the rising structural line, and the gradual institutional shift that frames Bitcoin’s development as a maturing digital asset class.
Follow for more long-term structural charts, macro frameworks, and clean price-action studies.
Ultracemco shows a break above a falling structurePrice has been moving inside a downward sloping structure for several weeks, with multiple reactions on both the upper line and the lower line. Each touch on the upper boundary has created a lower high, and the lower boundary has been respected several times as well.
Recently, price moved down to the lower boundary once again and formed a strong upward candle from that area. This upward move has now pushed price above the upper line of the falling structure. The move is supported by higher volume compared to the previous sessions.
This shift may indicate that the downward pressure inside the channel is reducing. If price is able to hold above this region, it may suggest that the next phase of the trend is developing.
This idea is based only on the repeated reactions inside the structure and the recent break above it.
Follow for more clean charts and structured analysis.

Glenmark Pharma shows a strong uptrend with periodic correctionsGlenmark Pharma has been moving in a clear weekly uptrend where each strong rise has been followed by a period of consolidation before the next move. This sequence appears three times on the chart, marked as rally and correction phases.
After the most recent rise, price has entered a narrow downward channel. This forms a flag structure, which is a common type of consolidation during an ongoing trend. Volume has reduced during this period, which is normal in this kind of structure.
A break above the upper boundary of this channel may indicate that the consolidation is ending and that the trend is ready to continue. The measured distance of the previous rise has been added on the chart to show a possible future level if the trend resumes.
This idea is based entirely on the repeating structure of rally, pause and continuation that is visible on the weekly time frame.
Follow for more clean charts and structured price action studies.

MANAPPURAM Triangle and Inverse HNS CombinationPrice is moving inside a large converging triangle, with multiple clean touches on both the falling upper trendline and the rising lower trendline.
Inside this triangle, price has also formed a series of inverse Head & Shoulder (IHNS) structures, each time bouncing from the rising support trendline. These repeated IHNS formations indicate buyers are defending the trendline strongly.
This creates a combination pattern:
Macro pattern: Symmetrical Triangle
Micro pattern: Multiple IHNS formations inside the triangle
Price is now once again approaching the upper trendline.

BLACKBUCK Falling Wedge Breakout LoadingThe stock is now moving toward the upper trendline, which has acted as resistance multiple times. If price closes above this line, it confirms a bullish breakout.
If the wedge breaks out, the first logical target is the previous swing high, which aligns perfectly with the measured move projection of the wedge.

Volume Profile and Market Analysis: A Comprehensive Guide1. Introduction to Volume Profile
Volume Profile is a graphical representation that shows the amount of trading volume that occurred at specific price levels over a given period. Unlike standard volume indicators that display total volume per time period (bars or candles), Volume Profile organizes volume price-wise, highlighting where trading activity has been concentrated.
Key elements of a Volume Profile include:
Point of Control (POC): The price level with the highest traded volume, representing an area of significant interest or consensus between buyers and sellers.
Value Area (VA): The price range where a significant portion of total volume (usually 70%) occurs. This area helps identify fair value for the asset.
High Volume Nodes (HVN): Price zones with high trading activity, often acting as strong support or resistance.
Low Volume Nodes (LVN): Price zones with low trading activity, indicating potential breakout or rejection areas.
By focusing on volume at price rather than volume over time, traders gain a clearer understanding of market sentiment, institutional activity, and potential future price behavior.
2. Importance of Volume Profile in Market Analysis
Volume Profile provides structural clarity that other indicators often miss:
Identifying Key Levels: Volume Profile highlights areas where the market participants have shown the highest interest, forming natural support and resistance zones.
Understanding Market Sentiment: A market trading above its Value Area suggests bullish sentiment, while trading below indicates bearish sentiment.
Spotting Imbalances: Low-volume areas often indicate price rejection or gaps in trading activity, suggesting potential areas for rapid price movement.
Assisting Risk Management: Traders can better define stop-loss and take-profit levels based on high-volume nodes, minimizing the risk of being stopped out by normal market fluctuations.
In essence, Volume Profile provides a macro-level view of price acceptance and rejection, enabling traders to anticipate market behavior with higher precision.
3. How Volume Profile Works
To understand the workings of Volume Profile, consider a market like the Nifty 50 or a stock like Reliance.
Step 1 – Data Collection: Volume Profile uses tick-by-tick or minute-by-minute data to calculate total volume at each price level.
Step 2 – Constructing the Profile: For each price level, the cumulative volume is plotted horizontally. This forms a histogram-like structure over the price axis.
Step 3 – Analyzing the Profile: Traders analyze the histogram to find the POC, HVNs, LVNs, and Value Area. The shape of the profile often reveals market sentiment:
D-Shaped Profile: Indicates a balanced market with equilibrium between buyers and sellers. Price tends to oscillate within the Value Area.
P-Shaped Profile: Suggests strong bullish activity with absorption at lower levels and buying pressure pushing prices higher.
b-Shaped Profile: Reflects bearish sentiment, where sellers dominate and price struggles to move higher.
Understanding these shapes allows traders to anticipate whether the market is likely to trend or remain range-bound.
4. Volume Profile in Conjunction with Market Analysis
Market analysis is broadly divided into technical analysis, fundamental analysis, and sentiment analysis. Volume Profile complements all three.
a. Technical Analysis
Volume Profile enhances traditional technical tools like support/resistance, trendlines, and candlestick patterns by adding the dimension of trading activity concentration.
For example, a resistance level confirmed by a high-volume node is significantly stronger than one identified by price action alone.
Traders can also combine Volume Profile with moving averages or RSI to refine entry and exit points.
b. Fundamental Analysis
While fundamentals like earnings, macroeconomic data, or geopolitical events drive long-term price trends, Volume Profile helps gauge the short-term reaction of market participants.
For instance, if positive earnings lead to a price spike but Volume Profile shows rejection at higher levels (low-volume node), traders might anticipate a pullback.
c. Sentiment Analysis
Volume Profile captures the footprints of institutional trading.
Large participants often accumulate or distribute positions at specific price levels, which appear as high-volume nodes.
Observing these nodes provides clues about market psychology and potential directional bias.
5. Practical Applications of Volume Profile
Support and Resistance Identification:
Traders use high-volume nodes as natural support/resistance levels. Breakouts above or below these nodes are considered significant.
Trend Confirmation and Reversals:
If the price stays above the POC and Value Area, the trend is bullish.
If it drops below, the market may be entering a bearish phase.
Entry and Exit Strategies:
Volume Profile allows precise placement of entries and exits. Buying near LVNs or selling at HVNs can enhance reward-to-risk ratios.
Scalping and Intraday Trading:
Intraday traders use Volume Profile to identify areas of liquidity and price acceptance, helping in quick decision-making for short-term trades.
Gap Analysis:
Low-volume areas act as potential “gaps” where price can move rapidly, enabling traders to exploit breakout opportunities.
6. Limitations of Volume Profile
While powerful, Volume Profile is not without limitations:
Requires Accurate Data: Tick-level or high-resolution volume data is essential for precision.
Doesn’t Predict Market Direction: Volume Profile shows areas of interest but cannot guarantee future movement.
Works Best in Liquid Markets: Illiquid assets may produce misleading volume distributions.
Needs Contextual Analysis: Relying solely on Volume Profile without trend, news, or sentiment analysis can lead to poor decisions.
7. Combining Volume Profile with Other Analysis Tools
To maximize its potential, Volume Profile should be used with complementary tools:
Moving Averages: To confirm trend direction relative to high-volume nodes.
Candlestick Patterns: To validate reversals or breakouts at key levels.
Fibonacci Retracements: To identify confluences between retracement levels and high-volume zones.
Order Flow Analysis: To track live buying/selling pressure in relation to Volume Profile levels.
By integrating these tools, traders achieve a multi-dimensional understanding of market structure, enhancing both timing and accuracy of trades.
8. Conclusion
Volume Profile is a critical tool in modern market analysis, bridging the gap between price action and volume dynamics. By highlighting areas where market participants have concentrated their activity, it provides actionable insights into support, resistance, trend strength, and potential breakout zones. When combined with technical, fundamental, and sentiment analysis, it empowers traders to make informed decisions with a structured approach to risk and reward.
Ultimately, mastering Volume Profile requires practice and observation, but once understood, it becomes a powerful lens for seeing the market’s inner workings, allowing traders to anticipate movements rather than react to them. Whether for intraday scalping, swing trading, or long-term investing, Volume Profile remains a cornerstone for serious market participants aiming for consistency and precision in their trading strategies.
SYNGENE A Clean Reversal Structure DevelopingThe stock has been holding a strong support zone near the 600 level again and again. This tells us buyers are quietly defending this area.
Syngene is trying to break out after months of pressure. If buyers push a little more, the stock can easily travel toward the 670+ zone.
This is why this setup is interesting

BANKNIFTY Key Intraday Breakout Level in FocusBankNifty is currently trading just below an important intraday resistance zone around Fifty nine thousand four hundred forty to Fifty nine thousand four hundred sixty.
This level has acted as a supply barrier multiple times, and price is now attempting to reclaim it with improving volume.

M&M Update Price Trading Inside a Contracting WedgeMahindra and Mahindra is currently respecting both the upper and lower boundaries of a contracting wedge pattern on the one hour timeframe.
Each time price approaches the upper trendline, it is being rejected. Each touch on the lower trendline is showing signs of support and buyers stepping in.
This compression shows that the market is preparing for a larger directional move.
A clean breakout above the upper trendline with increasing volume can trigger a short term upward move.
Failure to break out may push the price back towards the lower support zone.

CENTURYPLY Big Structure Breakout After MonthsThe stock was trading inside a large symmetrical triangle
Multiple touchpoints on both trendlines , structure is valid
Price was getting squeezed between
A falling resistance line from the left
A rising demand line from the bottom
This compression created stored energy in the chart
Now, CenturyPly has broken above the falling trendline with strong bullish candles and volume backing the move. This is the first clean breakout after months of consolidation.

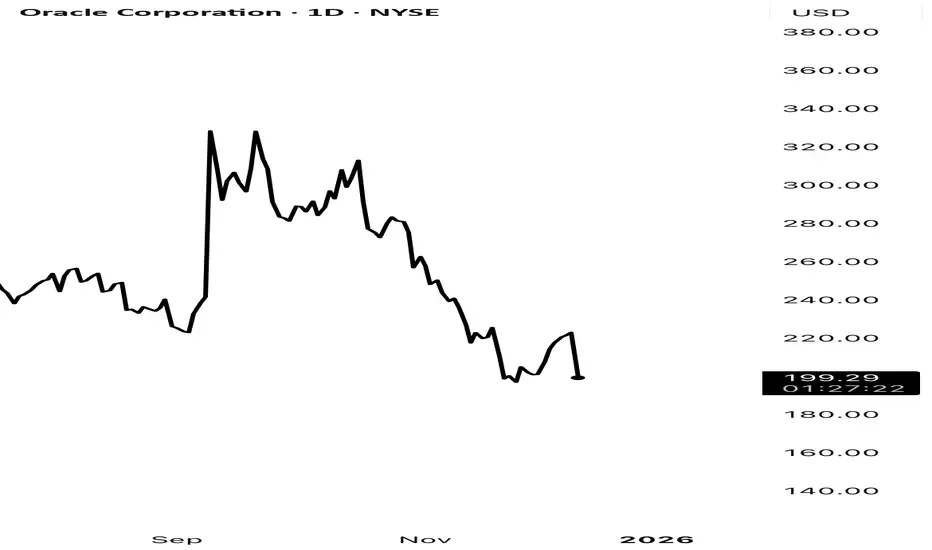
Oracle and the Quiet Warning Nobody Looked AtMost of us watch the stock first and everything else later.
But with Oracle, the first warning didn’t come from the chart at all — it came from the credit market.
A quick explanation for anyone new to this:
A Credit Default Swap (CDS) is just insurance on a company’s debt.
If people feel the company is getting riskier, the cost of that insurance goes up.
That’s it. Nothing fancy.
Over the last year, Oracle’s CDS cost has been climbing way faster than you’d expect for a big, steady name. It wasn’t front-page news, but it was unusual enough to pay attention to.
And then today’s 11% drop happened.
It honestly reminded me of that moment in The Big Short when Burry kept pointing at the CDS market while everyone else stared at the stock prices. He wasn’t predicting a disaster — he just noticed that the credit market was reacting long before the stock market cared.
Oracle isn’t a “Big Short” situation, obviously.
But the pattern is familiar: credit markets usually move first, stocks catch up later .
That’s really all there is to it.
No drama — just a quiet signal finally showing up on the chart.
Disclaimer: Educational only. Not investment advice. DYOR
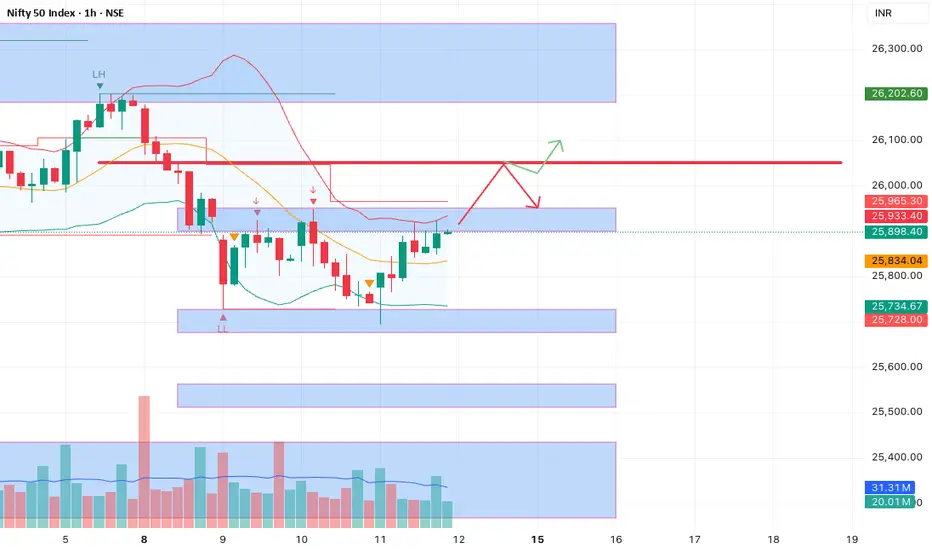
Nifty 12th Dec OutlookThe last 3 sessions have been strangely quiet. Price barely moved, volume stayed flat, and Nifty just kept hovering inside the same range.
At first glance it looks like typical consolidation…but with everything happening around us, the silence feels a bit more intentional.
Here’s what I’m noticing:
1. Fed cut was priced in, but the market is still digesting the tone
The 25 bps cut wasn’t a surprise. What traders really care about is the Fed’s tone, and that usually takes a day or two to reflect in EM flows like ours. So the muted move here makes sense.
2. Sensex expiry completely distorted intraday behaviour
No one commits serious money on expiry days unless they have to. That explains some of the weird intraday swings and the lack of strong follow-through.
3. The US trade delegation being in India (Dec 10–12) is a bigger factor than people think
Institutions hate uncertainty. If the tone from these meetings affects tariffs, regulations, or market access, it directly impacts exporters and several index-heavy sectors.
So, yes — some funds simply stepped aside until they know what’s happening.
4. Mexico’s unexpected tariff hike (up to 50%) adds another layer
This came out of the blue and hits Indian auto exporters right where it hurts. But… even with that news, Nifty didn’t react violently. That tells me the market is waiting for more clarity, not panicking.
Technical Picture (Daily + 1H): Nothing Broken, Nothing Proven
Price held the 25,700 support beautifully (Fib 0.618)
Price rejected the 25,940–26,050 zone again (Fib 0.382)
Daily RSI bounced from the 50 line, which is normally a bullish behaviour
Volume has been eerily identical for 3 days straight
This is not bullish strength.
This is not bearish weakness.
It’s textbook neutrality until the macro dust settles.
About the Divergences
On the Nifty 1H chart, we had a hidden bearish divergence earlier — but that only signals momentum fatigue, not an immediate fall.
But on GIFT Nifty, we got something more meaningful:
✔ Hidden bullish divergence
✔ Price made a higher low
✔ RSI made a lower low
✔ And then price pushed up strongly
This usually leads to trend continuation, and the futures chart looks clean and confident right now. Not the behaviour of a market preparing for a big dump.
So why is the volume dead?
When multiple moving parts converge — Fed tone, international trade talks, new tariff shocks — institutions don’t gamble.
They stay flat.
They hedge.
They wait.
And the charts show exactly that.
Tomorrow’s Map
If GIFT Nifty stays firm:
→ we likely open slightly green
→ Nifty may try to break the 25,940–26,050 zone
→ A clean close above 26,050 opens 26,120–26,180
If nothing major hits the news:
→ we stay stuck between 25,700 and 25,940
→ the range continues
If negative news comes from trade talks or auto exporters:
→ only then we revisit 25,700
→ and breakdown needs VOLUME, which has been missing
Without volume, bears have no teeth.
My Final Take
The market isn’t weak — it’s cautious.
It isn’t bullish — it’s waiting.
GIFT Nifty looks strong right now, and unless a fresh headline drops overnight, Nifty will likely test the higher end of the range again.
But the real move — the one with conviction — probably comes after Dec 12, once everyone knows where the trade talks and sector implications stand.
Until then, this is not a market to be overly aggressive in either direction.
Nifty formed base to move upward in 26000 trajectoryNifty has formed base today and ready to take everyone surprise by upmove. Expecting a consolidation around 26850 range and then upward move till 26970, consolidating around 26930 and leaping towards 26050+ range. Basically touching earlier support/resistance in previous moves.

The Day I Trusted My Setup - And Finally Found Peace in TradingHello Traders!
Every trader remembers the day they finally stopped fighting the market and started trusting their setup.
Not because the setup became perfect, but because the trader stopped panicking, stopped doubting, and stopped reacting emotionally to every candle.
This post is about that mindset shift.
The shift that quietly turns chaos into clarity.
1. The Problem Was Never the Strategy
Most traders have decent setups, but terrible self-control.
They enter early, exit early, or avoid taking the trade completely.
They blame indicators, brokers, markets, everything except their own fear.
The truth is simple:
Your setup doesn’t fail. Your belief in the setup fails first.
2. The Market Became Peaceful the Day My Mind Did
I stopped questioning every candle.
I stopped comparing my trades to others on social media.
I stopped jumping from one strategy to another.
When the mind becomes quiet, the market stops feeling like a threat.
3. One Setup, Repeated Consistently, Is More Powerful Than 10 Indicators
When you trust your setup, you stop looking for confirmation everywhere else.
Your eyes automatically see the same pattern repeat again and again.
You develop confidence, not from winning, but from understanding.
A trader doesn’t need more tools.
A trader needs one tool they fully trust.
4. Peace Comes From Acceptance, Not Prediction
You stop trying to predict the market.
You stop expecting every trade to win.
You start accepting that your job is execution, not perfection.
Peace is not when trades stop losing
Peace is when losses stop scaring you.
5. Trusting the Setup Automatically Improves Discipline
You follow your entry rules without hesitation.
You respect your stop loss without fighting it.
You let profits run because you no longer fear giving them back.
Discipline is the natural outcome of trust.
Rahul’s Tip:
Your setup doesn’t need to be extraordinary, it just needs to match your personality.
Once you stop jumping strategies and commit to one approach fully, trading becomes quieter, calmer, and finally peaceful.
Conclusion:
The day you trust your setup is the day trading stops feeling like a battle.
You stop chasing the market and start flowing with it.
With clarity, discipline, and trust, profitability becomes a byproduct, not a target.
If this post reflects your trading journey, like it, share your experience, and follow for more psychology-based insights!