PNBHOUSING – Clean Falling Channel Support Bounce SetupPNB Housing has been trading inside a perfect falling channel.
Price is respecting both the upper resistance and lower support exactly
Every time the stock touches the top line, it drops.
Every time it hits the bottom line, it bounces back up.
Price is back to the falling-channel support.
If buyers react again here, a short-term bounce can play out toward the upper channel.
Beyond Technical Analysis

VOLTAS – Support Touch Inside Rising Channel | Bounce SetupDescription
VOLTAS has been moving inside a rising channel for several months — creating higher highs and higher lows.
Both the top and bottom trendline's are respected multiple times (marked by circles), proving this channel is valid and strong.
Recently:
The stock fell from the top of the channel
Came down and touched the bottom support line again (blue circles at lows)
That support has always given a bounce previously
→ so buyers may step in again here
Also, a small falling channel has formed inside this bigger up-channel.
Price is now breaking out of that smaller falling channel, which hints at a possible bounce start.

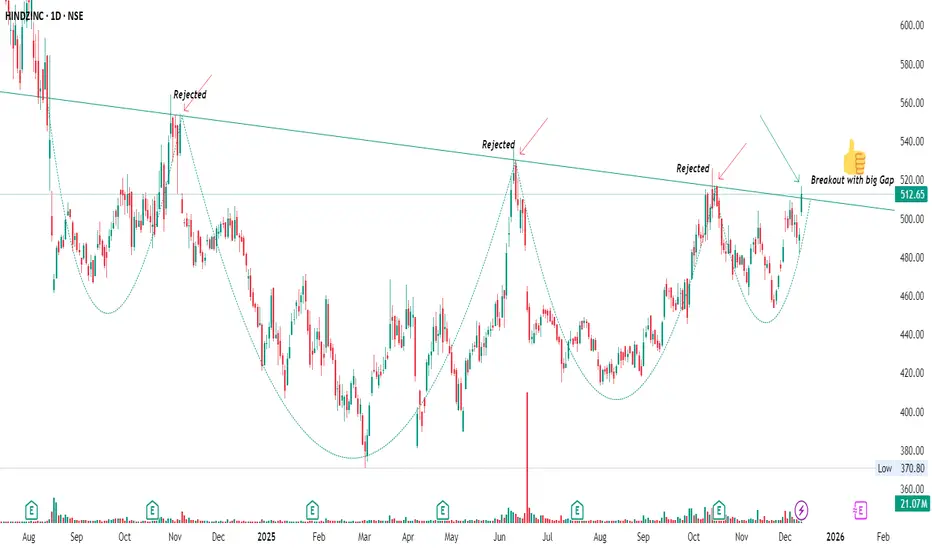
HINDZINC – Major Trendline Breakout with Gap-UpTF: Daily
Status: Fresh Breakout · High Volume · Momentum Building
Buyers have finally overpowered sellers
After 3 major rejections, HINDZINC has finally broken the trendline with a bullish gap-up.
BankNifty – Falling Wedge Breakout Attempt | Short-Term Upside iBankNifty is trading inside a falling wedge structure on the 15-minute timeframe — a pattern that often leads to sharp upside moves once price breaks above the upper trendline.

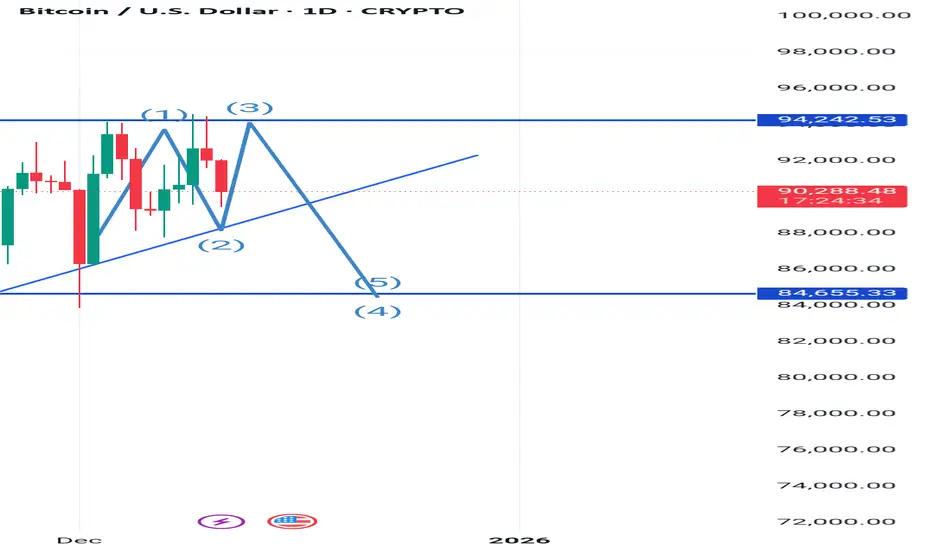
#BTC Showing a good down tredn move keep eye#BTC ON 1D
KEEP AN EYE BELOW 89350 WE CAN SEE BREAKDOWN AND GOOD SELLING MOVE TILL 87000....86000++
Here the logic
89350 is very big support its already tested many times so now its weak so we can see a good down trend move till 86000
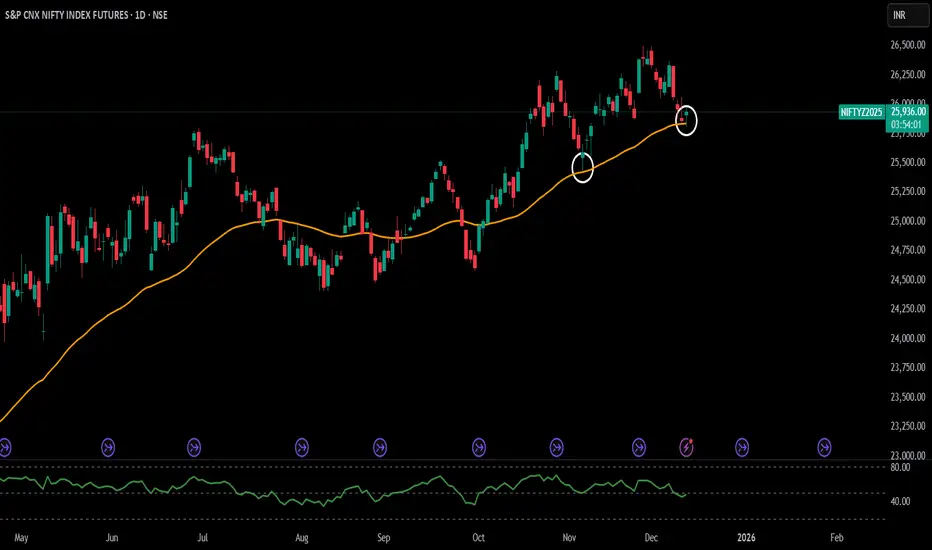
Nifty 50 SpotDate 11.12.2025
Nifty 50 Spot
Timeframe : Day Chart
(1) In the last one month, Nifty touched 50 Ema twice & took sharp bounce
(2) Thats the make or break for now
(3) Stoploss for longs & short intiate on breakdown
Regards,
Ankur
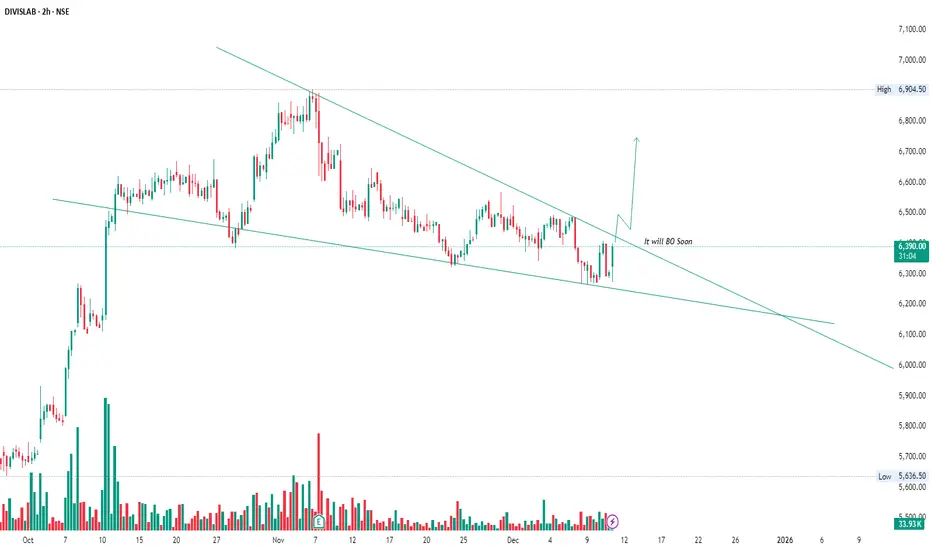
DIVISLAB – Tightening Inside a Falling Wedge | Breakout LoadingDIVISLAB is compressing beautifully inside a falling wedge, one of the strongest bullish reversal patterns.
Price has been making lower highs + higher lows, showing clear contraction. This usually means the stock is getting ready for a decisive move.
LOOKING FOR GOOD SETUP AND TIGHT RANGE NSE:JAMNAAUTO
It has repeatedly rejected resistance at ₹125 on the daily chart. A decisive breakout above ₹125 could trigger strong momentum. The weekly chart also shows bullish patterns, supporting potential swing and short-term gains. With an all-time high breakout likely soon, now's the time to watch closely.
now CMP is 121.80

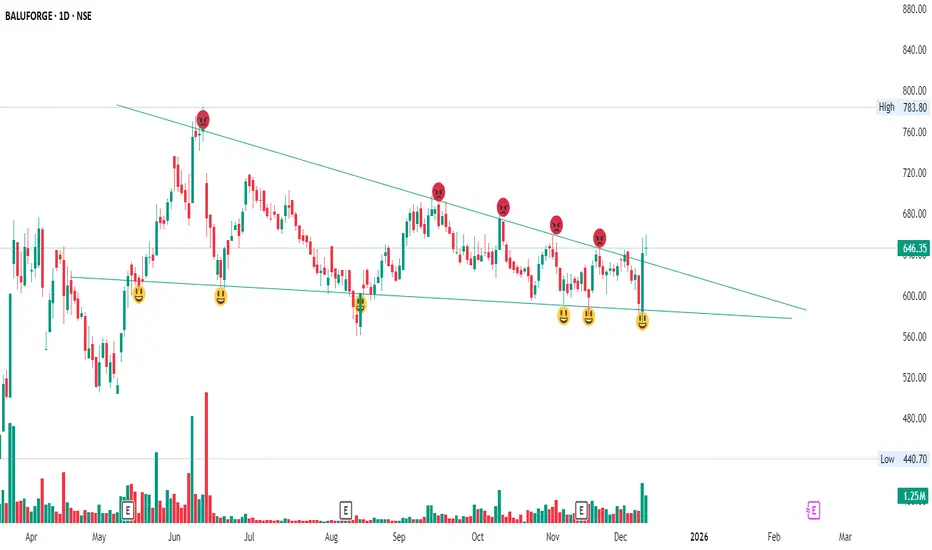
BALUFORGE – Falling Channel Reversal SetupTimeframe: Daily
Price has been moving in a falling channel for months
Every time it touched the upper trendline, sellers became aggressive 😡
Every time it hit the lower trendline, buyers stepped in with confidence 😊
A strong bullish reversal right at the support line — and volume exploded.
This is the first sign that buyers are gaining strength again.
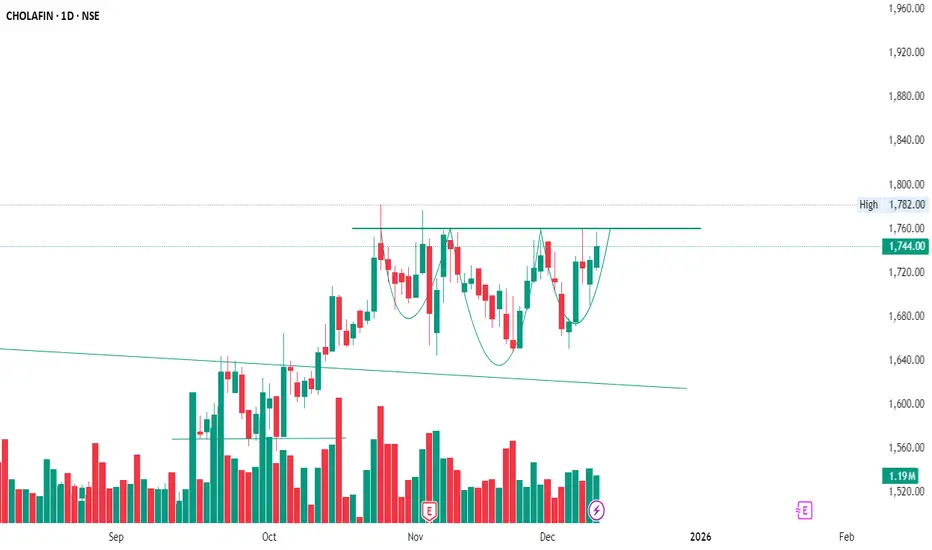
CHOLAFIN- IHNS Pattern ➝ Buyers are accumulating every dip
➝ Sellers are slowly losing control
There is a strong resistance around ₹1,775 – ₹1,785
Price has been rejected here multiple times
Each time, the pullback becomes shallower → buyers getting stronger
Breakout becomes more likely with time.
NZDUSD Short | 15m | Structural Breakdown After ExhaustionNZDUSD showed a clear loss of momentum after an extended upside leg. Price consolidated near the highs with diminishing impulsiveness, forming a distribution-style structure. The break back below the micro-range support confirmed weakness.
The short entry is based on:
• Rejection from the intraday premium zone
• Breakdown of the short-term support level
• Shift in orderflow as buyers failed to sustain higher pricing
Stop placed above the rejection block.
Primary target aligned with the liquidity pool near 0.5773.
This trade reflects a disciplined response to intraday exhaustion and a confirmed structure shift.

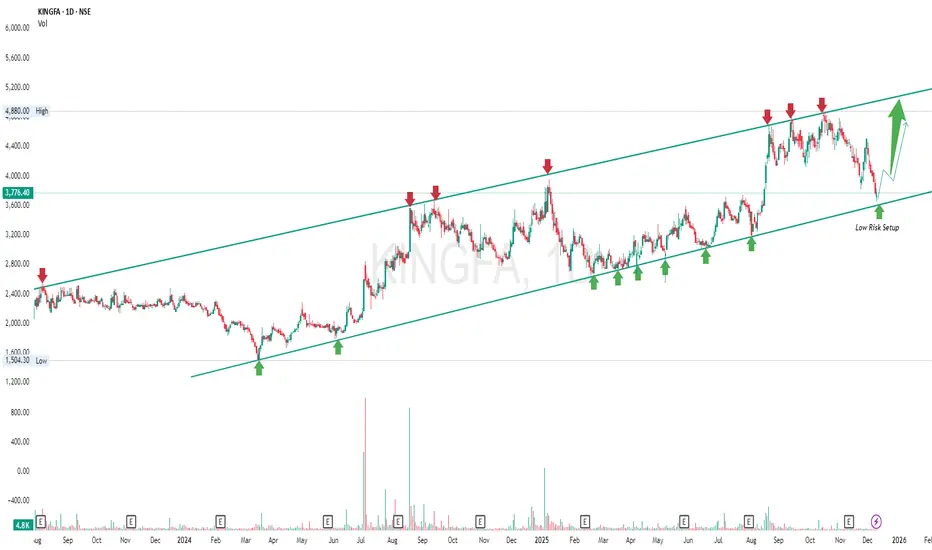
KINGFA – Low-Risk Swing Setup from Channel SupportKINGFA is moving in a well-defined rising channel — making higher highs and higher lows consistently.
Your chart clearly shows:
🔺 Red arrows → Price gets rejected from upper trendline
🟢 Green arrows → Price takes support from lower trendline
This confirms the channel structure is valid and respected for more than a year.
Now price has once again:
✔ Touched the bottom support line
✔ Buyers are reacting from the same zone
✔ Risk is very limited below this support
Because of this, it becomes a Low-Risk Swing Opportunity
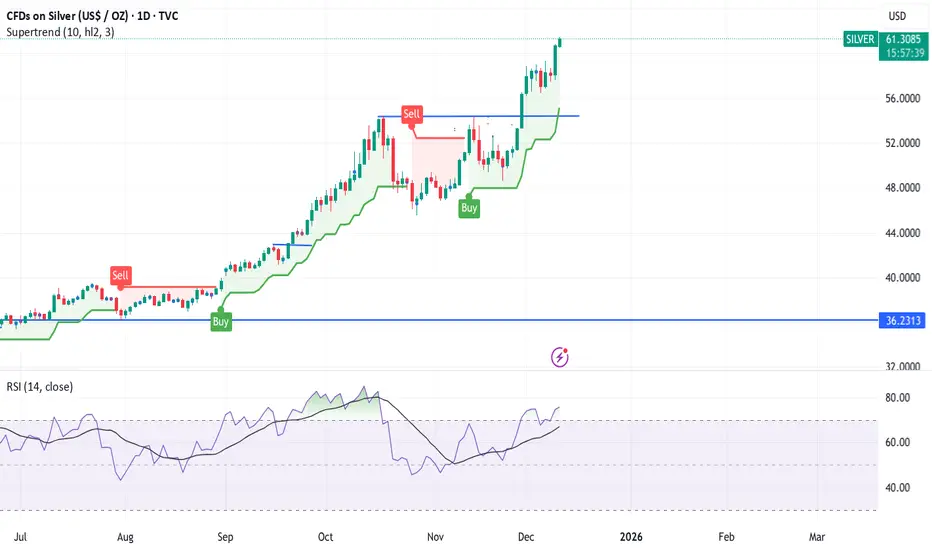
silver update after bulbs rally mcx or cme spotthere are some probability on chart which will briefly discuss.
Silver spot--- yesterday crossed or sweep all liquidity abv 59.40$ or made high 61$ almost ------ still as per gold silver ratio silver looking hot only abv 60-59.80$ up side tgt 62$ intact .or if sustain abv 63.55$ or close abv + weekly close than will see 67-72$ soon. Or if mkt take 63$ hurdle or revert than again down side expect 58$ near in mcx 193000 laxman rekha for silver if sustain abv or close than expect tgt 199-205000+++ no if and but---or if mkt fail to close or hold abv 193000 than down side door open through profit booking till 187-185000++++
“Nifty Zone-to-Zone Reactions | Excellent Supply–Demand PlaybookNifty is respecting the marked supply and demand zones with excellent precision.
Price is currently trading inside a mid-range demand zone, and each move has been reacting cleanly from zone to zone, providing high-probability intraday opportunities.
🔍 Key Observations
Price rejected strongly from the 25,960–25,980 supply zone, confirming seller control at the top.
A clean reaction was seen earlier from the 25,740–25,760 demand zone, establishing it as a strong intraday support.
The market is now consolidating between 25,840–25,900, forming a decision area for the next directional move.
📈 Bullish Setup (If demand holds)
A bounce from 25,840–25,860 demand zone can push price back toward
▸ 25,900 resistance
▸ 25,960 supply zone
Break + Retest above 25,900 will open the upside.
📉 Bearish Setup (If zone breaks)
Breakdown below 25,840 zone may trigger a fall toward
▸ 25,780 support
▸ 25,740 demand zone
🧭 Trade Plan
Buy only at demand, sell only at supply.
Avoid entries in the middle — let the chart come to the edges of the zones.
This structure is ideal for zone-to-zone scalping & intraday trades.

COALINDIA 1 Week Time Frame 📊 Key Context
Current price is ~ ₹379–380.
52‑week high/low: ~ ₹425–426 high, ~ ₹349–349.5 low.
Recent technical reports show a shift to a more “bearish/neutral” momentum—weekly MACD / moving‑average signals are negative.
🎯 Short‑Term (1‑Week) Levels to Watch
Level Role / Significance
₹374–376 Support zone — near recent intraday lows; a break below may
signal further downside.
₹370 Secondary support — close to the lower end of recent
consolidation; a strong bounce from here could attract buyers.
₹385–388 Near‑term resistance / range ceiling — in line with recent
intraday highs and short‑term moving averages.
₹390–392 Key resistance breakout zone — if price sustains above this,
short‑term bullish momentum may resume.
₹400 (round‑number mark) Psychological / tactical upside target — a breakout push toward
this will likely draw interest from swing traders.

Options Buying vs Options Selling – Pros & Cons1. Options Buying – Overview
Options buyers purchase Call or Put options by paying a premium. They have limited risk (up to the premium paid) and unlimited or large potential reward.
A call buyer expects price to go up, and a put buyer expects price to go down.
Key Idea:
You are paying premium for the right to buy or sell an asset, not the obligation.
Pros of Options Buying
1. Limited Risk – Maximum Loss = Paid Premium
The biggest advantage is that risk is predefined.
Even if the market goes completely against you, the most you lose is the premium.
This makes option buying beginner-friendly from a risk-management perspective.
2. Unlimited or Large Profit Potential
Call buyers earn huge when the market rallies.
Put buyers make large profits when the market crashes.
Since options expand rapidly during trending moves, buyers can earn multiples (2x, 5x, even 10x) during strong breakouts or breakdowns.
3. Small Capital Requirement
A few hundred or a few thousand rupees can control a position of lakhs due to leverage.
This makes options buying attractive for small retail traders.
4. Ideal for News, Events & High Momentum
Buyers benefit the most during:
Budget sessions
Election results
RBI policy
Company results
Sudden large breakouts/breakdowns
Volatility increases premiums, which favors buyers in fast-moving markets.
Cons of Options Buying
1. Low Probability of Profit (Because of Time Decay)
Option premiums naturally decrease due to Theta decay.
You need the market to move:
Fast
Far
In your direction
Otherwise, premium collapses. Many buyers lose because the market only moves slightly, not enough to overcome time decay.
2. You Fight Against the Odds
Options are priced based on implied volatility, demand, and probability.
Sellers have statistical advantage because:
70% of options expire worthless
Time decay always works against buyers
Thus buyers have low chances of success unless they are skilled.
3. Volatility Crush
After major events, volatility drops sharply, reducing premium even if price moves in your direction.
Example:
After results or big news, IV crash eats away the premium.
4. Emotional Stress
Fast-moving premiums lead to:
Panic entries
Emotional exits
Overtrading
Fear of missing out
Options buying requires strong discipline and strict stop-losses.
2. Options Selling – Overview
Options sellers (also known as writers) sell calls or puts and receive a premium income.
They have:
High probability of profit
Steady income potential
But high or unlimited risk if unmanaged
Sellers rely on probability and time decay.
Key Idea:
Selling is similar to becoming an insurance company—high chance of small profits with low chance of large loss.
Pros of Options Selling
1. High Probability Trades
Most sellers target:
60–75% win probability per trade
Small but consistent profits
Time decay working in their favor
Even if the market moves slightly, sellers still win because premium loses value.
2. Time Decay Works in Your Favor
Theta (time decay) accelerates closer to expiry.
Sellers earn money simply because time is passing.
Especially effective:
Weekly expiry
Monthly expiry
Sideways markets
3. Stable, Consistent Income Strategy
Many professional traders, funds, and institutions follow options selling because it provides:
Regular income
Lower volatility in returns
Statistical edges
Covered calls, cash-secured puts, iron condors, credit spreads are all based on selling.
4. Volatility Crush is Beneficial
Events such as results, election outcomes, or data releases cause IV to drop afterward.
This makes premiums collapse, giving sellers quick profits.
5. Works Well in Sideways Markets
70% of the time, markets trade sideways.
Buyers struggle here, but sellers thrive because price stays within their profitable range.
Cons of Options Selling
1. High or Unlimited Loss Risk
Call sellers face unlimited risk if price moves upward violently.
Put sellers face huge risk if the market crashes.
This is why sellers must:
Trade with high capital
Use strict risk management
Often hedge positions
2. High Margin Requirement
Unlike buyers, sellers need large capital.
For index options like NIFTY or BANKNIFTY, margin can be:
₹1–2 lakh for naked selling
₹20k–50k for hedged spreads
Many retail traders cannot maintain these requirements.
3. Large Losses Come Suddenly
Sellers often make small profits for days but can lose months of gains in a single sudden market move.
For example:
War news
RBI policy surprise
Budget shock
Global crash
Overnight gap-ups or gap-downs
These events can cause heavy losses.
4. Requires Strong Discipline
Sellers must:
Hedge
Adjust positions
Cut loss quickly
Avoid greed
Avoid selling naked options
This makes selling more suitable for experienced traders.
3. Which is Better – Buying or Selling?
There is no fixed answer.
It depends on market conditions, trader skill, and psychology.
When to Prefer Options Buying
When expecting strong directional movement
During breakouts/breakdowns
During high momentum days
Before events with expected big moves
For small capital traders
Buyers should enter only in trending markets.
When to Prefer Options Selling
When markets are sideways
When volatility is high and expected to fall
For consistent income strategies
For experienced traders with good risk management
When trading weekly options
Sellers profit without needing large price movements.
4. Summary Table – Options Buying vs Selling
Feature Options Buying Options Selling
Risk Limited High/Unlimited
Reward Unlimited Limited
Capital Required Low High
Probability of Profit Low High
Fights Time Decay? Yes No
Benefits from IV? Increasing IV Decreasing IV
Best Market Trending Sideways
Skill Level Needed Medium High
Ideal For Small traders Professional traders
5. Final Thoughts
Both options buying and selling have their own place in a trader’s toolkit.
Buyers enjoy big rewards but face low probability trades due to time decay.
Sellers enjoy high probability setups but face the risk of large losses if the market moves violently.
Most successful traders eventually learn to combine both buying and selling through:
Spreads
Straddles
Strangles
Covered calls
Iron condors
Hedged strategies
Understanding the strengths and weaknesses of each approach helps traders manage risk and build consistent long-term profitability.

BRITANNIA — Compression Breakout Loading!Britannia has been squeezing between:
🔹 Downward resistance trendline
🔸 Flat rising demand zone
Every time price tapped the bottom support → buyers stepped in
11+ rejections from support → demand is very strong here ✔️
This creates pressure for a breakout on the upside soon 🚀

Price action series-The 2B Pattern Failed Breakout Reversal...Continuing the price action series with a pattern that appears at every major turning point in the market: the 2B Pattern, also known as the failed breakout reversal.
It forms when price breaks a previous high or low but fails to follow through and immediately returns back inside the prior range. This shift reveals exhaustion in the prevailing trend and exposes trapped traders on the wrong side.
Below are two real examples from Gold and dxy showing both the bullish and bearish version of the pattern.
Bullish 2B Pattern – Bottom Formation Left Chart
A 2B bottom occurs when price breaks below a previous swing low but cannot sustain the breakdown.
In the chart on the left:
Price takes out the prior low, triggering new short positions and stop-losses.
The breakdown immediately fails as price snaps back above that previous low.
This reclaim signals that the downward continuation attempt has failed.
The shift in pressure initiates a new upward move, confirming the reversal.
This is a classic 2B bottom structure: a failed breakdown followed by a strong reclaim.
Bearish 2B Pattern – Top Formation Right Chart
A 2B top occurs when price breaks above a previous swing high but fails to extend higher.
In the chart on the right:
Price pushes through the earlier swing high, inviting breakout buying.
Momentum fades almost instantly, and price falls back below the prior high.
This failure indicates buyers have lost control and the breakout has trapped late entries.
Price then shifts downward, validating the failed breakout.
This is the mirror image of the 2B bottom, but occurring at a swing high.
Why the 2B Pattern Works
A trend remains intact as long as it continues to produce new highs or lows.
A failed attempt to continue the trend shows:
exhaustion in momentum
absorption of breakout orders
trapped traders exiting
the beginning of a directional shift
The 2B identifies this shift before the full trend reversal is completed, making it an early but reliable reversal model.
Where This Pattern Performs Best
15m and 1H for intraday reversals after volatility spikes
4H for swing-trade reversals and cleaner structure
Daily for major tops and bottoms
Around key levels such as previous highs, lows, or liquidity zones
The pattern is especially common in Gold due to its volatile but structured movement.
Summary
2B Bottom failed breakdown
2B Top failed breakout
Works by showing loss of continuation and a shift in order flow
Ideal for identifying early reversals without predicting tops or bottoms
Sharing this purely for educational purposes as part of the Price Action Pattern Series.
More patterns will be published in the next parts of this series. Trade safe

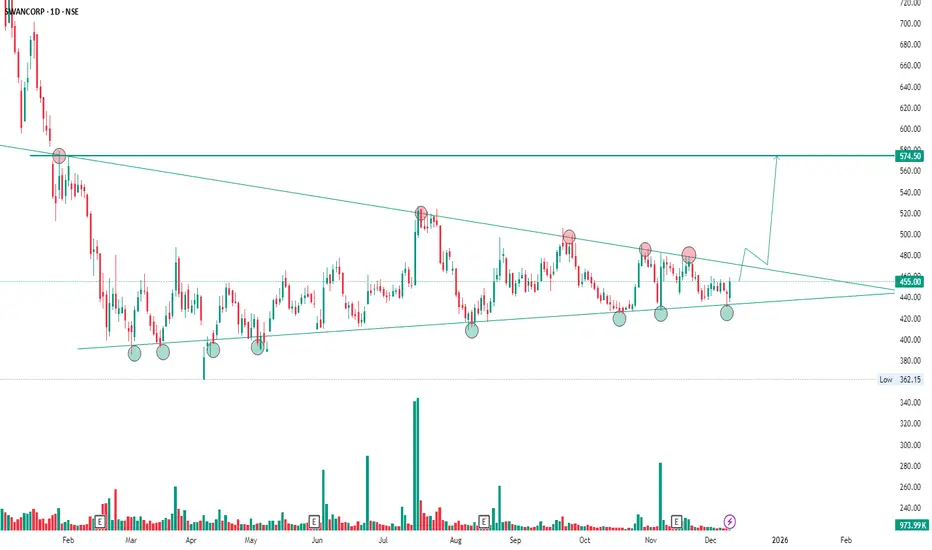
SWANCORP — Major Squeeze Ahead!Price at Low-Risk Buy Zone
The stock has been moving inside a falling wedge + rising support channel for months.
Every touch on the support line has triggered a strong upside reversal
→ Demand zone confirmed ✔️
Now price has taken yet another bounce from the same support trendline —
which means buyers are not letting price fall below this structure.
Meanwhile, the upper trendline is compressing price, creating a breakout pressure zone 🔥
JKLAKSHMI – Long-Term Trendline BounceTimeframe : Weekly
The stock has been trading inside a big rising channel since 2020.
Both support and resistance trendlines are perfectly respected
→ showing long-term trending behaviour 📈
Price recently retested the channel support once again, and buyers stepped in strongly from the same zone 👇
✔ Higher-low structure
✔ Strong reaction candle
✔ Clean trend continuation setup

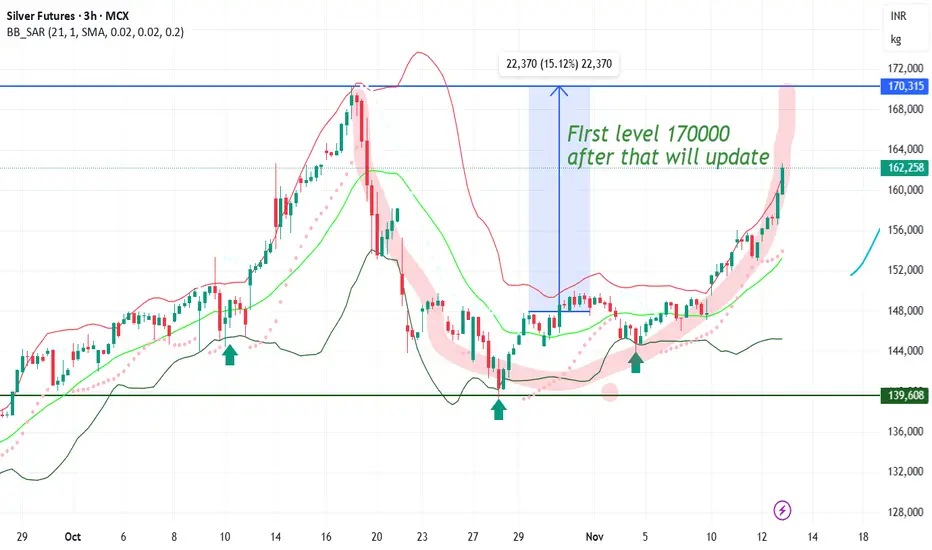
#SILVER FORMING NICE PATTERN #SILVER FORMING NICE PATTERN going to touch 170000 soon
formation like CUP and waiting for handle
after that 15% from high
Elaborative analysis on Nifty: 10/12/25Watch till the end, it will be a little lengthy in comparison to my earlier videos.
This video will cover not only levels of nifty to consider but also a few educational points.
If there is any query regarding any point, mention it in the comment, so I will try to make it in the next video.
Still, no clear trend for Nifty is evident, but be ready for either side of the trend.

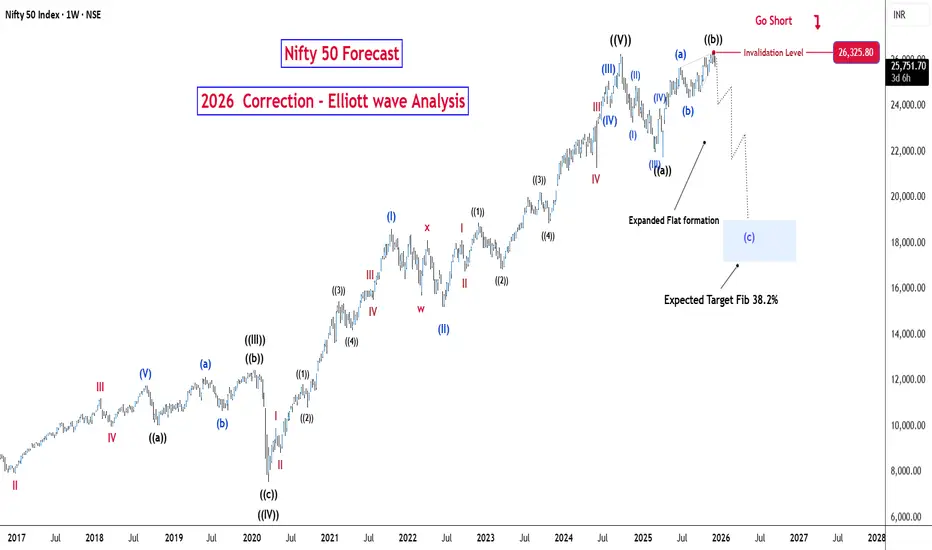
Nifty 50 - Elliott Wave Weekly Analysis (Updated)Nifty 50 Now in correction face of Grand super cycle . Already Wave A and B Completed. C wave starts now (forming Expanded / Irregular Flat) end up to Fib Retrace 38.2% so expected for correction in nifty 50 through Elliott wave theory so investors proper hedge your position or go short in FNO and big buying opportunity is coming soon...