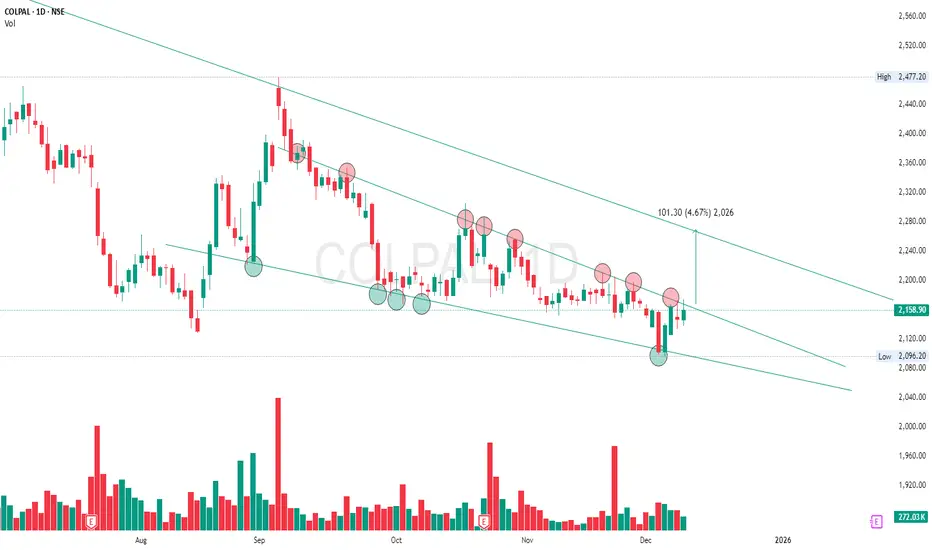
COLPAL – Falling Channel Support Reversal | 4.6% Upside RoomColgate (COLPAL) has been moving inside a falling channel for the past few months — creating lower highs and lower lows.
🔴 Red circles = Every time price hits the upper trendline, sellers push it down
🟢 Green circles = Every time price reaches the lower trendline, buyers step in
This confirms the channel is strong and valid.
Now the stock has:
Taken support again at the lower trendline
Formed a bullish reversal candle
Started moving upward from this support
Beyond Technical Analysis
natural gas crucial update after new high natural gas given corrective mode from high---now 2 scan possible here
1---ist buying range expect 432--415 as per chart structure looking good where can be again up side 452--470--490++ strong support looks 395@--390
2---- only if break 388 or close blw than trend change expect or chart structure will change or dwn side expect 370--355-335+++
over all dips on buy looks good way with support sl as per chart structure now let see coming days

PGEL – Rising Channel Support + Tweezer Bottom ReversalPGEL is currently trading inside a rising channel, creating higher lows and higher highs over time.
You have marked the bottom trendline touches (green arrows), showing that buyers have stepped in from this level again and again.
Recently, price dropped back to the same support area —
and printed a Tweezer Bottom candlestick pattern there.
This is a bullish reversal signal, especially when it appears at a known demand zone.

GODREJPROP – Strong Support Reaction | 10% Upside Bounce SetupGodrej Properties has been moving inside a large downward channel, but the stock has created a very strong demand zone at the bottom.
You can see:
Price touched this support level many times before
Every time, it bounced sharply
This shows big buyers are active at this price zone
Now again, the price has retested this same support and reacted upward.
This setup suggests the market may once again push the stock toward the falling trendline above.

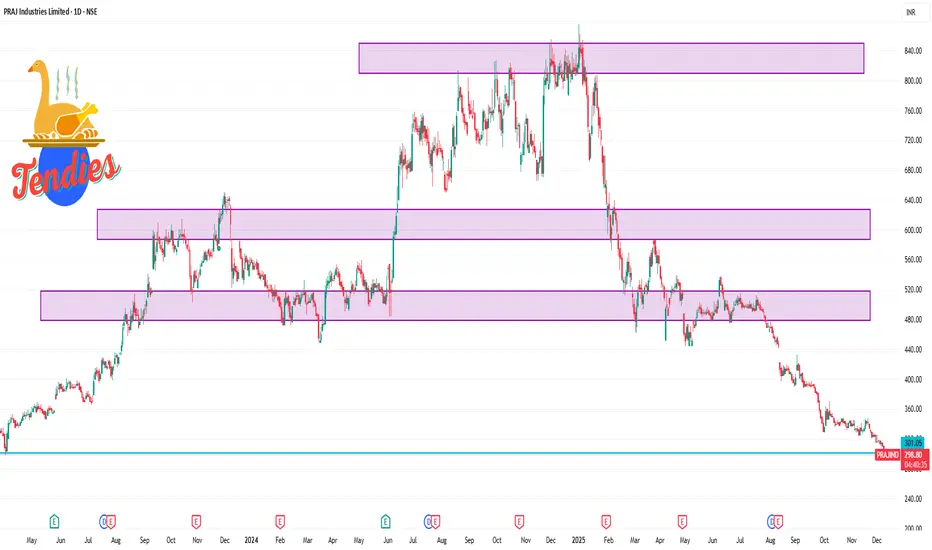
PRAJIND 1 Day Time Frame 📌 Current Live Price & Trend
✅ PRAJIND is trading around ₹300–₹302 on the NSE today (down ~2–3%).
✅ The stock recently hit a new 52-week low, showing a strong bearish trend and weakness.
Market Context (Short-Term Trend):
Price is trading below key moving averages (5D, 20D, 50D, etc.).
This suggests bearish pressure on the 1-day and short-term charts.
📊 1-Day Intraday Levels (Approximate)
🟥 Resistance (Upside Barriers):
R1: ~₹308 – initial resistance near short-term bounce area
R2: ~₹315 – psychological resistance zone
R3: ~₹322 – higher resistance from recent intra-week levels
🟩 Support (Downside Levels):
S1: ~₹297 – immediate intraday support
S2: ~₹290 – lower support from recent swing lows
S3: ~₹280 – significant downside support zone
BTC OUTLOOK TODAY🎯 KEY LEVELS TO WATCH
Supply Zones
92,200 – 92,800
94,000 – 94,800
Demand Zones
88,800
88,200 – 87,000
Liquidity Targets
Upside: 91,800 → 92,700
Downside: 89,800 → 88,800 → 87,000.
📌 BIAS
Spike up to 91.8–92.2k → Reject → Drop toward 89.8 / 88.8k.
Bearish unless 94k breaks with strength.
Its a liquidity-engineering range, not a trend.
Market wants upper liquidity first, then deliver down.

Mahindra & Mahindra: Reversing Gears—Short Drive Toward 3400”Mahindra & Mahindra is showing clear signs of Smart Money distribution on the higher timeframe. Price has tapped into a major HTF supply zone around 3600–3650, where institutional selling previously originated. The recent sweep of the highs looks like a classic liquidity grab, engineered to trap late buyers before a potential reversal.
After the liquidity sweep, price failed to sustain above premium pricing and has started shifting structure. The transition from a bullish market structure to a bearish market structure shift (MSS) suggests that Smart Money may be positioning for a downside move.
Internal liquidity beneath recent swing lows provides an ideal drawdown target, with the next significant HTF demand zone resting near the 3400 level—aligning perfectly with your short target.
As long as price remains in the premium zone and below the supply region, the setup favors short positions with expectation of price delivery toward the 3400 imbalance + demand confluence.
Happy Trading

Why People Don’t Believe in Compounding Until It’s Too Late?Hello Traders!
Compounding is the most powerful wealth-building force in finance, and yet, most people ignore it.
Not because it doesn’t work, but because it works slowly in the beginning and too fast later.
By the time people realize how powerful compounding really is, they’ve already lost years they can never get back.
Let’s break down why this happens and what you can learn from it.
1. Compounding Looks Boring in the Beginning
In the first few years, compounding feels slow, almost invisible.
You invest, wait, and see very small growth, so people lose interest.
But compounding is like planting a tree: nothing happens for a long time… then everything happens at once.
Early years test your patience. Later years reward it.
2. People Want Fast Results, Not Slow Success
Most traders and investors chase quick profits, because excitement feels better than discipline.
Compounding requires consistency, which feels “boring” compared to high-risk trades.
This impatience makes people break the process before results can appear.
Compounding is slow at first, but permanent later.
3. The Growth Is Invisible Until It Explodes
Compounding does almost nothing for years, then suddenly grows exponentially.
By the time people understand how powerful it is, they’re already 10–15 years behind.
This is why older investors say, “I wish I started earlier.”
The curve is flat… until it goes vertical.
4. Lack of Discipline Breaks the Magic
Skipping contributions here and there reduces future growth dramatically.
Touching invested money destroys compounding momentum.
Consistency, not intelligence, creates compounding returns.
You don’t need to be brilliant. You need to be consistent.
5. People Underestimate Time More Than Money
You can always earn more money, but you can’t earn more time.
The earlier you start, the stronger compounding becomes.
A 25-year-old investing small amounts beats a 40-year-old investing large amounts.
Time is the real multiplier.
Rahul’s Tip:
Compounding doesn’t reward the smartest or richest.
It rewards the most patient.
If you start early, stay consistent, and let time do the heavy lifting, your future wealth becomes unavoidable.
Conclusion:
People don’t believe in compounding because it doesn’t give instant gratification.
But the moment they understand how powerful exponential growth truly is, it’s usually too late.
Start early. Stay patient. Let years, not emotions, build your wealth.
If this post shifted your mindset about long-term investing, like it, comment your thoughts, and follow for more clarity-focused finance lessons!
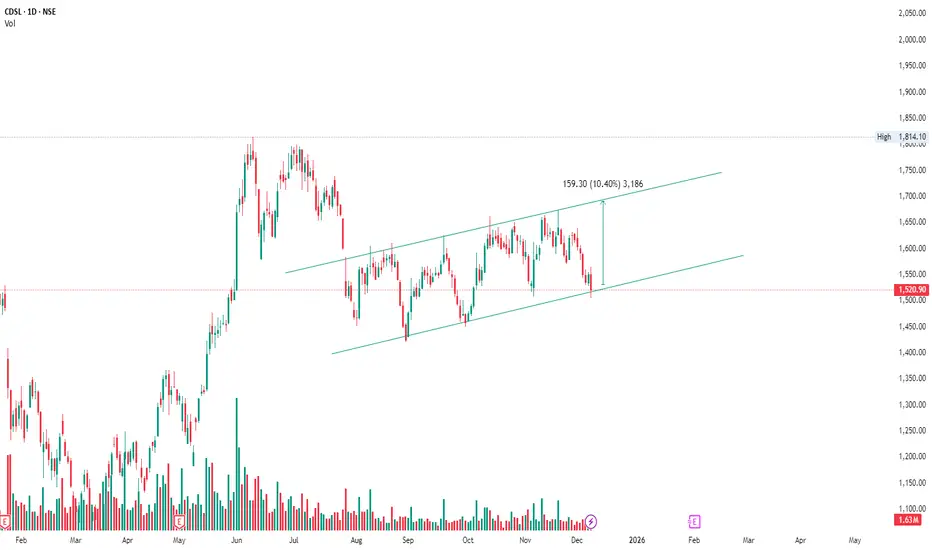
CDSL – Bounce Zone Inside an Up ChannelCDSL has been moving inside a rising channel — higher highs and higher lows.
This means buyers are slowly pushing the stock up over time.
Right now, price has come back to the bottom support line of this channel.
Every time price touched this line earlier, it reversed upward strongly.
So the idea is simple:
📍 Price is near channel support
💪 Buyers have defended this level before
📈 Another upward swing inside the channel may start from here
As long as price stays above the lower trendline,
the stock can continue its up-trend toward the upper channel.
Nifty ready to touch 26020 levelsNifty went bearish and ready to touch its support line 26020. Expecting a pullback from there back in 26100 levels
Indigo: Channel Breakdown Points Toward 4000Details:
Asset: InterGlobe Aviation Ltd (INDIGO)
Breakdown Levels: 5500 (initial), further breakdown below 5000
Potential Target: 4000
Stop Loss: 5250 or as per risk management
Timeframe: Short to Medium Term
Rationale:
InterGlobe Aviation (Indigo) has broken down from a major ascending channel, first losing support at 5500 and now trading below 5000, confirming continued bearish pressure. If the ongoing operational turmoil and flight disruption issues persist, the stock may extend its decline toward the 4000 zone.
Market Analysis:
Technical Setup: Clear channel breakdown with lower highs and strong bearish continuation candles.
Sentiment Impact: Negative news around Indigo’s flight operations and disruption issues is weighing heavily on investor sentiment.
Momentum: Weakness across multiple timeframes indicates sustained selling pressure.
Risk Management:
Keep stop loss near 5250 to avoid reversal traps.
Risk-Reward Ratio:
Strong bearish setup with significant downside potential if sentiment remains weak.
Watch for further breakdown signals and news developments that could accelerate or reverse the trend.

BTC/USDT OUTLOOK FOR TODAYBTC is short-term bullish after sweeping lows, and as long as price holds above $90,000, Smart Money is likely targeting the $92,500 → $94,000 buy-side liquidity next. Expect a small dip to $90.8k–91.2k (FVG/demand) before continuation up.
The main decision point is $94,000 — if price rejects there, expect a drop back toward $89.2k–88k; if it breaks and closes above $94k, upside opens into $95–97k.
Bias: bullish toward $94k.
Invalidation: 1H close below $90k flips bias bearish.

XAU/USD OUTLOOK Main Level to Watch: $4,185–4,190 (key demand + bullish invalidation zone).
Bias: Bullish as long as price holds above this main level.
Expected Move: Dip into $4,190–4,200 demand/FVG, then continuation upward.
Upside Targets: $4,230 → $4,250 (primary liquidity pools).
Break & Hold Above $4,250: Opens the next leg toward $4,280.
Rejection Scenario: If $4,250 rejects, expect pullback toward $4,200–4,185.
Invalidation: 1H close below $4,185 flips bias bearish toward $4,160.

shriram pistonsthis is a motnhly chart showing various levels of supports and resitances and price slowly but surely climbing the wall of worry . Look for setupsin the shorter time frames to find an appropriate entry. Hope the Fibonocci levels up come sooner than expected

BTC/USDT – Bearish Rejection at Supply ZoneAnalysis (15m Timeframe):
Bitcoin is currently trading near the 0.5–0.618 Fibonacci retracement zone, where price has shown repeated rejection. The structure remains bearish, with lower highs forming under the descending trendline.
Price is also approaching a strong supply zone (₹90,100 – ₹90,300), aligning with the descending trendline resistance, increasing the probability of a downside move.
A minor ascending support trendline is visible, and a break below this trendline may trigger stronger selling pressure.
📉 Bearish Trade Setup
Entry Zone: 89,800 – 90,200 (supply + fib confluence)
Stop Loss: Above 90,400
Targets:
TP1: 89,000
TP2: 88,250
TP3: 88,000 (previous swing low)
📌 Bearish Confirmation
✔ Rejection from supply zone
✔ Lower-high structure under descending channel
✔ Trendline break expected
✔ Fibonacci 0.5–0.618 acting as resistance
⚠ Disclaimer
This chart is for educational purposes only. Not financial advice. Always manage risk.

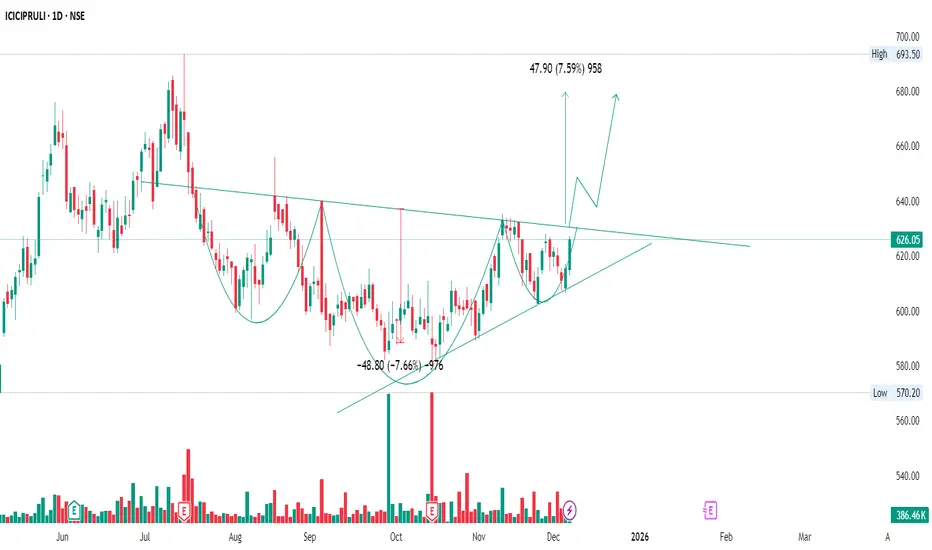
ICICIPRULI – IHNS + Cup & Handle Confluence Breakout SetupDESCRIPTION:
ICICI Prudential has developed a bullish reversal structure with strong pattern confluence.
The chart highlights an Inverse Head & Shoulders pattern:
Left Shoulder and Right Shoulder forming higher lows
A deeper Head marking final seller exhaustion
A down-sloping neckline acting as breakout level
At the same time, the right shoulder forms a Cup & Handle style consolidation, indicating strong absorption of supply.
The rising support trendline continues to protect price, showing demand strengthening with each higher low.
A decisive breakout above the neckline can activate the combined bullish targets, with a measured objective of ~₹47.90 (≈7.6%) as marked on the chart.
Pattern Confluence Advantages:
IHNS → Major trend reversal signal
Cup & Handle → Breakout continuation power
Rising support → Strong buyer presence
Neckline breakout → Momentum confirmation
A successful breakout may trigger an upside move toward the ₹675–690 zone.
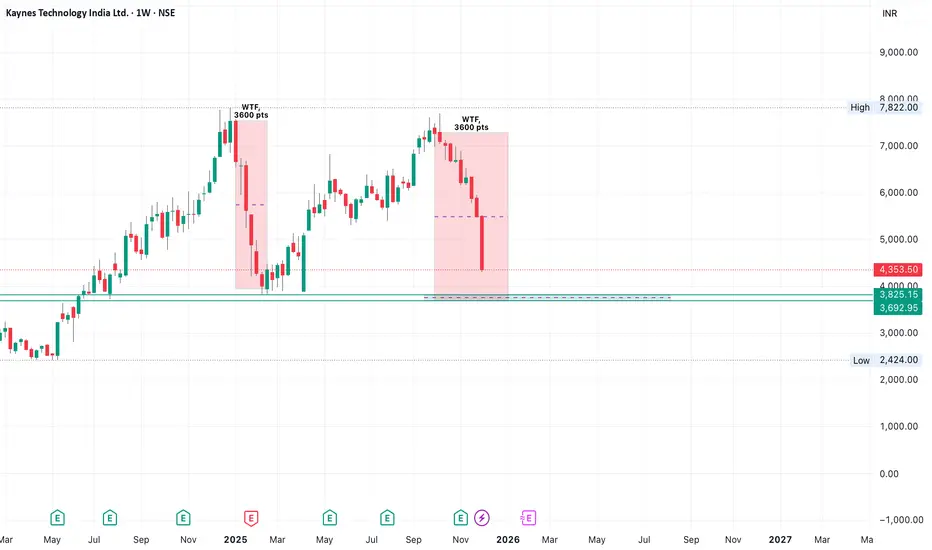
Kaynes Technology Weekly Chart Review | Key Levels & TrendKaynes Technology
Time frame : Weekly
I am expecting 3600 pts fall from the top i.e from 7320 to 3700.
if the weekly candle closes above 3825 price (don't check daily candle only weekly ) and if we get bullish confirmation of two candle then we will have the Entry for Long
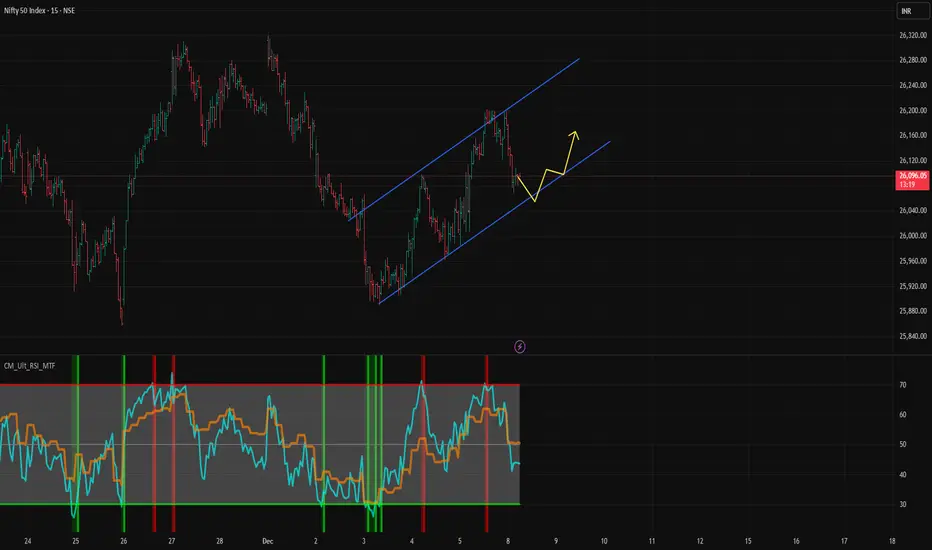
NIFTY – Multi-TF Breakdown | Structure, Levels & What Comes Next📌 Higher-Timeframe Bias (1D)
Nifty continues to respect bullish market structure on the daily timeframe, holding above the recent Break of Structure (BOS) and defending the previous demand zone.
Key notes from the chart:
Price rejected from the premium zone near 26,350–26,400 (EQH area + weak high).
Strong reaction from the discount OB + FVG around 25,350–25,450 zone.
As long as Nifty holds above 25,800, higher-timeframe bullish bias remains intact.
Daily Structure:
HH → HL sequence intact
The last BOS confirmed continuation
Daily OB remains unmitigated below
🔍 4H Structure (Important for Traders)
On the 4H chart, Nifty filled previous imbalances and retested FVGs cleanly.
Key observations:
PDH & PDL zones respected perfectly.
A bullish MSS → BOS has shifted short-term sentiment upward.
FVG at 26,000–26,060 acted as intraday support.
Price reclaimed the VI / PDH cluster, showing absorption of sellers.
This suggests buyers are defending short-term inefficiencies.
🎯 Key Levels to Watch
Upside Resistance:
26,300 – 26,350: Major supply zone
26,400: Weak High + Liquidity Pool
26,475: Next upside target if breakout sustains
Downside Support:
26,050 – 26,000: Intraday FVG + 4H demand
25,900: PDL cluster
25,750: HTF structure break level
25,350 – 25,450: Daily OB/FVG (Major swing support)
📈 Trading Plan (Not Financial Advice)
Bullish Scenario:
If price holds above 26,000 and sustains above PDH/VI cluster →
▶ Target 26,300 → 26,400
▶ Break & close above 26,400 = continuation higher
Bearish Scenario:
If 26,000 breaks decisively →
▶ First target 25,900
▶ Below that → revisit 25,450 (Daily OB)
🧩 Market Structure Summary
HTF bullish, LTF recently flipped bullish
Price currently inside a premium zone, so chasing longs is risky
Dips into discount levels (26,000 / 25,900) are ideal for long setups
Break above 26,350–26,400 can trigger liquidity sweep continuation
🏁 Conclusion
Nifty is compressing between liquidity levels.
The next expansion is likely once 26,400 or 26,000 breaks.
🔥 Bias: Moderately Bullish as long as 26,000 holds.

Emotions vs Logic – Behavioral Finance Explained Simply!Hello Traders!
Every chart you see, every candle formation, and every market move is ultimately a reflection of human behavior.
Markets rise when emotions rise… and they fall when emotions collapse.
Understanding the battle between emotion and logic is one of the most important skills a trader can learn, because this battle is happening inside your mind every single day.
1. What Is Behavioral Finance?
Behavioral finance studies how human emotions influence financial decisions.
It explains why people buy high, sell low, panic too early, and hold losses for too long.
It also explains why logic disappears the moment money is involved.
In simple words:
Behavioral finance tells you why traders do what they shouldn’t do.
2. Emotions That Impact Your Trades
Fear: Makes you exit early or avoid good trades.
Greed: Makes you overtrade and increase position sizes.
Hope: Makes you hold losing trades longer than you should.
Regret: Makes you chase missed entries and force bad setups.
These emotions don’t just influence decisions, they completely override logic when not controlled.
3. Why Logic Fails in Real Time Trading
You may know the strategy, but your instinct takes over the moment money is at risk.
Your brain reacts to losses the same way it reacts to physical pain.
Overconfidence after wins leads to careless decisions.
Fear after losses leads to hesitation and self-doubt.
The market is logical.
Your mind is not, unless trained.
4. How Logic Actually Helps You Trade Better
Logic keeps your risk fixed and predictable.
Logic follows a plan even when emotions are screaming the opposite.
Logic doesn’t chase candles or revenge-trade.
Logic helps you treat trading as a process, not a lottery.
Logic doesn’t eliminate emotions, it protects you from acting on them.
5. Simple Ways to Shift From Emotional to Logical Trading
Use a predefined plan for entries, exits, and stop losses.
Risk a fixed percentage every trade to avoid panic.
Take fewer, high-quality trades instead of reacting to every move.
Keep a journal to track emotional decisions and patterns.
Consistency grows when emotional impulse decreases.
Rahul’s Tip:
You don’t need to remove emotions, you just need to stop letting them press the buttons.
Once you learn to pause, breathe, and follow your plan, logic automatically becomes stronger than impulse.
Conclusion:
The market doesn’t reward intelligence, it rewards emotional control.
Every trader knows what they should do, but only disciplined traders actually do it.
Master your emotions first, and the charts will start making sense like never before.
If this post helped you understand the emotional side of trading, like it, share your thoughts, and follow for more deep psychology insights!

GBPUSDGbpusd just tapped into the FVG and reacted perfectly. Until that imbalance gets violated or DXY shows real strength, I’m favoring longs on continuation.

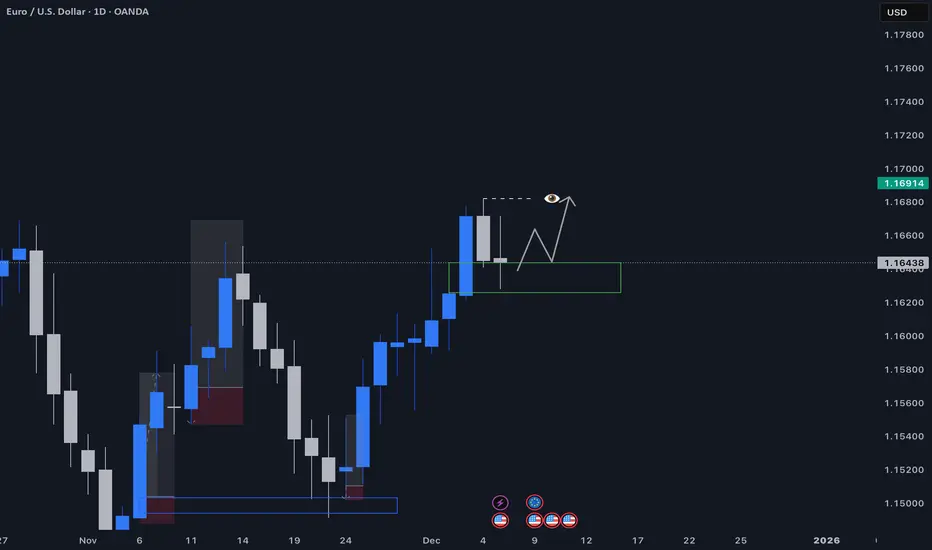
EURUSD EURUSD just tapped into the FVG and reacted perfectly. Until that imbalance gets violated or DXY shows real strength, I’m favoring longs on continuation.

BITCOIN 1HRSWING TRADE
- EARN WITH ME DAILY 10K-20K –
BITCOIN Looking good for Downside..
When it break level 88199 and sustain.. it will go Downside...
SELL @ 88199
Target
1st 83769
2nd 80539
Enjoy trading traders.. Keep add this STOCK in your watch list..
Big Investor are welcome..
Like this Post??? Hit like button..!!!
Follow me for FREE Educational Post and Alert..
