CoalIndia Bullish Breakout on Weekly and DailyAnalysis: After weekly breakout coalindia has consolidated and again same RSI cross setup is seen in charts (daily crossing Weekly and both rising).
The Setup:
Entry Zone: Buy around 380
Stop Loss: Hard stop below 350
Take Profit: Atleast 75-150% of last move should be covered. Put trailing stop loss after 550 and trail till 700
Outlook: Resumption of earlier breakout and cover 75% of original move
Beyond Technical Analysis

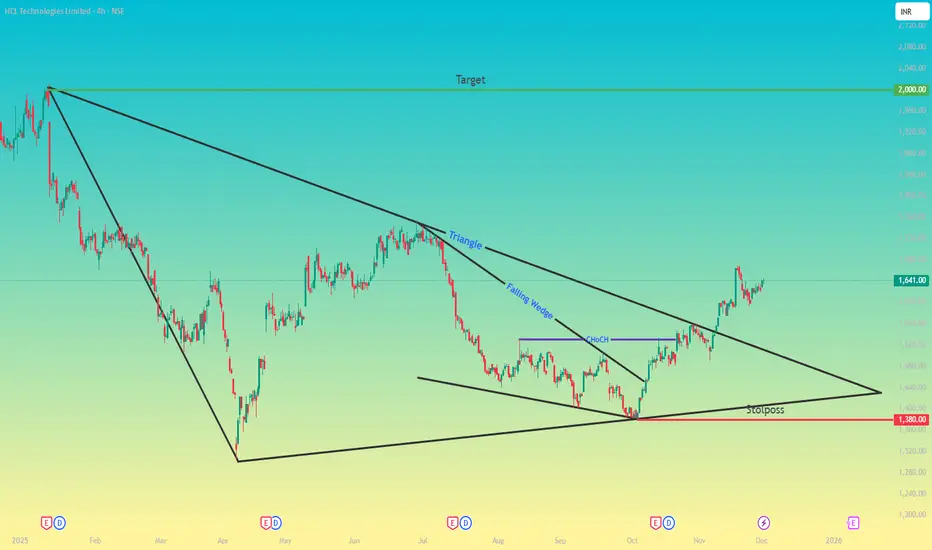
HCLTECH –A Complete Structural Shift After Months of CompressionHCLTECH spent several months inside a broad falling structure, creating a steady sequence of lower highs and lower lows. But within this decline, the market slowly began forming a triangle and later a falling wedge, both of which signaled weakening selling pressure.
The major turning point came when price respected the lower wedge support and produced a strong rally, giving us a clear Change of Character (CHoCH). This move showed that buyers were starting to regain control.
The most important development was the break of the macro descending trendline, which had guided the entire downtrend since early 2025. This break marks the beginning of a higher-timeframe reversal.
With structure now flipped bullish, the chart opens the path toward the next major supply zone near ₹2000, which remains the logical upside target. The setup stays valid as long as price holds above ₹1380, the critical support and invalidation level.
HCLTECH has transitioned from a long period of compression into a confirmed breakout, and momentum now favors continued upside.
HOW TO WATCHLIST IN TRADINGVIEW CREATE RENAME & DELETEThis video explains how to watchlist in Trading-View and demonstrates how to create, rename and delete a watchlist. The focus is on showing where these options are located in Trading-View and how each function works within the interface. The walkthrough is clear and simple, helping users understand the steps to create, rename and delete their watchlist effectively.

Sell @26200 - 26225 Levels - Nifty 50Sir/Mam,
Let the market go upside till 26225 and buy PE and CE 26250 strike price.
Or if the level not passed 26225 then wait till 2 PM
No trade if the market not touched 26225 or if it is below 26100 then wait to reach 26050 - 26000 for ONE SIDE buy only CE - 25950 strike price.
Comment me tomorrow if this works approx.
Have a nice day
HINT - Waiting for the perfect level shows patience of trader.

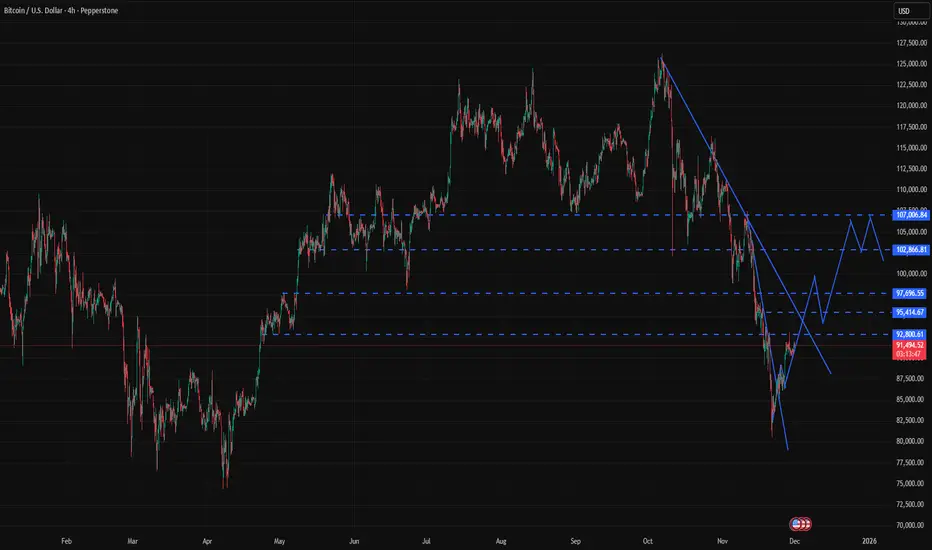
BTCUSD Bullish Breakout Failed. Downside below 80k Open Analysis: The weekly close above $91k failed. It has opened a new scenario of retouching earlier low, which is below 80k
The Setup:
Entry Zone: failure to hold 85k.
Stop Loss: Hard stop below $87k (Invalidates the structural break).
Take Profit: Follow trailing stop loss below 80k or close your position around 80k.
Outlook: Retouch of earlier 80k level and than consolidation. Expecting strength around 80k and after brief consolidation it should charge for 100k levels.

Smart Liquidity Trading StrategiesWhat Is Liquidity?
Liquidity refers to orders waiting to be executed—stop losses, limit orders, breakout orders, etc. These orders accumulate in predictable areas:
Above swing highs
Below swing lows
Near major support or resistance
Around imbalance zones
At psychological levels (like 50, 100, 1000)
Institutional traders know retail traders place stops in these obvious areas. So the market often moves first to collect these orders, then reverses to the real direction.
This mechanism is often referred to as:
Stop hunting
Liquidity sweep
Stop-loss raid
Smart money trap
Smart liquidity strategies attempt to take advantage of these manipulations.
Core Concepts Behind Smart Liquidity Trading
Below are the key building blocks every trader must understand before applying smart liquidity strategies.
1. Liquidity Pools
Liquidity pools are zones where large groups of traders have placed orders. Markets gravitate toward these pools to fill big institutional orders.
Two main types exist:
a) Buy-side liquidity (BSL)
This sits above swing highs.
Breakout buyers place buy stops.
Sellers place stop losses above highs.
When price moves up to sweep these, big players offload large sell positions.
b) Sell-side liquidity (SSL)
This sits below swing lows.
Breakout sellers place sell stops.
Buyers place their stop losses below lows.
Price often dips to sweep these orders before a sharp reversal upward.
2. Liquidity Grabs / Sweeps
These are fast price moves beyond a key high or low followed by sharp rejection.
This signals that:
Liquidity has been collected.
Big traders have executed their orders.
A reversal is highly probable.
Example:
Price breaks a major high → retail buys breakout → institutions sell into that buy-side liquidity → market reverses.
3. Market Structure Shifts
Once liquidity is taken, the next signal is a Market Structure Shift (MSS) or a Change of Character (CHOCH).
It shows that the previous trend ended and a new one is forming.
After sweeping sell-side liquidity, a bullish MSS means price is ready to move up.
After sweeping buy-side liquidity, a bearish MSS indicates downward movement.
This combination—liquidity sweep + structure shift—is the foundation of smart liquidity strategies.
4. Imbalance and Fair Value Gaps (FVG)
When institutions aggressively enter trades, price moves fast and leaves an imbalance—an area where few or no trades happened.
These gaps often get revisited later.
A typical smart liquidity sequence:
Liquidity sweep
Market structure shift
Price retraces to imbalance (FVG)
Smart entry zone triggers
This provides high-probability and low-risk setups.
Smart Liquidity Trading Strategies
Now let’s break down the most effective strategies used by traders following institutional and smart money concepts.
1. Liquidity Sweep + Market Structure Shift Strategy
This is the most popular and powerful strategy.
Steps:
Identify liquidity pool
Above previous highs (BSL)
Below previous lows (SSL)
Wait for price to sweep the liquidity
A quick wick or candle body breaching the zone.
Wait for Market Structure Shift (MSS)
A break in the current trend.
Enter on retracement
At the origin of displacement
Or at a fair value gap (FVG)
Place stop-loss
Below the sweep (for long)
Above the sweep (for short)
Target next liquidity pool
This strategy works on all timeframes.
2. Breaker Block Strategy (Post-Liquidity Grab)
Breaker blocks form when a previous support or resistance zone fails after liquidity collection.
Logic:
Market grabs liquidity beyond a key level.
Price reverses and breaks that level.
The broken zone becomes a powerful entry block.
How to trade:
Identify failed high/low.
Mark the breaker block.
Wait for a retest.
Enter with stop behind the block.
Breaker blocks are highly effective in trending markets.
3. Equal Highs / Equal Lows Targeting
Equal highs or lows attract liquidity because traders place stops or entries in these zones.
Smart traders:
Anticipate sweeps of equal highs/lows.
Enter after sweep.
Target the next liquidity level.
Double-top and double-bottom formations often become liquidity traps.
4. Inducement Strategy
Inducement refers to false setups designed to lure retail traders.
Example:
A mini double-top forms below a larger liquidity pool. Retail shorts early, providing liquidity for institutions to run the real move.
Steps:
Identify small equal highs/lows.
Understand they often induce premature entries.
Expect price to sweep inducement liquidity first.
Enter after true liquidity sweep at the major level.
This prevents entering too early.
5. Liquidity Mapping Multi-Timeframe Strategy
Smart traders never trade on one timeframe. Liquidity must be aligned.
Steps:
HTF (Daily/4H)
Identify major liquidity pools (key highs/lows).
MTF (1H/15M)
Identify intermediate liquidity and imbalance.
LTF (1M/5M)
Look for sweep + MSS to refine entries.
This produces sniper entries with minimal stop-loss.
6. Liquidity Void / Imbalance Filling Strategy
Markets often:
Create a liquidity void (fast, one-sided movement).
Later return to fill that void.
Continue moving in original direction.
Traders enter when price enters the imbalance and shows structure shift.
Why Smart Liquidity Strategies Work
Traditional indicators often lag and don’t explain why price behaves a certain way.
Smart liquidity strategies work because they are based on market logic:
Institutions cannot enter without liquidity.
Retail traders place predictable stop-losses.
Market makers move price to where orders sit.
Liquidity hunts are deliberate, not random.
Price must rebalance inefficiencies.
This makes smart liquidity trading a powerful approach for anticipating market manipulation and aligning with institutional flow.
Advantages of Smart Liquidity Strategies
✔ High accuracy
✔ Trades align with institutional flow
✔ Low stop-loss and high risk-to-reward
✔ Clear rule-based structure
✔ Works across forex, stocks, crypto, indices, commodities
✔ Helps avoid retail traps and fake breakouts
Final Thoughts
Smart liquidity trading strategies are not magic—they are based on understanding how institutional players operate. By learning to identify liquidity pools, sweeps, market structure shifts, imbalance zones, and inducement setups, traders gain a powerful edge over the market.
The key is patience:
You wait for liquidity to be swept, then enter on confirmation—not before.
Master this discipline, and your trading becomes more precise, logical, and consistently profitable.

Small Account Challenges for Indian Traders1. Limited Capital and High Risk Exposure
The primary and most obvious challenge for small account traders is limited capital. With a small account, traders are compelled to take higher risk positions, which often leads to:
A. Overleveraging
Indian brokers offer leverage mainly for intraday equity trades, but in recent years, SEBI regulations have significantly reduced the leverage available.
Small account traders often feel forced to:
Use full margin or near-full margin
Take oversized positions to achieve meaningful returns
Try to flip positions quickly to cover brokerage, taxes, and charges
This increases the probability of a margin call or forced liquidation.
B. Inability to Absorb Drawdowns
Markets naturally move in cycles of profits and losses. A small loss of ₹500 may be negligible for a trader with ₹5 lakh capital but can feel devastating for someone starting with ₹5,000.
This creates emotional stress and leads to irrational decisions like revenge trading.
2. Brokerage, Taxes, and Trading Charges Eat Into Profits
Trading in India involves multiple cost elements:
Brokerage
STT/CTT
Exchange Transaction Charges
GST
SEBI Fees
Stamp Duty
Slippage
For small accounts, these charges form a disproportionately large percentage of the capital. For example:
A trader with ₹10,000 may lose up to 1–2% per trade in costs alone.
Frequent intraday trading becomes unviable when costs exceed potential profits.
This pushes many small account traders toward high-risk segments like options buying, which has lower capital requirements but high volatility.
3. Pressure to Make Quick Profits
Indian traders with small accounts often enter the market with the mindset:
“I need to double this account fast.”
“I want to make monthly income from ₹10,000 capital.”
“I will start small and become full-time in a few months.”
This creates unrealistic expectations, leading to:
Overtrading
Aggressive option buying
Fear of missing out (FOMO)
Emotional swings
Impulsive decisions
The expectation to grow capital rapidly is one of the biggest psychological traps.
4. Limited Access to Diversification
With small capital, it’s difficult to diversify across:
Stocks
Sectors
Time frames
Trading strategies
Most small traders put all their capital into a single stock or a single futures or options position, which increases portfolio risk dramatically. A single bad trade can wipe out the account.
5. Options Buying Addiction
Because equity and futures require higher capital, small traders gravitate toward options buying, particularly:
Weekly Nifty/Bank Nifty options
Zero day expiry (0DTE) trades
Far OTM options
While these instruments offer high reward potential, they also carry:
Very fast time decay
High volatility risk
Frequent whipsaws
Low probability of consistent profitability
Most small account traders get trapped in a cycle of quick profits followed by large losses, ultimately destroying their capital.
6. Difficulty Implementing Proper Risk Management
Risk management requires rules like:
Risk 1–2% per trade
Maintain stop-loss discipline
Control position size
However, with small accounts, applying these rules becomes nearly impossible.
For example, with ₹10,000 capital:
1% risk = ₹100
Most trades cannot be structured within such tight risk limits
Even brokerage and charges exceed the risk budget
Thus, small traders are almost forced to violate risk rules, making professional-level discipline difficult to maintain.
7. Emotional and Psychological Challenges
Small account trading is mentally draining because:
Every loss feels bigger than it is.
Every profit seems insufficient.
A few losing trades can wipe out weeks of effort.
Fear of losing capital creates hesitation.
Greed pushes traders to take oversized bets.
This emotional instability leads to:
Overtrading
Lack of patience
Jumping between strategies
Chasing trending stocks
Continual strategy switching
Psychology becomes a greater barrier than capital itself.
8. Limited Access to Tools, Data, and Learning Resources
Professional traders use:
Advanced charting platforms
Real-time data feeds
Premium screeners
Algorithms and automation
Backtesting tools
For a small account trader, these tools feel expensive and unaffordable.
As a result, they rely on:
Free charting websites
Social media tips
Influencer trades
Telegram groups
Many of these sources are unreliable, biased, or manipulated.
9. Lack of Experience in Market Cycles
Small traders often enter the market during bull phases, where:
Almost every trade gives profit
Stocks keep rising
Market sentiment is positive
When the market shifts into a volatile or bearish phase, small traders struggle to adapt.
They lack experience in handling:
Downtrends
Range-bound markets
High volatility periods
Event-driven uncertainty
This inexperience leads to heavy losses.
10. Compounding Takes Time—People Want Immediate Results
Growing a small account through disciplined compounding requires:
Patience
Persistence
Realistic targets
Long-term vision
However, many small traders want:
Quick doubling
Daily profits
Constant action
High returns instantly
This mindset contradicts the reality of compounding, which is slow but powerful over time.
11. Social Pressure and Unrealistic Comparisons
Many traders compare themselves to:
Influencers showing big profits
Experienced traders posting daily screenshots
People claiming to double accounts regularly
This comparison creates unnecessary pressure, causing small traders to take irrational risks just to match those results.
Most don’t realize that successful traders today started small themselves—but with years of experience.
Conclusion
Small account trading is challenging in India due to limited capital, high transaction costs, emotional stress, and structural market restrictions. However, success is still possible with realistic expectations, disciplined risk management, and a focus on long-term skill development instead of quick profits.
By understanding these challenges deeply, Indian traders can avoid common traps, preserve their capital, and slowly build a strong foundation for future growth.

GOLD preparing for a big move. gold is trading in close consolidation range. wait for a break out or break down with price action for entry.

gold spot update after breakoutgold spot given major breakout now have to see support 4160$ for any down correction. all eyes on fomc rate cut or not!! if gold spot stya abv 4225 than mkt looks big up side 4280--4345$ very soon .
trading ideas--- if market come down than buy only with support sl or relax for big tgt if any change in fomc rate cut than will cause to sudden down fall.
mcx gold--gold hold above 130000 than no worry for bulls for short term soon tgt 131--132k than afer may be some correction than after again 137k+++++ only close blow 130000 for 2days than down side expect 129300-128500--128000++++

Mahindra & Mahindra: Sector Leader Trading Near Peak🔍 Technical Analysis
Mahindra & Mahindra Limited stands as the exceptional performer in the automobile sector. While most automobile stocks are trading at significant discounts from their all-time highs, M&M is the only stock trading near its all-time high - a testament to its superior operational performance and market leadership.
Technically, the stock has delivered a super bullish rally spanning over a decade. From trading below ₹500 a decade ago, it has rallied to ₹3,781 by November 2025 - representing an impressive 7.5x growth showcasing consistent value creation.
For the past 3-4 months, the ₹3,700-₹3,800 zone has acted as resistance multiple times, with the stock currently trading at ₹3,757. However, over the past 6 months, the stock has been forming higher lows consistently, with the most recent higher low established at ₹3,500 - indicating strong underlying accumulation and bullish structure.
Entry Strategy: Plan entry at the next higher low formation in the ongoing uptrend pattern.
Targets:
- Target 1: ₹3,800
- Target 2: ₹3,900
- Target 3: ₹4,000
Stop Losses:
- Critical Support: ₹3,500 (recent higher low)
No expectations below ₹3,500 as it would break the higher low pattern.
💰 FY25 Financial Highlights (vs FY24 & FY23)
Total Income: ₹1,59,211 Cr (↑ +14% YoY from ₹1,39,078 Cr; ↑ +31% from FY23 ₹1,21,269 Cr)
Total Expenses: ₹1,28,693 Cr (↑ +13% YoY from ₹1,14,186 Cr; ↑ +27% from FY23 ₹1,00,983 Cr)
Financial Profit: ₹30,518 Cr (↑ +23% YoY from ₹24,892 Cr; ↑ +50% from FY23 ₹20,285 Cr)
Profit Before Tax: ₹19,080 Cr (↑ +19% YoY from ₹15,978 Cr; ↑ +36% from FY23 ₹14,060 Cr)
Profit After Tax: ₹14,073 Cr (↑ +15% YoY from ₹12,270 Cr; ↑ +24% from FY23 ₹11,374 Cr)
Diluted EPS: ₹103.97 (↑ +15% YoY from ₹90.62; ↑ +26% from FY23 ₹82.68)
🧠 Fundamental Highlights
Mahindra & Mahindra delivered stellar FY25 performance with consolidated revenue growing 14% to ₹1,59,211 crore and PAT rising 20% (excluding KG Mobility impact) to ₹12,929 crore. The company announced 20% dividend increase to ₹25.3 per share, demonstrating strong cash generation of ₹10,000 crore in FY25.
Q4 FY25 showcased exceptional momentum with consolidated PAT up 20% to ₹3,295 crore and revenue growing 20% to ₹42,599 crore. The company achieved significant market share gains: SUV revenue share jumped 310 bps YoY to 23.5%, LCV (<3.5T) market share surged 480 bps, and tractor market share reached all-time high of 43.3% (up 170 bps YoY).
Auto division reported outstanding performance with standalone PBIT margin improving 110 bps to 9.2% in Q4 and full-year PBIT growing 30% to ₹8,277 crore. Farm sector standalone PBIT increased 30% to ₹5,371 crore with Q4 margin expansion to 19.4% and core tractor PBIT margins improving 200 bps.
Strategic EV initiatives gaining traction with BE 6 and XEV 9e launch creating record 30,179 bookings on Day 1. The company has delivered 6,300 electric vehicles and targets 20-30% EV contribution by FY30. M&M plans ₹27,000 crore capex for automotive business (FY25-27) with 9 ICE SUVs and 7 BEVs launches planned.
Brokerages project strong multi-year growth with Nuvama expecting 15-40% revenue CAGR across segments over FY25-30 and maintaining Buy rating with ₹4,200 target. Emkay Global raised target to ₹3,800 citing 15-17% FY25-30 revenue CAGR guidance. The company targets eight-fold SUV revenue scale-up between FY20 and FY30 through INGLO and NU_IQ platforms.
✅ Conclusion
Mahindra & Mahindra's exceptional positioning as the only automobile stock near all-time highs, backed by stellar FY25 showing 15% PAT growth and 14% revenue increase to ₹1,59,211 crore, validates its sector leadership. The higher low pattern with recent support at ₹3,500 provides technical confidence for targeting ₹4,000 levels. Record 43.3% tractor market share, 23.5% SUV market share, and ₹10,000 crore cash generation demonstrate operational excellence. EV strategy with 30,179 Day 1 bookings and ₹27,000 crore capex provide strong growth visibility. Brokerage targets at ₹3,800-₹4,200 with ROE at 18.1% support premium valuation for this multi-decade wealth creator.
Disclaimer: This analysis is for educational purposes only. Please consult your financial advisor before making investment decisions. Stock markets are subject to risks.

L&T: Breakout Above Multi-Year Resistance Zone🔍 Technical Analysis
Larsen & Toubro Limited stands as a leading performer in the Infrastructure & Construction sector. Technically, the stock has delivered a super bullish rally spanning over two decades, transforming from below ₹100 to reaching ₹3,860 by April 2024 - representing an impressive 38x+ growth showcasing consistent value creation.
The ₹3,860-₹3,960 zone acted as formidable resistance multiple times over several months. However, October 2025 marked a turning point with positive Q2 FY26 results providing the fundamental catalyst for a decisive breakout above this multi-year resistance zone.
The critical development is that the price has sustained above the breakout level for the past month, demonstrating genuine strength rather than a false breakout. The stock created a new all-time high at ₹4,140 and is currently trading at ₹4,069, consolidating gains near the highs.
Entry Strategy: Fresh entry above ₹4,150 with sustained momentum confirmation.
Targets:
- Target 1: ₹4,300
- Target 2: ₹4,400
- Target 3: ₹4,500
Stop Losses:
- Critical Support: ₹3,860-₹3,960 zone (previous resistance, now support)
No expectations below the ₹3,860-₹3,960 zone as it would invalidate the breakout.
💰 Q2 FY26 Financial Highlights (vs Q1 FY26 & Q2 FY25)
Total Income: ₹67,984 Cr (↑ +7% QoQ from ₹63,679 Cr; ↑ +10% YoY from ₹61,555 Cr)
Total Expenses: ₹59,470 Cr (↑ +7% QoQ from ₹55,655 Cr; ↑ +11% YoY from ₹53,638 Cr)
Financial Profit: ₹8,513 Cr (↑ +6% QoQ from ₹8,024 Cr; ↑ +8% YoY from ₹7,917 Cr)
Profit Before Tax: ₹6,336 Cr (↑ +8% QoQ from ₹5,860 Cr; ↑ +14% YoY from ₹5,555 Cr)
Profit After Tax: ₹4,678 Cr (↑ +8% QoQ from ₹4,318 Cr; ↑ +14% YoY from ₹4,099 Cr)
Diluted EPS: ₹28.54 (↑ +9% QoQ from ₹26.30; ↑ +16% YoY from ₹24.69)
🧠 Fundamental Highlights
Larsen & Toubro delivered exceptional Q2 FY26 performance with consolidated PAT surging 16% YoY to ₹3,926 crore and revenue growing 10% to ₹67,984 crore. The company reported stellar 45% YoY growth in order inflows to ₹1.16 trillion, driving the order book to an all-time high of ₹6.67 trillion (up 31% YoY), providing robust revenue visibility for years.
EBITDA grew 7% YoY to ₹6,807 crore with margins at 10.1%. H1 FY26 consolidated PAT jumped 22% to ₹7,543 crore on 13% revenue growth to ₹1,31,662 crore. International revenues constituted 56% of Q2 revenue at ₹38,223 crore, while international orders accounted for 65% of order inflow at ₹75,561 crore.
The Projects & Manufacturing order book maintains balanced geographic mix with 51% domestic and 49% international. Infrastructure segment dominates with 61% share of order book (₹3.74 trillion), followed by Energy at 30% (₹1.84 trillion), showcasing L&T's core strength in infrastructure and energy.
Strategic initiatives gaining traction include Carbon Light Solutions prospects pipeline at ₹460 billion (doubled from ₹240 billion last year), green & clean energy opportunities at ₹180 billion (up 18x from ₹10 billion), and high-tech manufacturing prospects at ₹310 billion (doubled from ₹160 billion YoY).
The company entered strategic partnership with General Atomics Aeronautical Systems for MQ-series RPAS production to enhance India's defense capabilities. L&T secured major ultra mega orders in Middle East hydrocarbon business and holds L1 position on three bids totaling $4.5 billion in Kuwait with strong pipeline in Saudi Arabia, Qatar, and UAE.
✅ Conclusion
Larsen & Toubro's remarkable two-decade journey from sub-₹100 to ₹4,140 all-time high, backed by exceptional Q2 FY26 showing 16% PAT growth and 45% order inflow surge, validates the infrastructure leadership thesis. Sustained breakout above ₹3,860-₹3,960 resistance with current trading at ₹4,069 provides technical confirmation for next leg toward ₹4,500. Record ₹6.67 trillion order book (31% YoY growth), 65% international order contribution, and balanced geographic mix demonstrate execution excellence. Strategic focus on green energy (₹180 billion pipeline) and defense partnerships provide multi-year growth visibility. Entry above ₹4,150 targets ₹4,500 with strong support at breakout zone.
Disclaimer: This analysis is for educational purposes only. Please consult your financial advisor before making investment decisions. Stock markets are subject to risks.

Bajaj Finserv: Breakout Above Decade-Long Resistance🔍 Technical Analysis
Bajaj Finserv Limited showcases an outstanding wealth creation journey spanning over a decade. The stock has delivered a super bullish rally from below ₹100 to reaching ₹1,932 by October 2021 - representing an impressive 19x+ growth in just over 10 years.
The ₹1,900-₹2,000 zone acted as formidable resistance multiple times over several years. However, 2025 marked a turning point with an initial breakout attempt that didn't sustain. The critical development came in the past month when the stock decisively broke and sustained above the resistance zone.
The stock rallied to reach a new all-time high of ₹2,195 and is currently trading at ₹2,094 after some profit booking. This sustained breakout above the decade-long resistance marks a significant technical milestone.
Entry Strategy: Fresh buying opportunities arise above ₹2,200 level with sustained momentum.
Targets:
- Target 1: ₹2,300
- Target 2: ₹2,400
- Target 3: ₹2,500
Stop Losses:
- Minor Support: ₹1,900 (old resistance zone)
- Major Stop: ₹1,500 (recent higher low)
No expectations below ₹1,900; major stoploss at ₹1,500.
💰 FY25 Financial Highlights (vs FY24 & FY23)
Total Income: ₹1,33,822 Cr (↑ +21% YoY from ₹1,10,382 Cr; ↑ +63% from FY23 ₹82,072 Cr)
Total Expenses: ₹84,298 Cr (↑ +21% YoY from ₹69,497 Cr; ↑ +61% from FY23 ₹52,204 Cr)
Financial Profit: ₹49,524 Cr (↑ +21% YoY from ₹40,886 Cr; ↑ +66% from FY23 ₹29,868 Cr)
Profit Before Tax: ₹23,748 Cr (↑ +11% YoY from ₹21,375 Cr; ↑ +41% from FY23 ₹16,811 Cr)
Profit After Tax: ₹17,558 Cr (↑ +13% YoY from ₹15,595 Cr; ↑ +44% from FY23 ₹12,210 Cr)
Diluted EPS: ₹55.57 (↑ +9% YoY from ₹51.07; ↑ +38% from FY23 ₹40.29)
🧠 Fundamental Highlights
Bajaj Finserv delivered stellar FY25 performance with consolidated revenue increasing 21% YoY to ₹1,33,822 crore and PAT rising 12.6% to ₹17,557 crore. Management stated "FY25 marked another successful year for Bajaj Finserv" with balanced mix of lending, protection, and wealth management driving growth.
Insurance and lending remained strong revenue drivers. Segmental profit before tax for insurance reached ₹2,295 crore, while retail financing contributed ₹22,249 crore to PBT. Insurance gross written premium stood at ₹48,742 crore in FY25, while retail financing revenue jumped to ₹69,724 crore from ₹54,982 crore YoY.
Q2 FY26 showed continued momentum with consolidated net profit of ₹2,244 crore (up 7.5% YoY) and overall AUM rising 24% YoY to ₹4.62 lakh crore. The company booked 1.22 crore new loans and added 41 lakh new customers during Q2 alone, demonstrating strong franchise expansion.
Subsidiary Bajaj Finance posted exceptional growth with AUM reaching ₹4.16 lakh crore (up 26% YoY), customer franchise crossing 10 crore milestone, and announcing FY26 guidance of 25-27% AUM growth and 23-24% profit growth with 19-21% ROE target.
Life insurance subsidiary (Bajaj Life) initiated "Bajaj Life 2.0" strategy with Value of New Business surging 50% to ₹367 crore and New Business Margin expanding to 17.1% from 10.8%. Broking arm reported 40% AUM growth to ₹7,597 crore with customer base rising 38% to 12 lakh.
✅ Conclusion
Bajaj Finserv's impressive decade-long journey from sub-₹100 to ₹2,195 all-time high, backed by strong FY25 showing 13% PAT growth and 21% revenue surge, validates the diversified financial services leadership thesis. Recent sustained breakout above ₹1,900-₹2,000 resistance zone and current trading at ₹2,094 provides technical confirmation for next leg toward ₹2,500. AUM reaching ₹4.62 lakh crore, subsidiary Bajaj Finance crossing 10 crore customers, and insurance VNB growth of 50% demonstrate robust operational strength. Entry above ₹2,200 targets ₹2,500 with strong support structure at ₹1,900 and ₹1,500 levels.
Disclaimer: This analysis is for educational purposes only. Please consult your financial advisor before making investment decisions. Stock markets are subject to risks.

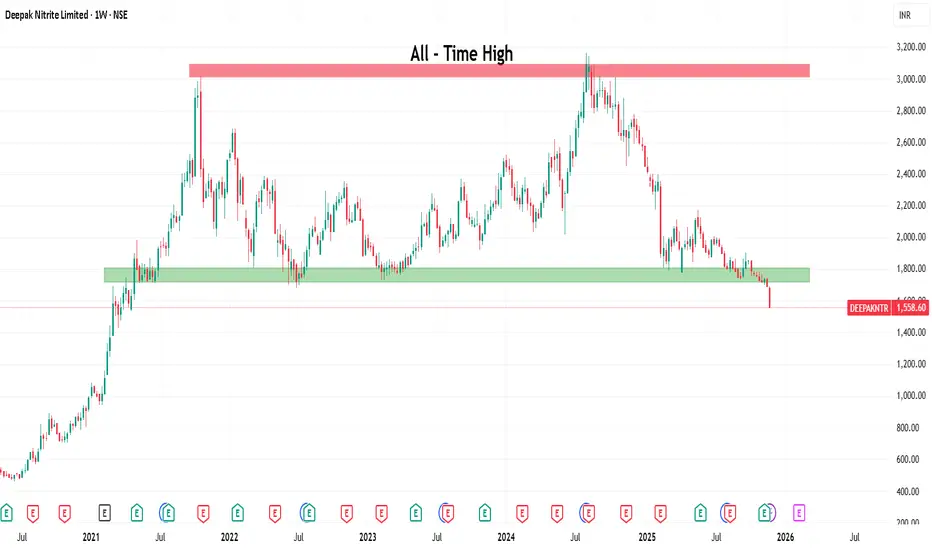
Deepak Nitrite: Support Breakdown Signals Caution🔍 Technical Analysis
Deepak Nitrite Limited has experienced a super bullish rally over the past decade, transforming from below ₹100 to reaching ₹3,000 by October 2021 - representing an impressive 30x growth in just 10 years. However, the stock has since entered a prolonged consolidation and correction phase.
The ₹3,000-₹3,200 zone acted as formidable resistance twice, while the ₹1,700-₹1,800 zone provided strong support multiple times over the past few years. This created a well-defined trading range that held for an extended period.
Critical Development: The stock has now broken below the crucial ₹1,700-₹1,800 support zone and is currently trading at ₹1,625. This breakdown is technically significant and suggests the market has entered bearish sentiment.
Analyzing the Profit & Loss statements over the past 4 years reveals a concerning trend - while sales show positive year-on-year growth, EPS has been declining consistently (from ₹62.47 in FY23 to ₹51.12 in FY25), indicating margin compression and profitability challenges.
Current Recommendation: No buying opportunities at current levels. Wait for the stock to reclaim and sustain above ₹2,000 before considering long positions.
💰 FY25 Financial Highlights (vs FY24 & FY23)
Total Income: ₹8,282 Cr (↑ +8% YoY from ₹7,682 Cr; ↑ +4% from FY23 ₹7,972 Cr)
Total Expenses: ₹7,187 Cr (↑ +10% YoY from ₹6,555 Cr; ↑ +8% from FY23 ₹6,680 Cr)
Financial Profit: ₹1,095 Cr (↓ -3% YoY from ₹1,127 Cr; ↓ -15% from FY23 ₹1,292 Cr)
Profit Before Tax: ₹953 Cr (↓ -14% YoY from ₹1,102 Cr; ↓ -17% from FY23 ₹1,146 Cr)
Profit After Tax: ₹697 Cr (↓ -14% YoY from ₹811 Cr; ↓ -18% from FY23 ₹852 Cr)
Diluted EPS: ₹51.12 (↓ -14% YoY from ₹59.45; ↓ -18% from FY23 ₹62.47)
🧠 Fundamental Highlights
Deepak Nitrite faces significant headwinds despite strategic capacity expansion initiatives. The company reported Q4 FY25 PAT of ₹202 crore (down 20% YoY) with full-year FY25 PAT at ₹697 crore, reflecting a 14% decline from FY24's ₹811 crore. Revenue grew modestly by 8% to ₹8,282 crore, but profitability deteriorated due to persistent margin pressures.
The challenging Q3 FY25 witnessed PAT plummeting 51.5% YoY to ₹98 crore as the company faced a "perfect storm" of idled plants due to deferred demand, elevated raw material costs, and lower realizations. EBITDA margins contracted sharply to 7% in Q3 from 12.8% in Q2 FY25, indicating severe profitability challenges.
Market cap has declined 42.8% in one year to ₹21,258 crore, with the stock falling from 52-week high of ₹3,168.60 (August 2024) to 52-week low of ₹1,962.50 (February 2025). Prabhudas Lilladher downgraded the stock with 'Reduce' rating and ₹2,582 target price, citing commodity-driven business challenges.
Despite headwinds, the company is investing heavily in capacity expansion with ₹2,000 crore capex in FY25 for MIBK, MIBC, nitric acid, and enhanced nitration capabilities. Additionally, ₹8,500 crore investment is planned for polycarbonate resin production, positioning for long-term growth in material sciences.
Management expects profitability rebound from Q4 FY25 onwards with new projects commissioning and backward-forward integration providing operational resilience. The company has entered medium-term supply agreements aligning with expanded capacity and completed cost improvement initiatives for agrochemicals and dye intermediates.
✅ Conclusion
Deepak Nitrite's decade-long bull run from sub-₹100 to ₹3,000 faces significant reversal with support breakdown to ₹1,625. Declining EPS trend (₹62.47 in FY23 to ₹51.12 in FY25) despite revenue growth signals persistent margin compression from elevated input costs and competitive pressures. The 42.8% market cap decline and analyst downgrades reflect bearish sentiment. While ₹2,000 crore FY25 capex and ₹8,500 crore polycarbonate investment provide long-term visibility, near-term challenges persist. Technical breakdown below ₹1,700-₹1,800 support suggests avoiding fresh positions until stock reclaims ₹2,000 level with sustained volume confirmation.
Disclaimer: This analysis is for educational purposes only. Please consult your financial advisor before making investment decisions. Stock markets are subject to risks.
Bullish Breakout Confirmed. Key Level Conquered: $91,000 (WeeklyAnalysis: The weekly close above $91k represents a confirmed change in market character. Sell-side liquidity has been absorbed. We have entered a "Blue Sky" environment where the next major structural resistance is the psychological $100,000 barrier.
The Setup:
Context: Momentum breakout into a liquidity vacuum.
Entry Zone: Re-tests of $91,000 - $93,000.
Stop Loss: Hard stop below $88,000 (Invalidates the structural break).
Take Profit: Front-run the $100,000 level (expect heavy sell walls at $99.5k).
Outlook: Expect volatility, but the trend is strictly upward as long as $88k holds.
Similar move expected for ETHUSD
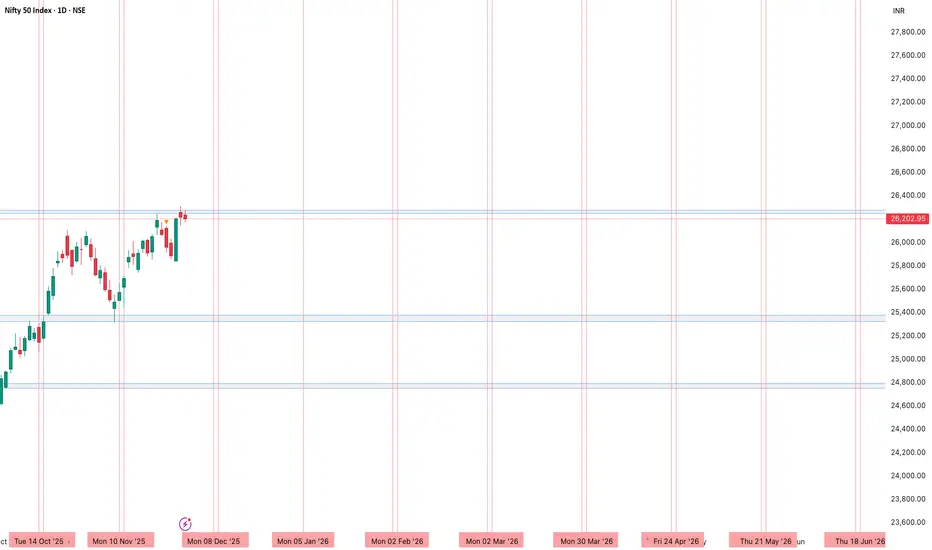
Nifty Time-Cycle Trend Reversal – Pushya Nakshatra Vertical LineIn this analysis, I have marked vertical lines on the Nifty chart based on the 2026 Pushya Nakshatra dates.
Pushya Nakshatra is considered an important time cycle in financial astrology and often aligns with key market turning points.
The vertical red lines highlight potential time-based trend reversal zones. When these time cycles overlap with major supply-demand levels, Nifty commonly reacts with a reversal or strong directional move.
What this Idea Shows
All major Pushya Nakshatra dates for 2026
Possible time-based reversal areas
Confluence with price structure and support–resistance zones
High-probability reversal points when the price meets the cycle date
Trading Approach
Observe price behavior near marked time cycles
Look for reversal candlestick patterns
Combine with supply–demand zones for higher accuracy
Not a buy/sell signal — only time-cycle based market behaviour observation
Conclusion
Pushya Nakshatra often acts as a natural cycle window where Nifty shows momentum shifts.
By combining these dates with technical zones, traders get early indications of potential trend reversals.
Nifty 50 for 1st December Here's my view on nifty 50 after carefully analysing volume, future and chart pattern.

1-Day (Daily) & 4H Chart — What It Says Now🔎 1-Day (Daily) Chart — What It Says Now
📌 Moving Averages Extremely Supportive
All key moving averages — 5, 10, 20, 50, 100, and 200 DMA — continue to trend upward, with price comfortably trading above them.
This alignment reflects:
strong underlying demand
a sustained uptrend
buyers active on dips
Trend structure: Clean, bullish, and stable.
📌 Momentum Indicators Point Upwards
RSI (14) hovering in mid-60s → bullish but not overbought
MACD remains in positive territory, signal line crossover holding
Stochastic %K is elevated → reflects strength and sustained momentum
Overall, momentum is firmly bullish, with no signs of exhaustion yet.
📌 Pivot Levels Active
Price is reacting near key pivot zones, meaning:
Intraday swings may occur
Breakouts or rejections can come quickly
Supports/resistances are likely to be respected
This adds importance to short-term decision zones.
📌 Overall Daily Trend
✔ Strong uptrend
✔ Healthy momentum
✔ Above all major moving averages
✔ Buyers retain dominance
Bottom Line:
Nifty’s daily structure is bullish. Trend remains intact unless key support levels break decisively.
⏳ 4-Hour (4H) Chart — Short-Term Market Behavior
The 4H chart adds more detail to shorter-term moves and shows the internal strength of the ongoing trend.
📌 4H Trend Still Up, but Entering a Decision Zone
Price action shows:
Higher lows
Higher highs
Strong support clusters on dips
Sellers showing mild presence near upper resistances
This timeframe suggests mild consolidation within a bullish structure.
📌 4H Indicators
RSI mildly elevated
MACD flattening slightly as price approaches resistance
Price compression possible before a breakout
This hints at short-term stabilization — a pause rather than reversal.
📈 4-Point Broader Chart / Market Outlook (Short → Medium Term)
1️⃣ Near-Term Upside Target / Resistance Zone
Key resistance seen at 26,440 – 26,800.
This is the zone to watch for:
Breakout → fresh rally
Rejection → consolidation or dip
A decisive close above this range may open the gate for new highs.
2️⃣ Key Support Levels to Track
Immediate support: 26,100 – 26,200
If this breaks, deeper supports lie near previous consolidation levels.
As long as Nifty holds above these, the structure remains bullish.
3️⃣ Volatility & Consolidation Risk
Despite bullish trend, momentum is steady, not euphoric:
ADX not extremely strong → trend is healthy but not overheated
Possible sideways movement
Integrated consolidation before next leg
Ideal for range trading until breakout clarity emerges.
4️⃣ Sectoral & Breadth Context
Even though headline Nifty is strong:
Media, Realty, IT have underperformed
Breadth is not fully aligned with index strength
Heavyweight stocks driving the rally
Sector rotation may be key for medium-term sustainability.
🎯 Key Scenarios Going Forward
📌 1. Bullish Continuation (High Probability)
If Nifty holds 26,100–26,200 and breaks 26,440–26,800 →
Upside expansion likely, trend remains intact.
📌 2. Range / Consolidation (Likely Before Breakout)
Mixed breadth + moderate volatility suggests
Brief sideways movement before decisive direction.
📌 3. Pullback / Correction (Risk Trigger)
If supports break along with sectoral weakness →
Nifty may test lower supports with increased volatility.
💼 What This Means for Traders & Investors
For Traders
Bullish bias is intact
Prefer trades on breakouts or support bounces
Avoid premature entries near resistance
Manage risk due to short-term consolidation risk
For Medium-Term Investors
Trend is not showing signs of topping
Continue exposure but track sectoral leadership
Focus on stock-specific strength rather than index alone
Risk Management
Avoid over-leveraging as volatility pockets may emerge
Respect support levels
Watch the 26,440–26,800 zone for next directional cue
📌 Final Combined View (1D + 4H)
Nifty remains in a strong, well-supported uptrend across both timeframes.
Daily chart shows broad strength → 4H chart shows controlled consolidation.
Market is setting up for a potential breakout, though short-term range-bound action is likely until price crosses key levels.

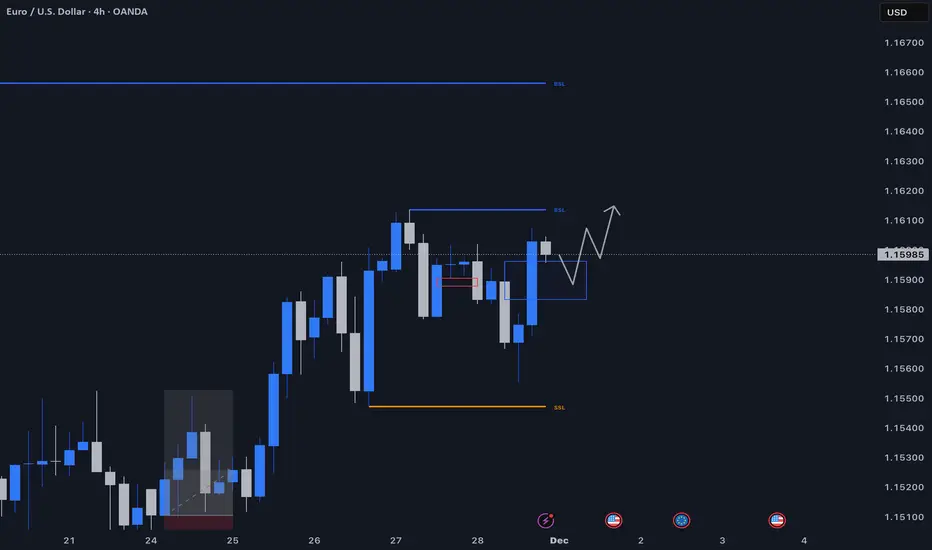
EURUSD Strong bullish continuation. Buy-side liquidity raided below range; smart money positioned long for markup into premium arrays. Increasing upside volume and reduced sell pressure above
DXY Strong bearish continuation. Sell-side liquidity swept below range; smart money positioned short for markup into discount arrays. Reduced buy pressure and building downside volume below

BTCUSDStrong bullish continuation. Liquidity has been engineered below the range; smart money is now positioned for markup into premium arrays. Expect reduced sell pressure and increasing buy-side volume

Long is just begging to be on ETHUSDTA good support zone has formed a 4-hour imbalance, which could lead to a good buyback on a higher high. There hasn't been a breakdown in the structure (yet), so overall, it's worth a try.

escortslooking good on chart escort posted good results in recent quterly tractor growth sale is picking up agriculutural in india peaking up .good mansons helping farmer for growrth

Hudco limited HUDCO looking for breakout housing growth picking up and credit growth also coming back to 2022 level
not participited in fall recovery is good from recent lows and now looking for breakout after good consolidation
