MARICO : Near Darvas Box BreakoutMarico is near life time high and consolidation is going on weekly timeframe. chart is showing a good and healthy consolidation.. Nifty is also near ATH and about to Break so as MARICO . Lets see how it perform.
All data is available in public domain..
CMP : 740
TSL : Below 9 Daily EMA
SL : Below 21 Daily EMA
Stock's selection based on 5 Point Analysis:
1: Idea : Near Darvas Box Breakout.
2: Support : Volume, Delivery .
3: Technical : 21/55/200-EMA, Super trend up, RS>0 RSI.
4: Fundamental : PE, PAT, Industry & peer PE and sector performance.
5: Timing : Entry Timing on Daily chart.
Disclaimer : It is my personal view as a trader and for educational purpose only. Equity market involves risk .
Please consult your financial adviser before taking any decision.
Beyond Technical Analysis

Nifty Opening Monday Upside - 26100 or Downside 25600 (approx.)Sir/Mam,
Tomorrow, Nifty will open in gap either up or down, if it opens UPSIDE that means we are not dependent on Global chaos or if it opens DOWNSIDE that means we are still in concern for Global or some internal tension, real test begins tomorrow. It does not mean that it will show momentum tomorrow itself it will create space to reverse for the coming expiry, for e.g. it wants to close above 26000 it will downfall tomorrow or vice versa.
The real panic for tomorrow is it does not open in FLAT that means 25850 - 25950, this range will be premium eating for both call and put buyers, better to stay out and observe for major single candle (70-80 points) for 15 mins chart pattern.
I hope you all have enjoyed weekends expect who have taken call or put on Friday (waiting to book profit) are nervous.
Let's hope for tomorrow for some big movements.
Asli maza tabh aayega jabh 250 - 300 points ka hulchul hoga :)


BTC live tradeBTC live trae
*Took buy side trade
*any one guess why?
lots of liquidity stands would be the level, where we trail sl.
and exit from buy side trade

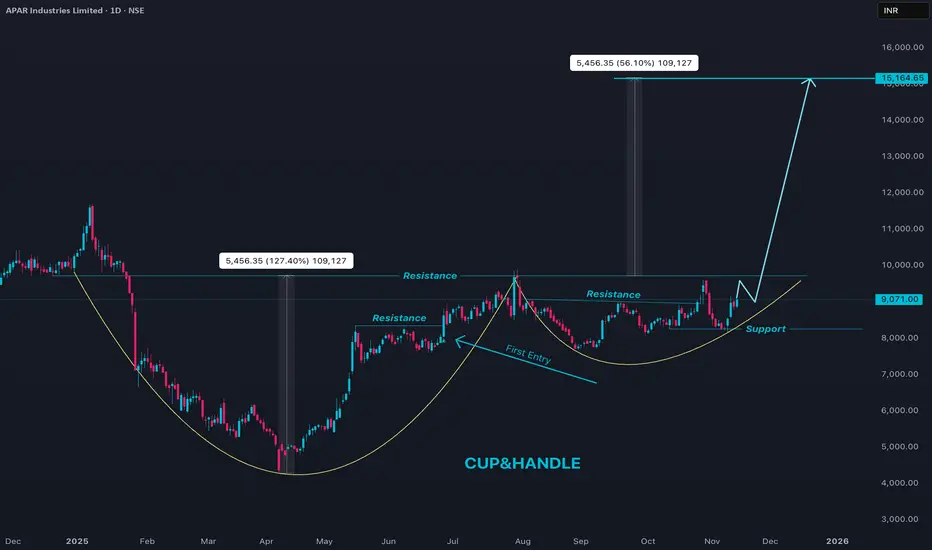
APARINDS Pyramid set upApar Industries (APARINDS) is currently in a strong uptrend on the daily chart, trading near the 9,000+ zone after a sharp rally over the past few months. Price is holding above key short-term moving averages, and momentum indicators like RSI and CCI are in bullish territory but not yet extremely overbought, which supports the ongoing up-move with healthy strength. Recent candles show sustained higher lows with only brief profit-booking dips, indicating buyers are still in control and using declines to accumulate.
In the near term, immediate support lies in the 8,600–8,700 band, where recent pullbacks have found buying interest and where short-term averages are clustering; holding above this zone keeps the trend intact. On the upside, every push to new highs can attract profit booking, so moves toward or above recent peaks around 9,100–9,300 are likely to see some volatility, but the broader structure remains bullish as long as price respects higher lows on the daily timeframe. For fresh positions, staggered entries on dips toward support with clearly defined stop-loss levels below the recent swing low is preferable to chasing extended candles, given the stock’s strong run-up and tendency for swift corrections after vertical rallies.

Dr Reddy ,option buying(1260Ce)
Monthly price has crossed 20ema, currently price has entered one weekly tested supply zone.
Weekly all the supply zones are tested ,and currently price is moving from a point where previous upward rally was observed.
In daily time zone , one gap which was created by previous downfall is filled, a minor consolidation at current price is expected and then upmove is expected till 1300.
If price cross weekly 20ema , which give entry confirmation ,one can enter the trade
One can buy option and hold till 1300 price is touched and then can make an exit.


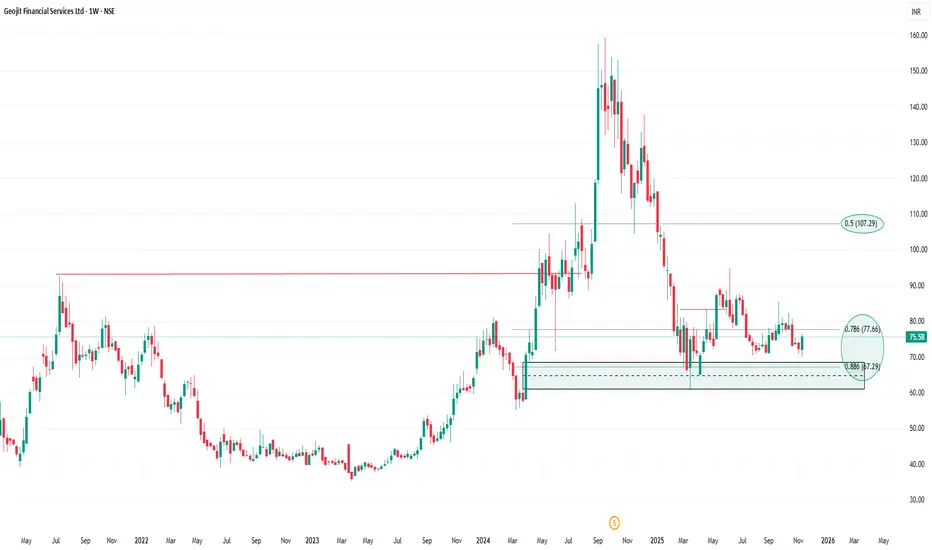
Geojit (Weekly Chart) – Key Levels & StructurePrice is consolidating inside a strong demand zone around ₹67–70. A bounce from this zone can offer a clean swing setup.
📌 Entry (Educational Idea):
Above ₹76 (close above the 0.786 retracement level)
Confirms strength and rejection from demand.
📌 Stop-Loss (SL):
Below ₹67 (close below the demand zone invalidates the setup)
📌 Targets:
T1: ₹85
T2: ₹94
T3: ₹107 (0.5 retracement zone)
📌 View:
As long as the demand zone holds, price can attempt a reversal structure. Break below ₹67 = weakness.
⚠️ Disclaimer
This is only for educational and informational purposes. I am not a SEBI-registered research analyst.
Regards
Bull Man
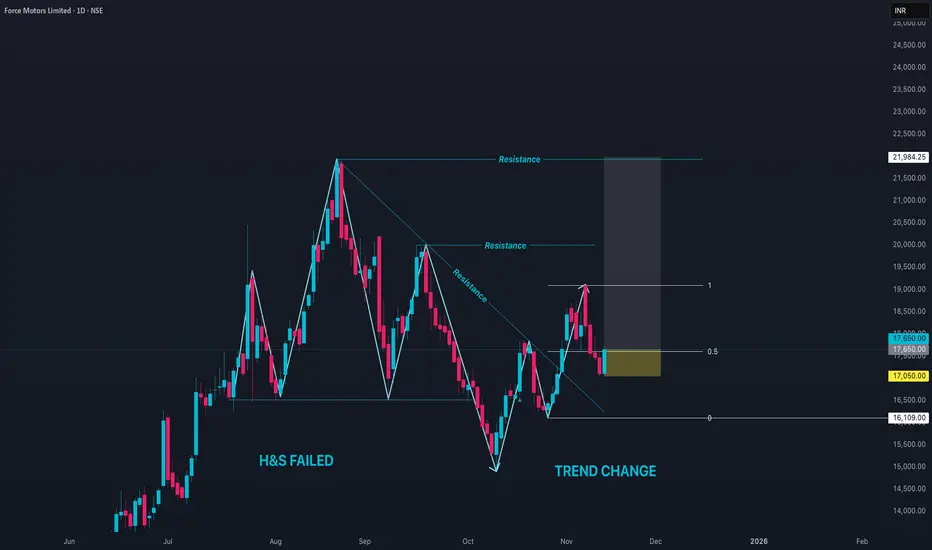
FORCEMOT Reversal set upProbable reasons for long
1. Trend change with higher low
2. H&S failed as market trend is bullish
3. Price trading in discount zone
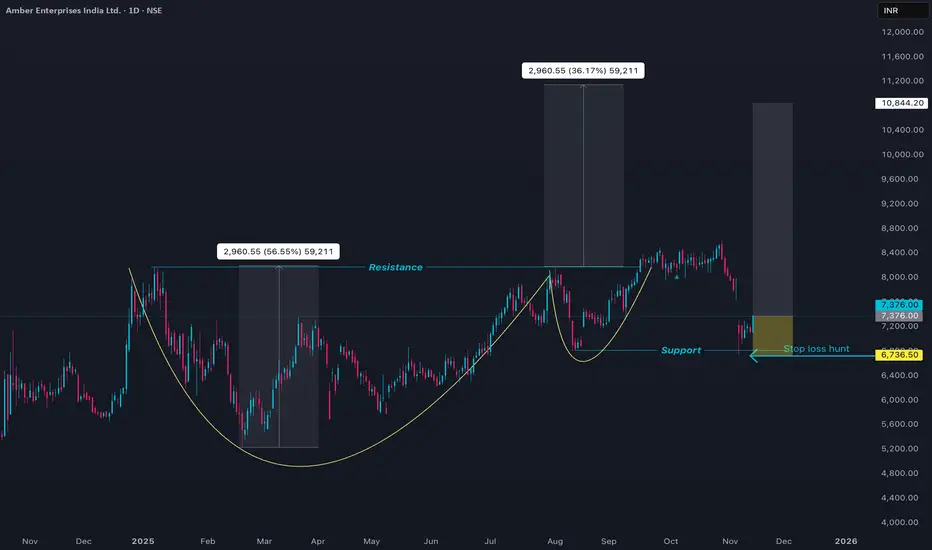
AMBER Re entry set upProbabilities to enter a trade
1. pattern cup & handle
2. Break out failed
3. stop loss hunt is also over
we have 3 probabilities that price may shoot up
Stop Trying to Recover Losses. Start Trying to Build ConsistencyHello Traders!
Every trader goes through losses. But what separates a struggling trader from a successful one is not the size of their wins, it’s what they focus on after a loss.
Most traders waste months trying to “get back” the money they lost.
But the truth is simple: the more you chase recovery, the more you lose.
Your real job is not to recover losses, it’s to build consistency.
1. Loss Recovery Creates Emotional Pressure
When you trade just to recover what you lost, you stop thinking logically.
You increase lot size, enter without confirmation, and ignore your plan.
This emotional pressure makes you take trades you would never take in a calm state.
Recovery trading doesn’t fix losses, it multiplies them.
2. Consistency Has No Ego
Consistency doesn’t care about your last loss or last win.
It’s about following the same rules every day, no matter what happened yesterday.
Small, controlled wins compound over time, and slowly replace every old loss.
Consistency creates stability. Stability creates clarity. Clarity creates profits.
3. When You Stop Chasing, You Start Thinking
You no longer rush entries, you wait for your setup.
You risk only what fits your plan, not what your emotions whisper.
You accept that losses are part of your business, not threats to your ego.
A calm mind sees opportunities a stressed mind can’t.
4. The Real Recovery Happens Naturally
When your focus shifts from recovering to improving, your trades automatically become better.
Consistency makes your equity curve smoother.
Slow, steady growth quietly replaces big losses without you forcing anything.
Professional traders don’t “recover”, they simply continue.
Rahul’s Tip:
Your next breakthrough won’t come from a big winning trade, it will come from a week where you followed your plan perfectly, even if the profits were small.
Consistency is your strongest weapon in trading. Use it.
Conclusion:
Stop fighting your past losses, they’re already gone.
Focus on building the habits that ensure you never repeat them again.
Recovery is temporary. Consistency is permanent.
If this post shifted your mindset, like it, share your thoughts in comments, and follow for more honest trading psychology lessons!
BTC/USD BUY LIVE TRADE *BTC-USD live trade
* took buy position
*exit with tsl
*there will be bearish fvg, so might fall and than going to hunt sl that stand on trade line

BTC USD SELL TRADE - #LIVEMARKET #LIVEBTC USD
*took sell position.
*any one tell me why took sell position?

A bullish engulfing patternPrior Downtrend: The pattern must appear during an existing downtrend.
First Candle (Bearish): A small red (or black) bearish candlestick forms, indicating the continuation of selling pressure.
Second Candle (Bullish): A large green (or white) bullish candlestick forms immediately after.
Engulfing: The body of the second (green) candle must completely cover or "engulf" the entire body of the first (red) candle. The second candle's body opens lower and closes higher than the first candle's body.
Market Sentiment Shift: This shift from a small bearish candle to a large bullish one suggests that buyers have taken control of the market.

Bullish Engulfing Pattern
What is a Bullish Engulfing Pattern?
A Bullish Engulfing is a two-candle reversal pattern in candlestick charting that signals a potential shift from bearish to bullish momentum. It typically appears at the bottom of a downtrend.
How to Identify It
First Candle (Bearish):
A red (bearish) candle
Closes lower than its open
Shows sellers in control
Second Candle (Bullish):
A green (bullish) candle
Opens lower than the first candle’s close
Closes higher than the first candle’s open
The entire body of the second candle completely engulfs the body of the first

BORORENEW Trade plan for 1:23 RR1. Market Trend - Bullish
2. Stock - Under consolidation
3. Price Trading at support
4. Risk is small & reward is way to good
5. Trade set up - Buy at support and sell or book at resistance
6. Every resistance, is your partial profit booking area or bringing SL at Break even

ZCASH next move || Swing TradeTrend is still bullish, but price is in a healthy pullback.
From 588–618 → strong bounce to 650+ expected
Once reversal happens:
TRADE SETUP (SAFE + SMART)
ENTRY ZONES
First Entry: 618 – 620
Main Entry (Best): 588 – 590
STOP-LOSS
SL: 545 (below 61.8%)
TARGETS
TP1: 650
TP2: 690
TP3: 720
Only Bearish if below 553
This analysis is for educational and informational purposes only. It is not financial advice and should not be considered a recommendation to buy or sell any financial instrument.

GOLD: The Bigger Picture is Finally Getting Clearer !Gold finally showed some clarity after weeks of structure, and now the bigger picture is lining up perfectly across the daily and multi-year weekly charts. The rejection from the 4250–4350 zone triggered the first meaningful retracement after a parabolic rally, and price is now hovering right above the 4030–4060 daily support the only level holding back a much deeper corrective cycle. This entire region is critical because it marks the last breakout base, the liquidity origin, and the midpoint of the 3600-4300 vertical leg. As long as this shelf holds, gold will continue to move in a compressed range, but once a clean daily close breaks below it, the market naturally opens up a fast move toward the 3500–3550 target zone. All confluences measured move, channel midline, point to this same cluster, making it a high-confidence retracement level inside a long-term bullish trend.
On the upside, the structure is very clean. Only a sustained breakout above 4300–4350 invalidates the entire correction and flips the bias back to full-bull mode, where gold can easily run toward 4600–4800 as the next discovery leg. Anything below that zone still falls under the extended correction category, not a bullish continuation. This is why the invalidation level is drawn exactly where it is to protect from guessing the reversal too early.
On the weekly chart, gold has slipped back inside the multi-year ascending channel after briefly wicking above it. That wick was nothing but a classic blow-off extension followed by a reversion to mean. Now price is sitting comfortably inside the same long-term structure . The upper red band remains the multi-year resistance, the green midline is the structural backbone of the trend, and the purple lower band is the deep cycle accumulation zone. As long as gold stays inside this channel, the macro remains strongly bullish and corrections within this structure are normal and healthy. The mid-channel region around 3500 also aligns perfectly with the expected daily correction, which adds even more confirmation that this retracement is simply part of the long-term trend and not a trend reversal.
Commodity index on both daily and weekly frames is cooling off from extreme levels, which supports a deeper pullback rather than an immediate rally. No new bullish divergence has appeared yet, meaning momentum still favors a downside sweep before any major upside continuation. Combine that with the lack of fresh macro drivers and a stabilization in rate-cut expectations, this cooling phase was overdue.
In simple below daily support, gold continues the correction toward 3500-3650 above 4350, the correction thesis dies and the bull trend resumes aggressively. Until then, this is a textbook retracement inside a long-term uptrend nothing broken, nothing unexpected, just a parabolic market taking a breath. Trade safe !

The Herd Mentality – Why Everyone Buys When It’s Too Late?Hello Traders!
You’ve seen it a hundred times, the market rallies, social media explodes, and suddenly everyone starts buying.
Then, just when retail traders feel “safe” entering, the price crashes.
It’s not bad luck, it’s herd mentality .
And unless you understand how it works, you’ll keep following the crowd straight into losses.
1. What is Herd Mentality in Trading?
Herd mentality is the instinct to do what everyone else is doing, buying when others buy, selling when others sell.
It’s rooted in human psychology, our brains feel safer when we’re part of a group.
In trading, this instinct is deadly because the crowd always reacts late.
When you feel comfortable entering a trade, it’s usually because the market has already moved.
2. The Cycle of Fear and Greed
Every bull run begins with a few smart traders who buy quietly when no one’s interested.
As prices rise, social media hype builds, the crowd starts joining in.
Then, when “everyone” is talking about the coin, smart money exits, leaving the herd trapped at the top.
The same happens in bear markets, panic selling at bottoms while professionals buy patiently.
It’s not about intelligence, it’s about emotion.
3. How the Market Exploits the Crowd
Institutions and big traders understand herd behavior better than anyone.
They create liquidity by pushing prices to levels where retail traders feel emotionally forced to act.
The market uses human nature, fear and greed, as its fuel.
The crowd provides the liquidity, and professionals use that liquidity to enter or exit quietly.
4. How to Avoid Becoming Part of the Herd
Develop your own plan, if your entry depends on others’ excitement, it’s not your setup.
Buy when the market feels uncomfortable; sell when everyone feels confident.
Learn to think independently. The best trades usually feel the hardest to take.
Patience and conviction are your weapons against the herd.
5. The Truth Most Traders Don’t Want to Hear
If you wait for social proof to feel confident, you’ll always be late.
By the time the crowd “believes,” the move is already priced in.
You don’t get rich by following others, you get rich by understanding why others behave the way they do.
Rahul’s Tip:
The market doesn’t punish retail traders because they lack knowledge, it punishes them because they act emotionally together.
Train your mind to do what’s uncomfortable, not what’s popular. That’s where the profit hides.
Conclusion:
The herd mentality is the silent killer of most portfolios.
The more people talk about an asset, the less opportunity it holds.
Smart traders buy silence and sell noise.
Once you learn to think independently, you’ll stop being the liquidity, and start trading like the ones who create it.
If this post opened your eyes to herd psychology, like it, share your view in comments, and follow for more deep market insights!

Classic Case of Priced In Optimism & Intraday Liquidity TrapThe market’s behaviour on the Bihar election result day followed a pattern that repeats itself almost every time political outcomes are broadly expected. By the time counting began in the morning, the market had already made its real move. The rally from the 25,350 zone to the 26,000 area in the previous sessions had priced in the possibility of political continuity. Exit polls and early sentiment didn’t leave much room for a fresh surprise, and because of that, the result day itself turned out to be a range-bound session instead of a trend day.
The 5-minute chart shows exactly how the trap formed. The index opened firm, pushed towards 26,000, and immediately met selling pressure. Traders who entered on the assumption that a clear political mandate would trigger a one-way rally were trapped right at the open. Through the middle of the session, the market drifted back into a narrow band, forming lower highs and repeatedly slipping toward the 25,750 support. This is typical behaviour when a major event gets fully discounted before the actual announcement. Without fresh triggers, the market simply rotated around intraday liquidity.
Global cues didn’t help either. Asian markets were soft, risk sentiment was weak, and domestic buying lacked strength. Even with a favourable political outcome, the backdrop wasn’t strong enough to push the index beyond the 26,000 supply zone. This created a clean intraday squeeze: optimism at the open, hesitation through the day, and then a sharp reversal in the last half-hour.
The late spike—more than 100 points in a single 5-minute candle around 3 PM—was largely mechanical. It had the signature of short-covering, expiry-related adjustment, and institutional book-closing rather than genuine trend buying. Moves like this usually appear when intraday shorts square off and larger players rebalance their positions into the close.
The higher timeframe tells the same story. On the 1-hour chart, the index had already hit resistance earlier, and each attempt near 26,000 was met with supply. The trend remains intact on the broader scale, but momentum clearly slowed down once the market realised that the result did not introduce any new variable—it simply confirmed what was already anticipated.
Overall, this session was a textbook example of how markets behave when the news is entirely expected. The initial reaction pulls in emotional traders, the mid-day choppiness shakes out both sides, and the final burst is more about positioning than sentiment. Until Nifty closes decisively above 26,050 on strong breadth, the index is likely to stay in a sideways-to-cautious zone with support near 25,750.
In short, the market didn’t rally because there was nothing new to rally about. The optimism was already embedded in the previous move, and the result day turned into a classic liquidity trap rather than a directional breakout.

How market move today? Bank nifty live market analysis*Market open near PDL and move like rocket . 1st invite seller to seller to sell once PDL break.
* Market move against it and and hit all seller sl.
* We took sell position @09:40 once 5mins candle show bearishness. As expected low will be the target. But market market move sharp up side after 10:45 and again shows some weakness.
* Re-entry after 11:05 and again target will be low of the day. But market not move till day low. Exit position @14:15.
** For educational purpose only**

Live Market trade- Bank nifty * Market open near PDL and sharp up move toward seller stoploss where maximaum people put.
*After stop out, market make bearish candle @ 09:40hr , so we took sell order and expected targer whould be day low, but market took reversal and give re- entry @ 11:05hr again target would be day low.
* We exit from position. target just missed by 40 points.
* But trade was good. we are getting ready to take loss of 140 points and booked profit @203 points but re-entry stop loss was 85 points and exit @ 185 points.
thanks for supporting.
We are try to record video with audio, so this will be coming soon.
