Nifty 50 Price ActionNifty 50 is trading near 24,715 as of September 4, 2025, showing mild recovery after several sessions of volatility and weakness. The index has bounced back above the 24,600 support zone with improved breadth and higher volumes, but technical indicators reflect a cautious undertone. All short- and medium-term moving averages (5, 10, 20, 50) still point bearish, and bearish crossovers on 5-20 and 20-50 day averages reinforce negative momentum. Oscillators like MACD, stochastics, ROC, and CCI remain in bearish territory, while RSI sits neutral around 45, and William %R signals oversold conditions, suggesting the possibility of a short-term bounce.
Immediate resistance for Nifty is seen at 24,650–24,700, with a major hurdle near the 50-day moving average in the 24,850 area. A decisive move above these levels would strengthen bullish sentiment, potentially opening up the range to 25,250–25,500. On the downside, key support remains at 24,500, with stronger base near 24,250. A break below these supports could lead to extension of the recent pullback toward the 24,000 level.
The broader trend appears range-bound with slight positive bias, but foreign institutional investors have been net sellers, which has tempered upside momentum. Sectors like auto, capital goods, and select mid-cap stocks are attracting buyers, while defensive sectors remain subdued. For now, a cautious approach is advised, using “sell on rise” until Nifty can reclaim more short-term moving averages. Long-term trend remains bullish, suggesting dips should be viewed as buying opportunities for quality stocks, especially if domestic and global cues improve.
Beyond Technical Analysis

SCI - Shipping Corporation of IndiaShipping corporation of India - SCI :- Price Breakout with Volume after a year.

In depth analysis on XAUUSD: 23/10/25It will be a detailed analysis of XAUUSD after a deep fall in prices. There is confusion in the market, and this chart will turn this chaos into clarity for all.
3 types of setups are shared with all possible trends. This leaves no room for confusion.

Sensex Structure Analysis & Trade Plan: 24th October
4-Hour Chart (Macro Trend)
Structure: The Sensex is in an Aggressive Bullish Momentum phase, trading within a steep ascending channel. The price hit a new high but formed a large upper wick and closed significantly off the high, indicating aggressive profit booking at the 85,000 - 85,300 resistance area. The current price is testing the lower trendline of the ascending channel.
Key Levels:
Major Supply (Resistance): 85,300 - 86,000. This area is the critical supply zone, encompassing the recent high and the all-time high of 85,978.
Major Demand (Support): 83,900 - 84,200. This area aligns with the lower trendline of the ascending channel and a Fair Value Gap (FVG), making it the must-hold zone for the short-term rally.
Outlook: The bias is Cautiously Bullish. The short-term structure is positive, but the sharp intraday rejection suggests consolidation or a retest of support is likely before a fresh breakout.
1-Hour Chart (Intermediate View)
Structure: The 1H chart shows a rejection after the market traded to new 52-week highs. The price has broken the immediate support and closed right on the boundary of the FVG . This FVG and the lower channel line are crucial for tomorrow's open.
Key Levels:
Immediate Resistance: 85,000 (Psychological mark and immediate swing high).
Immediate Support: 84,000 - 84,200 (Lower channel support and FVG area).
15-Minute Chart (Intraday View)
Structure: The 15M chart confirms the sharp selling pressure from the day's high, resulting in a descending correction that is testing the lower end of the intraday consolidation. The market closed with a small red candle, confirming intraday bearish control.
Key Levels:
Intraday Supply: 84,800 (Recent swing high).
Intraday Demand: 84,000 - 84,200.
Outlook: Neutral-to-Bearish for the session open, favoring trading the range.
📈 Structure Analysis & Trade Plan: 24th October
Market Outlook: Sensex is undergoing a healthy profit-booking after hitting the 85,290 high. The rally is strong, but caution is warranted due to the sharp rejection. The primary strategy will be to buy the dip at major support or short the failure at intraday resistance.
Bullish Scenario (Primary Plan: Buy the Dip)
Justification: The multi-day macro trend is intact, and the 83,900 - 84,200 zone is a high-probability demand area that should attract buyers.
Entry: Long entry on a bounce and reversal from the 83,900 - 84,200 zone (Lower channel trendline/FVG support).
Stop Loss (SL): Place a stop loss below 83,600 (below the previous consolidation low).
Targets:
T1: 85,000 (Psychological mark).
T2: 85,300 (Retest of today's high/ATH zone).
Bearish Scenario (Correction/Sell on Rise)
Justification: The sharp rejection from the high indicates sellers are active and will defend the upper channel.
Trigger: Short entry if the market rejects the 84,800 - 85,000 level OR Short on a decisive break and 1-hour close below 83,900.
Stop Loss (SL): Above 85,300 (above the intraday high/ATH zone).
Targets:
T1: 83,600 (Major FVG support).
T2: 83,000 (Psychological support).
Key Levels for Observation:
Immediate Decision Point: 83,900 - 84,800 zone.
Bullish Confirmation: Sustained trade above 85,000.
Bearish Warning: A move below 83,900.
Line in the Sand: 83,600. A break below this level shifts the short-term bias to corrective.

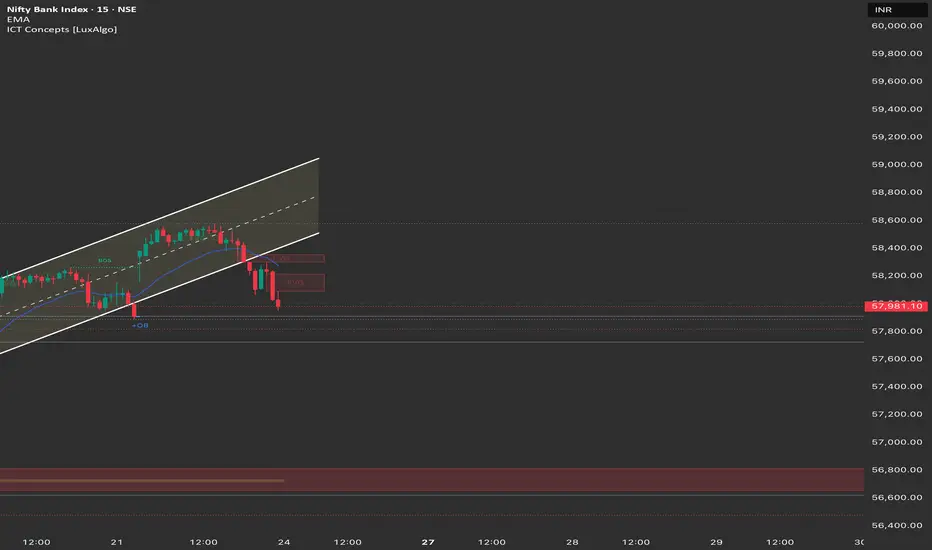
Banknifty Structure Analysis & Trade Plan: 24th October4-Hour Chart (Macro Trend)
Structure: The Bank Nifty is in an Aggressive Bullish Momentum phase. The index hit a new All-Time High (ATH) of 58,577.50 before the close, creating a large upper wick and confirming strong selling/profit-booking at the peak. The price has breached the lower trendline of the steep ascending channel and closed below the 9-period EMA.
Key Levels:
Major Supply (Resistance): 58,577 - 58,700 (All-Time High Zone). This area will be fiercely defended by sellers.
Major Demand (Support): 57,800 - 58,000. This area, which includes the lower channel trendline and a recent Fair Value Gap (FVG), is the must-hold zone to prevent a larger correction.
Outlook: The bias is Cautiously Bullish. The structure is highly positive, but the sharp intraday selling suggests a pause or a deeper retest of support is likely before the next breakout.
1-Hour Chart (Intermediate View)
Structure: The 1H chart shows a clear Break of Structure (MSS) to the downside in the immediate term, marked by the break of the swing low (implied by the dashed line) and the sharp drop from the ATH. The price is now trading right on the support of the 57,800 - 58,000 zone.
Key Levels:
Immediate Resistance: 58,400 (Recent swing high).
Immediate Support: 57,800 (The FVG and strong horizontal support).
15-Minute Chart (Intraday View)
Structure: The 15M chart shows a clean descending channel formation from the ATH, confirming intraday bearish control. The market closed right at the lower end of the channel, indicating bears are currently in charge.
Key Levels:
Intraday Supply: 58,200 (Upper trendline of the descending channel).
Intraday Demand: 57,800.
Outlook: Neutral-to-Bearish for the session open, favoring trading the range.
📈 Structure Analysis & Trade Plan: 24th October
Market Outlook: Bank Nifty is consolidating after hitting a new ATH. The strong selling pressure requires a cautious approach. The strategy is to trade the tight range around 57,800 to 58,400.
Bullish Scenario (Buy the Dip/Breakout)
Justification: The multi-day rally and strong momentum of the banking sector remain intact (outperforming Nifty).
Entry: Long entry on a decisive break and 15-minute candle close above 58,200 (breaking the descending channel/FVG) OR Long on a bounce and reversal from the 57,600 - 57,800 zone (Major support/Buyer's OB).
Stop Loss (SL): Place a stop loss below 57,500 (below the recent consolidation low).
Targets:
T1: 58,577 (New ATH retest).
T2: 59,000 (Psychological extension target).
Bearish Scenario (Primary Plan: Sell on Breakdown)
Justification: The sharp rejection from the ATH suggests the peak may hold, leading to a deeper correction.
Trigger: A decisive break and 1-hour close below 57,800.
Entry: Short entry below 57,800.
Stop Loss (SL): Above 58,100.
Targets:
T1: 57,400 (Previous breakout high/FVG).
T2: 57,000 (Psychological support/Major FVG).
Key Levels for Observation:
Immediate Decision Point: 57,800 - 58,200 zone.
Bullish Confirmation: Sustained trade above 58,200.
Bearish Warning: A move below 57,800.
Line in the Sand: 57,500. A break below this level shifts the short-term bias to corrective.
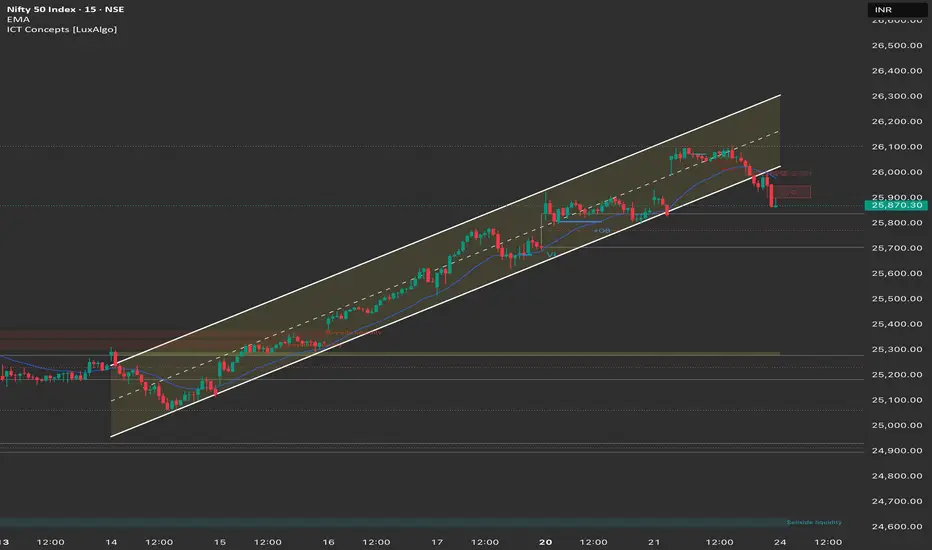
Nifty Structure Analysis & Trade Plan: 24th October
4-Hour Chart (Macro Trend)
Structure: The Nifty is in an Aggressive Bullish Momentum phase, trading within a steep ascending channel. The rally is strong, but the long upper wick on the recent 4H candle and the close far below the day's high (26,104.20) signal aggressive profit booking near the psychological 26,000 resistance area.
Key Levels:
Major Supply (Resistance): 26,100 - 26,300. This area is the key psychological and all-time high zone (ATH is 26,277.35).
Major Demand (Support): 25,600 - 25,700. This area aligns with the lower trendline of the ascending channel and is the must-hold zone for the continuation of the rally.
Outlook: The bias is Cautiously Bullish. The short-term structure is still positive, but the sharp intraday selling indicates a pause or consolidation is needed before a fresh breakout attempt.
1-Hour Chart (Intermediate View)
Structure: The 1H chart shows a clear rejection after the market traded to new 52-week highs. The index closed near the lower trendline of the ascending channel. The price has currently formed a FVG (Fair Value Gap) below the closing price, which may serve as a magnet for a morning correction.
Key Levels:
Immediate Resistance: 26,100 (Intraday high/point of rejection).
Immediate Support: 25,800 (Recent swing low/channel support).
15-Minute Chart (Intraday View)
Structure: The 15M chart confirms a Market Structure Shift (MSS) to the downside in the last hour of trading, with lower highs and lower lows forming from the day's peak. The market closed below the 9-period EMA, confirming intraday bearish control.
Key Levels:
Intraday Supply: 25,950.
Intraday Demand: 25,800.
Outlook: Bearish for the session open, favoring a "Sell on Rise" strategy into the consolidation area.
📈 Structure Analysis & Trade Plan: 24th October
Market Outlook: Nifty is undergoing a healthy profit-booking session after hitting the 26,100 resistance. The primary strategy will be to buy the dip at major support or short the failure at intraday resistance.
Bullish Scenario (Primary Plan: Buy the Dip)
Justification: The multi-day macro trend is intact, driven by FII inflows and positive trade deal talks. Dips should be seen as buying opportunities.
Entry: Long entry on a bounce and reversal from the 25,750 - 25,800 zone (Lower channel trendline).
Stop Loss (SL): Place a stop loss below 25,650 (below the main channel support).
Targets:
T1: 26,100 (Retest of today's high).
T2: 26,277 (All-Time High).
Bearish Scenario (Correction/Sell on Rise)
Justification: The sharp rejection from the intraday high indicates bears are active and will defend the 26,000 area.
Entry: Short entry on a decisive break and 15-minute candle close below 25,800 OR Short a retest and rejection of the 25,950 level.
Stop Loss (SL): Above 26,100 (above the intraday high).
Targets:
T1: 25,650 (Major FVG support/Lower channel).
T2: 25,500 (Major demand zone).
Key Levels for Observation:
Immediate Decision Point: 25,800 - 25,950 zone.
Bullish Confirmation: Sustained trade above 26,000.
Bearish Warning: A move below 25,800.
Line in the Sand: 25,600. A break below this level shifts the short-term bias to corrective.
Camlin Fine Sciences Ltd – Trendline Breakout from Demand Zone 📈 Camlin Fine Sciences Ltd – Trendline Breakout from Demand Zone | 🟡 Quarterly Volume Spike
🧠 Educational Analysis
Camlin Fine Sciences (NSE:CAMLINFINE) has been consolidating within a broad demand zone, following an extended decline from its prior swing highs.
This week’s price action shows a breakout above the descending trendline resistance, signaling a potential short-term reversal setup.
A yellow circle highlights the highest volume of the current quarter, confirming renewed buying interest near the base structure.
🔍 Technical Highlights
🔺 Trendline Resistance (Red Line): Clean breakout after several failed attempts.
🟩 Demand Zone (Green Channel): Zone of accumulation where buyers previously stepped in, holding price steady.
🟡 Yellow Circle: Indicates highest quarterly volume, validating increased market participation.
🚀 Momentum Setup: Sustained strength above ₹200 may attract follow-through buying toward ₹240 range in the near term.
📘 Educational Purpose
This chart is shared for educational and analytical purposes only, demonstrating how volume confirmation within a demand zone can help identify early signs of a trend reversal.
The setup combines price structure, trendline break, and quarterly volume analysis — a key concept for technical traders.
⚠️ Disclaimer
This post is not investment advice.
All insights are shared purely for educational purposes to support technical learning.
Always do your own research or consult a financial advisor before making trading or investment decisions.

Birlasoft Ltd – Trendline Breakout from Demand Zone📈 Birlasoft Ltd – Trendline Breakout from Demand Zone | Highest Yearly Volume Surge
🧠 Educational Analysis
Birlasoft (NSE:BSOFT) has been in a prolonged downtrend since its 2024 highs, following a clear descending trendline resistance.
Recently, price action has shown a breakout above this trendline, suggesting a potential shift from bearish to bullish momentum.
The breakout is supported by the highest yearly volume, indicating strong institutional participation and a possible reversal formation near the demand zone.
🔍 Technical Highlights
🔺 Trendline Resistance (Red Line): Clean breakout after multiple failed attempts.
🟩 Demand Zone (Green Area): Key accumulation base where buyers have consistently stepped in.
📊 Volume Confirmation: Breakout backed by the highest volume of the year — adds credibility to the move.
Watch Out for:
🚀 Momentum Outlook: Sustained move above the breakout level may lead toward 450–550 zones in the medium term.
📘 Educational Purpose
This chart is shared solely for educational and analytical study, demonstrating how trendline breakouts combined with volume confirmation can help identify potential trend reversals in technical setups.
⚠️ Disclaimer
This post is not investment advice.
All content is for educational purposes only — please perform your own research or consult a financial advisor before trading or investing.

USDCHF Long SetupPrice has formed a session low within the previous weekly low, creating a strong support area. This low also aligns with the Psychological Line, adding confluence and increasing the probability of a bullish reaction.
📊 Confluences:
Session Low inside Previous Weekly Low
Within Psychological Line Area
Strong Long Setup
🎯 Bias: Long

Gold Buy EntryGold has given good sell and requires a short correction as well looking into 4hr time frame double top and can come back neck line and go for short again - logic.
Good break of Trendline and pattern gave confirmation for buy target -
1) 4147
2) 4200

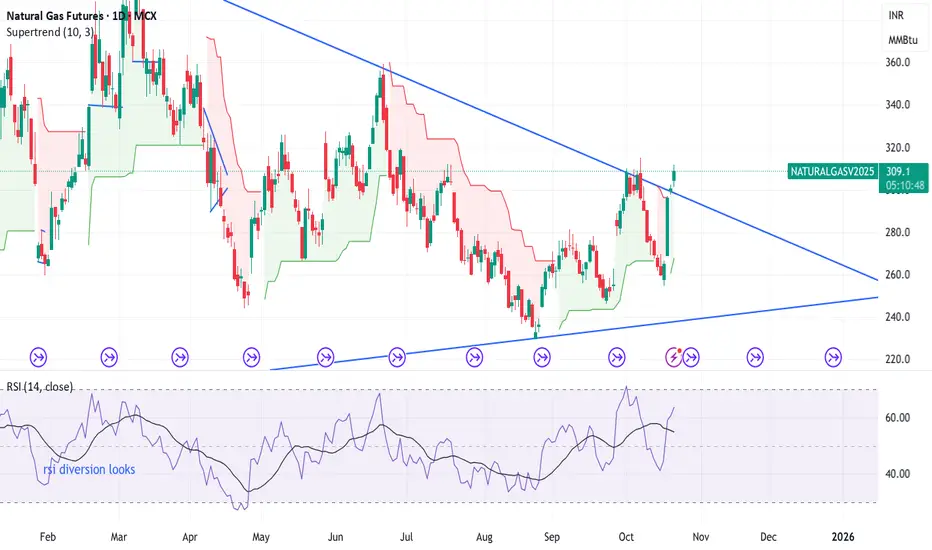
natural mcx update after triangle breakout mcx natural gas triangle breakout ------- on daily chart seen clear break triangle pattern or now looks prices up side till 330--345--360++++ very soon here .
trading ideas---- aggressive trader can buy with closing base sl 298 or let see where lvl to move
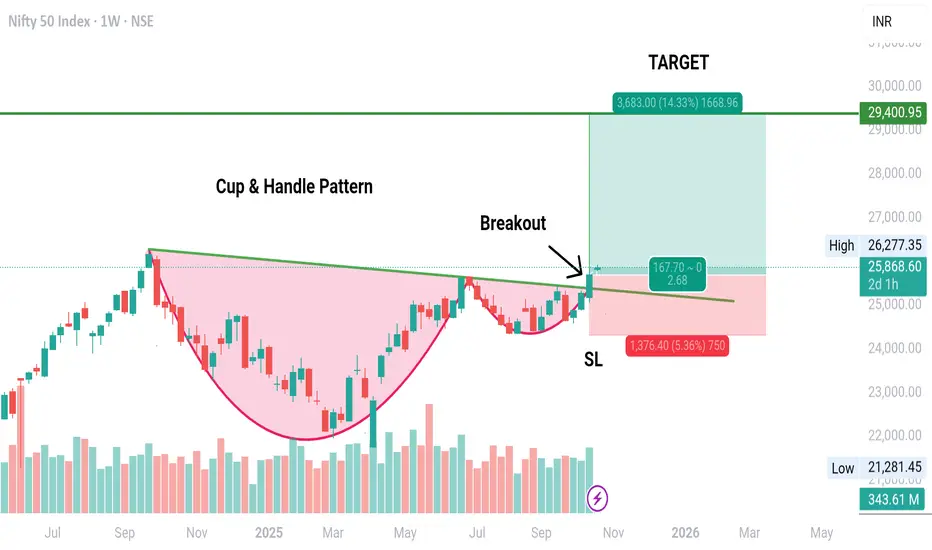
CUP & HANDLE Pattern Breakout in NIFTYA Breakout with good volume has happened in NIFTY 50 INDEX.
The breakout is has happened in weekly Time Frame 😱😱.
A Big target of 29400 is available to be achieved🎯
SL will be below the Handle's Low on sustaining Basis.
A better entry could be the one after retracement💡. As there are high chances of retracement from here as the price is very near to lifetime high.
One should always be cautious with the trade as the time is weekly. And, there can be many factors which can become hurdle like War, Tariff War, US economic bubble burst leading to crash etc etc.
However, entry target and SL are also mentioned in the chart.
Subscribe to my YouTube Channel for more details and more analysis.
Note: This analysis is for Educational Purpose Only. Please invest after consulting a professional financial advisor.
XAUUSD _ 22/10/2025_ TP HIT Over all trend Bullish
1. Current day low sweep yesterday low ( POI confirmed )
2. Entry taken during London session
3. AMD formed during 4 hr candle also price took support near opening of the 4 hr candle open
4. entry in 5 min - closed full at 1:1.8
#ICT

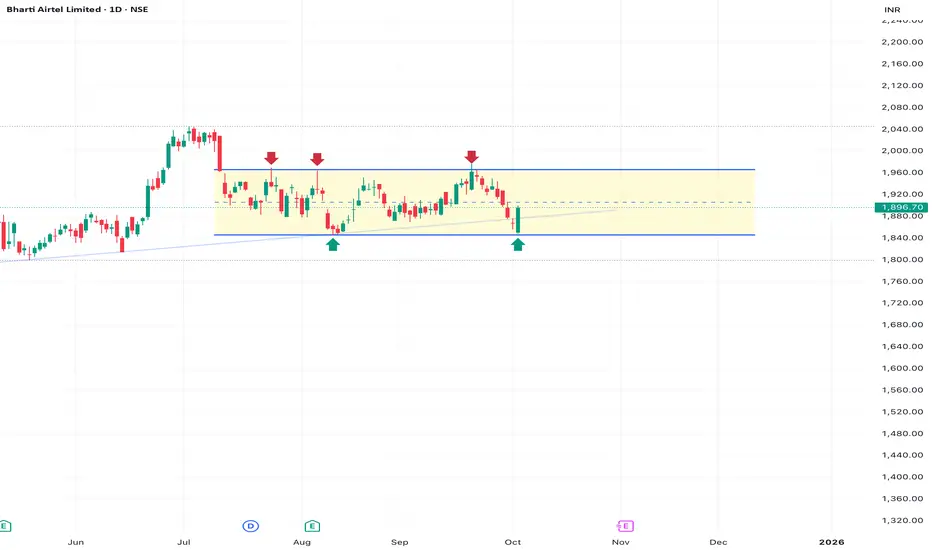
Bharti Airtel: Structure Analysis & Trade PlanStock: Bharti Airtel Limited (BHARTIARTL) - NSE
Timeframe: Daily (D)
Current Price: ₹1,896.70
1. Market Structure & Chart Pattern Analysis
Observation: The stock has been locked in a clear Rectangular Consolidation (or Sideways Range) since late July 2025, after posting a significant high. This is a crucial area of re-accumulation or distribution before the next major move.
Range High / Resistance (Supply Zone): ₹1,950 to ₹1,970. This area has consistently capped price attempts (marked by red arrows).
Range Low / Support (Demand Zone): ₹1,840 to ₹1,860. This area has provided strong institutional demand (marked by green arrows).
Current Price Action: The most recent daily candle showed a bullish bounce, confirming interest near the mid-to-lower portion of the range, reinforcing the demand below ₹1,860.
2. ICT (Smart Money) Interpretation
In a consolidation, Smart Money Concepts (ICT) focus on trapping traders at the extremes (liquidity sweeps) before expanding price.
Liquidity Pools:
Buy-Side Liquidity (BSL): Sits above the high of the range at ₹1,970. A breakout move will aim to sweep this liquidity.
Sell-Side Liquidity (SSL): Sits below the low of the range at ₹1,840. This is the prime target for a stop-hunt before a potential strong reversal to the upside.
Optimal Trade Zone: The support zone from ₹1,840 to ₹1,860 acts as a prime institutional demand zone. A high-probability long setup involves entering near this low, specifically waiting for a quick wick/sweep below ₹1,840 and a reclaim of the range.
Market Structure Shift (MSS): The larger MSS will only occur with a decisive daily close above ₹1,970 (bullish) or below ₹1,840 (bearish).
3. Swing Trade Plan (BHARTIARTL)
We must prepare for two main scenarios: trading the range and trading the breakout.
Scenario A: High Probability Range Trade (Long)
This setup anticipates a continuation of the bounce off the recent demand.
Action : BUY (Anticipating push to range high)
Entry Zone. : ₹1,860−₹1,880 (Closer to the support is better, but a push above ₹1,900 might signal immediate strength.)
Stop Loss (SL) : Below ₹1,830 (Must be placed below the SSL/Range Low to protect against an invalidation of the consolidation structure).
Target 1 (T1) : ₹1,930−₹1,950 (Mid-range resistance).
Target 2 (T2) : ₹1,970 (Range High / BSL).
Scenario B: Breakout Trade (Long - Requires Patience)
This setup initiates only after the consolidation is clearly broken to the upside, signaling the start of the next large trend wave.
Action : BUY (Positional/Expansion)
Entry Zone. : Breakout & Retest of ₹1,970. Wait for a decisive Daily candle close above ₹1,970, then enter on the retest of ₹1,970 acting as new support.
Stop Loss (SL) : Below ₹1,920 (Place below the last significant swing low of the previous range).
Target : ₹2,100−₹2,200 (Measured move from the consolidation box).
Risk Disclaimer: This is a technical analysis based on chart patterns and institutional concepts for educational purposes only. It is not financial advice. Trading involves risk, and you are responsible for your own capital. Always adhere to strict risk management principles.
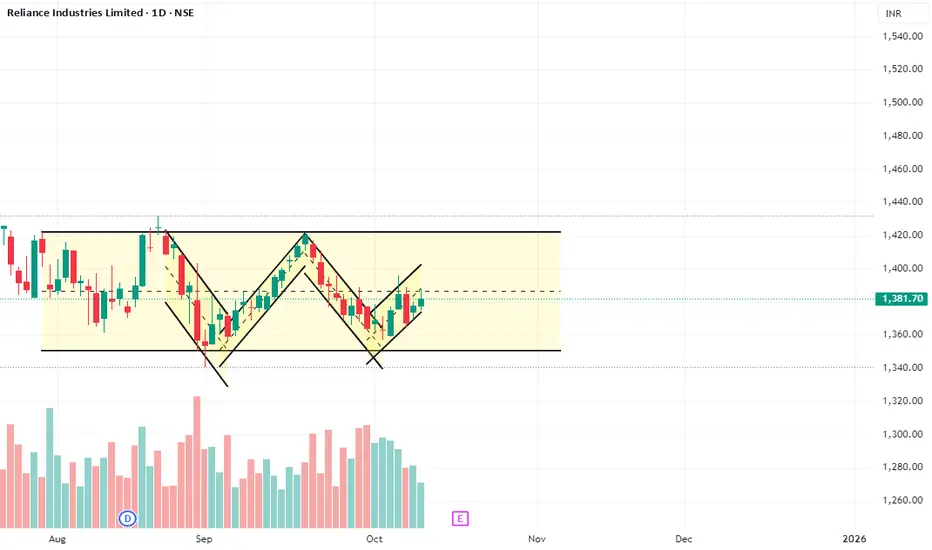
RELIANCE Structure Analysis & Trade Plan
🔍 Chart Analysis
The chart for Reliance Industries Ltd. (RELIANCE) on the Daily timeframe shows the stock trading within a horizontal consolidation range since early August.
Pattern: The price is trapped in a Rectangle Pattern (consolidation range). Within this range, a visible 'W' pattern (Double Bottom) is forming between September and October.
Range Boundaries:
Resistance (Supply Zone): The upper boundary is around ₹1,420 - ₹1,430.
Support (Demand Zone) : The lower boundary is around ₹1,345 - ₹1,355.
'W' Pattern Neckline: The neckline for the small 'W' pattern (the high between the two bottoms in September/October) is approximately at ₹1,400.
Current Position: The stock is currently trading just under the 'W' neckline at ₹1,381.70, near the midpoint of the larger consolidation range (indicated by the dashed line).
The Market Structure Shift (MSS) for the overall range would only be confirmed upon a decisive break of the main Resistance or Support. The small 'W' pattern suggests a potential short-term bullish move within the range, aiming for the upper boundary.
📈 Trade Plan (Range Trading & Short-Term Bullish Bias)
The plan has two components: a short-term move based on the 'W' pattern and a longer-term plan for the range breakout.
1. Short-Term Bullish Scenario (Within the Range)
This trade is based on the small 'W' (Double Bottom) pattern completing and pushing the price towards the main range resistance.
Entry Condition: A decisive close (Daily) ABOVE the 'W' Neckline of ₹1,400.
Stop Loss (SL): Place the stop loss below the recent swing low that forms the second bottom of the 'W', for example, around ₹1,365.
Target (T): Target the upper boundary of the main consolidation range at ₹1,420 - ₹1,430.
2. Breakout Plan (MSS Confirmation)
The most significant moves will occur when the stock breaks the main consolidation range.
Confirmed MSS to the Upside (Trend Continuation):
Entry Condition: A Daily close and sustained trade ABOVE ₹1,430 on strong volume. This would confirm the Market Structure Shift (MSS) to the upside.
Target: The minimum measured move would be the height of the range (₹1,430 - ₹1,350 = ₹80) projected upwards, yielding a Target ≈ ₹1,510.
Confirmed MSS to the Downside (Trend Reversal):
Entry Condition: A Daily close and sustained trade BELOW ₹1,350 on strong volume. This would confirm the Market Structure Shift (MSS) to the downside.
Target: The minimum measured move would be the height of the range (₹80) projected downwards, yielding a Target ≈ ₹1,270.
⚠️ Risk Management
Trading at the current price of ₹1,381.70 is risky as it is in the middle of the range.
Priority should be given to waiting for either the 'W' neckline (₹1,400) to break for the short-term target, or for the main range boundaries (₹1,430 or ₹1,350) to break for the larger trend trade. Wait for volume confirmation on all major breakouts.
Retail vs. Institutional Trading1. Definitions
Retail trading refers to trading activities conducted by individual investors using their personal capital. Retail traders typically operate through brokers or online trading platforms and are often motivated by personal financial goals such as wealth accumulation, retirement planning, or short-term profits. Retail traders generally have smaller capital compared to institutional traders and face different challenges in market access and resources.
Institutional trading, on the other hand, refers to trades executed by large organizations such as hedge funds, mutual funds, pension funds, insurance companies, and investment banks. Institutional traders operate with substantial capital, professional teams, and sophisticated technologies to influence market prices and execute high-volume transactions. They are considered major market movers due to the size and frequency of their trades.
2. Participants in Retail and Institutional Trading
Retail Traders
Retail traders are often individual investors who trade for personal financial goals. They include:
Day traders who buy and sell securities within a single trading day.
Swing traders who hold positions for several days to weeks.
Long-term investors who invest for years, such as those saving for retirement.
Retail traders usually access the market through:
Online brokerages (e.g., Zerodha, Robinhood, E*TRADE)
Mobile trading apps
Advisory services for trade recommendations
Institutional Traders
Institutional traders are professional entities managing large pools of capital. They include:
Hedge funds: Seek high returns through aggressive and often leveraged strategies.
Mutual funds: Invest on behalf of retail or institutional clients, focusing on long-term growth.
Pension funds: Invest large sums to meet future obligations.
Investment banks: Engage in proprietary trading and market-making.
Insurance companies: Manage investment portfolios to match policyholder obligations.
Institutional traders have access to:
Proprietary trading algorithms
Direct market access
Extensive research teams
High-frequency trading systems
3. Capital and Market Influence
A defining difference between retail and institutional traders is the size of capital. Retail traders typically operate with small to moderate amounts of personal money. While individual trades rarely impact the market, retail sentiment can create short-term volatility in smaller stocks, particularly in emerging sectors or thinly traded securities.
Institutional traders, however, manage millions to billions in assets. A single trade from a large hedge fund or mutual fund can move stock prices, especially in mid- or small-cap markets. Their trades often influence market trends and liquidity, making them crucial participants in price discovery.
Example:
In 2021, retail traders coordinated via online platforms like Reddit’s r/WallStreetBets to push stocks like GameStop (GME) dramatically higher. However, institutional hedge funds still held significant influence, with short positions and market-making abilities that shaped the ultimate outcomes.
4. Access to Resources and Information
Retail Traders
Retail traders are limited by:
Smaller research budgets
Dependence on publicly available news and analysis
Standard trading tools provided by brokers
Despite these limitations, technological advancements have empowered retail traders with:
Real-time market data
Technical analysis software
Community-driven insights through social media and forums
Institutional Traders
Institutional traders enjoy extensive resources:
Proprietary research teams analyzing market fundamentals and technical indicators
Real-time news feeds and analytics (e.g., Bloomberg Terminal, Refinitiv)
Advanced trading algorithms for high-frequency and quantitative strategies
Access to dark pools for executing large trades without moving market prices visibly
This resource gap often gives institutional traders a significant edge in identifying opportunities and managing risk.
5. Trading Strategies
Retail Trading Strategies
Retail traders typically rely on:
Technical analysis: Using charts, indicators, and patterns to predict price movements.
Fundamental analysis: Evaluating company earnings, balance sheets, and macroeconomic data.
Momentum trading: Riding trends in popular stocks or sectors.
Swing trading: Capturing medium-term price fluctuations.
Scalping: Executing frequent, small-profit trades during intraday market movements.
Retail traders may also follow copy trading or social trading platforms to mimic strategies of more experienced traders.
Institutional Trading Strategies
Institutional traders employ advanced strategies, often inaccessible to retail traders:
Arbitrage: Exploiting price differences across markets or securities.
Algorithmic trading: Automated execution of trades based on complex models.
High-frequency trading (HFT): Making thousands of trades per second to exploit tiny price differentials.
Hedging and derivatives strategies: Using options, futures, and swaps to mitigate risk or leverage positions.
Portfolio optimization: Balancing risk and returns across a massive portfolio of assets.
Block trades: Executing large-volume trades to minimize market impact.
Institutional strategies often rely on risk management systems and liquidity analysis, which are generally beyond the reach of individual traders.
6. Costs and Fees
Retail traders face:
Broker commissions
Exchange fees
Bid-ask spreads (cost of buying at the ask and selling at the bid)
Taxes and capital gains liabilities
Institutional traders benefit from:
Lower per-trade costs due to bulk negotiations
Reduced spreads through direct market access
Sophisticated tax optimization strategies
Lower funding costs for leveraged positions
This cost advantage allows institutional traders to execute high-volume strategies that would be inefficient or prohibitively expensive for retail participants.
7. Risk Exposure and Management
Retail traders:
Often face higher relative risk due to smaller portfolios
May lack advanced risk management tools
Can be significantly affected by market volatility
Are more susceptible to emotional trading and behavioral biases
Institutional traders:
Implement risk management frameworks using Value at Risk (VaR), stress testing, and hedging
Diversify across asset classes and geographies
Can absorb short-term losses due to long-term investment horizons
Manage liquidity risk, counterparty risk, and operational risk
8. Regulatory Environment
Both retail and institutional traders are subject to regulatory oversight, though the rules differ:
Retail traders are primarily governed by rules protecting investors, such as mandatory disclosures, anti-fraud regulations, and investor education requirements.
Institutional traders face stricter compliance, including capital adequacy requirements, reporting large trades, insider trading laws, and fiduciary duties toward clients.
Regulators monitor institutional trading more closely due to the potential systemic impact of large trades.
9. Advantages and Disadvantages
Retail Trading
Advantages:
Flexibility to choose strategies and trading styles
Ability to invest based on personal goals
Lower minimum capital requirements
Freedom from complex reporting obligations
Disadvantages:
Limited access to advanced tools and research
Higher relative costs
Greater exposure to behavioral biases
Smaller influence on market trends
Institutional Trading
Advantages:
Access to advanced research, data, and technology
Lower costs per trade and favorable execution
Ability to execute large-volume trades
Professional risk management systems
Disadvantages:
Highly regulated, limiting some strategies
High operational costs
Market impact of large trades can be a challenge
Subject to public scrutiny and fiduciary obligations
10. Impact on Market Dynamics
Retail and institutional traders interact in ways that shape markets:
Liquidity: Institutions provide deep liquidity, allowing retail traders to enter and exit positions efficiently.
Volatility: Retail traders can sometimes cause short-term volatility, particularly in thinly traded stocks, while institutional trades generally smooth price movements due to hedging and diversification.
Price Discovery: Institutional traders often lead in establishing fair market value due to superior research, but retail sentiment can temporarily influence pricing.
Innovation: Retail traders increasingly adopt online platforms and community-driven insights, influencing how institutions engage with markets.
11. The Evolving Relationship
The line between retail and institutional trading is blurring:
Retail democratization: Platforms like Robinhood, Zerodha, and eToro give retail traders access to markets and tools once exclusive to institutions.
Institutional retail influence: Institutions now monitor social media trends, sentiment analysis, and retail behavior to anticipate market movements.
Hybrid strategies: Some individuals participate in institutional-style strategies via ETFs, mutual funds, or algorithmic trading platforms.
12. Conclusion
The distinction between retail and institutional trading lies in capital, resources, access, strategy, and market influence. Retail traders represent the individual investor, motivated by personal goals and operating with smaller capital and fewer resources. Institutional traders are professional, resource-rich, and wield considerable influence on market dynamics.
Despite these differences, both groups coexist symbiotically. Retail traders benefit from institutional liquidity and price efficiency, while institutions monitor retail trends to gauge sentiment. Technological advancements continue to narrow the gap, offering retail traders tools and opportunities that were once the exclusive domain of institutions. Understanding these differences is crucial for developing effective trading strategies, managing risks, and navigating financial markets successfully.
In summary, retail and institutional trading are distinct yet interconnected parts of the financial ecosystem. Their differences shape market behavior, risk profiles, and opportunities, making financial markets both dynamic and inclusive.

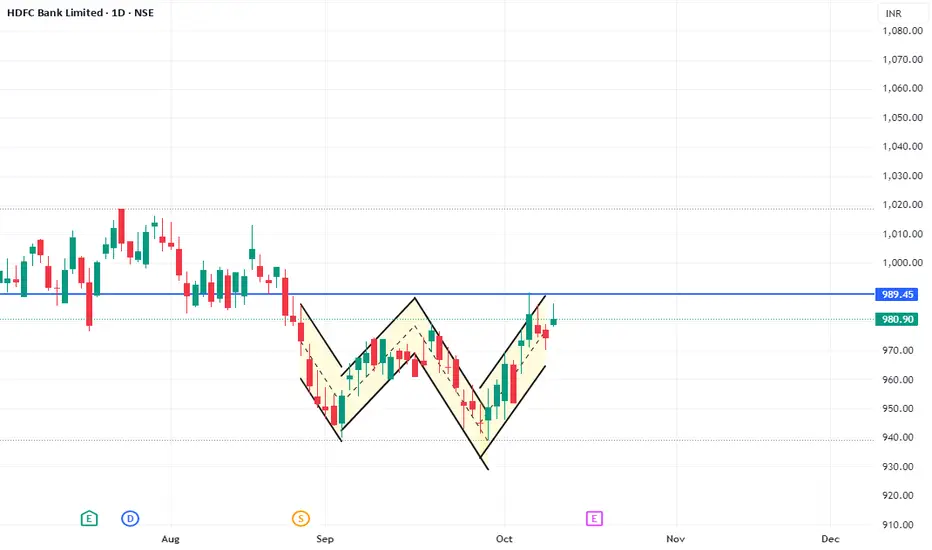
HDFC BANK Structure Analysis & Trade PlanThe chart for HDFC Bank Ltd. (HDFCBANK) on the Daily timeframe exhibits a clear "W" formation, which is a classic Double Bottom Reversal Pattern. This pattern suggests that the prior downtrend, which led to the two bottoms, is likely to reverse to an uptrend.
Pattern: Double Bottom / 'W' Pattern.
Timeframe: Daily.
Confirmation Level (Neckline): The crucial confirmation level, or Neckline, is around the ₹989.45 mark (indicated by the blue horizontal line). This is the highest point between the two bottoms.
Market Structure Shift (MSS): A confirmed Market Structure Shift (MSS) to the upside would occur upon a decisive close and sustained breakout above the Neckline of ₹989.45. This breakout would validate the reversal pattern.
Price Action: The price has successfully formed the second trough and has now rallied back up to test the Neckline.
Setup
Bullish Breakout of Double Bottom Pattern
Entry Condition (Long)
A confirmed closing candle (Daily) ABOVE the Neckline at ₹989.45. A re-test of the broken Neckline after the close offers a potentially safer entry.
Confirmation Level (MSS)
₹989.45
Stop Loss (SL)
Place the stop loss below a recent swing low or the midpoint of the last leg up. A good conservative level would be just below the high of the 'M' peak of the second bottom's rise, potentially around ₹975 or a more aggressive placement just under the recent swing low before the neckline challenge.
Target 1 (T1)
The minimum measured move is equal to the distance from the bottoms to the neckline, projected upwards.
Target 1 Calculation
Neckline (₹989.45) - Lowest Bottom (approx. ₹935) = ₹54.45
Target 1 = ₹989.45 + ₹54.45 = ₹1044
Target 2 (T2)
Look towards the previous swing highs around ₹1020 - ₹1030 as an intermediate zone, and then the top of the range before the current pattern started, around ₹1060 for the second target.
Risk Management & Caveats
False Breakout: Wait for a clear daily closing price above ₹989.45. A quick wick above the level that closes below it is a potential trap.
Volume Confirmation: Ideal confirmation should be accompanied by higher-than-average volume during the breakout, signifying strong institutional interest.
Failure: If the price rejects the Neckline severely and breaks below the second bottom's low (around ₹935), the bullish pattern is invalidated, and the downtrend would likely resume.
Gold Whats Next??gold rally lasted 4 years everytime in the past , and are trapped for years
Disclaimer- Just my view and opinion trade at your own risk not an investment advice these are only for educational purposes

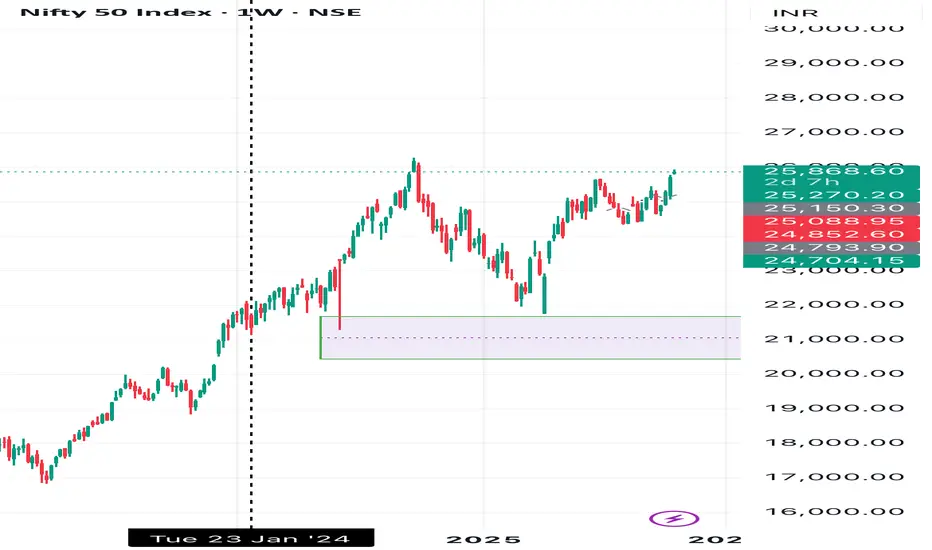
Nifty Testing Major Fibonacci Confluence Zone – Possible ShakeouNifty has recently retested a key Fibonacci retracement level, which coincides with a well-defined supply zone on the higher timeframe. The price action suggests strong resistance absorption in this area, followed by a period of sideways consolidation — often a precursor to a decisive move.
Unlike previous market cycles, the Indian indices are showing relative strength and reduced correlation with US markets, indicating a potential domestic-driven breakout scenario.
A short-term shakeout or liquidity hunt cannot be ruled out before the index establishes a clear direction. If the current structure holds, we could see a one-sided rally towards the 32,488 zone in the upcoming sessions.
📊 This is my personal technical view, not financial advice.
⚠️ I am not a SEBI-registered analyst. Please do your own research and risk assessment before taking any trades.
SCHAEFFLER Price Action 2 set upsSchaeffler India traded positively on October 21, 2025, closing near ₹3,930 after rising around 1.4% intraday. The day’s range was between ₹3,875 and ₹3,949, reflecting moderate volatility and a short-term recovery from recent consolidation near ₹3,850. The stock’s market capitalization stands around ₹61,300 crore, with a PE ratio close to 59.7 and a PB ratio near 11.3, indicating sustained valuation at a premium relative to the broader market.
Technically, Schaeffler has been moving in a neutral-to-bullish pattern. The RSI sits around 50–55, suggesting balanced momentum without overbought pressure. MACD remains slightly negative but flattening near the signal line, hinting that selling momentum is easing. Key support lies around ₹3,850 and ₹3,780, while resistance is seen at ₹3,980–₹4,050. A decisive breakout above ₹4,050 may reestablish bullish momentum toward ₹4,150–₹4,200.
Overall, the short-term outlook is mildly positive with improving stability in price structure. Sustaining above ₹3,900 will be crucial to continue upward momentum, while any dip below ₹3,850 could invite profit-taking or retesting of deeper supports around ₹3,750. Medium-term investors may await a clearer breakout above ₹4,050 before expecting stronger trend continuation.

Buy Silver for 54 DollarSilver Daily Chart:
Triangle Breakout with Momentum :
any Retest will give a opportunity to add for long Term Portfoilo.
Fibo Trend Setup suggesting 54 Dollar is coming in some months

Nifty 50 - weely cup & handle breakout near resistance zone 📈 Nifty 50 – Weekly Cup & Handle Breakout Near Major Resistance Zone (25,850–26,000)
Description:
The Nifty 50 Index (Weekly) chart is forming a Cup and Handle pattern, one of the strongest continuation patterns in technical analysis.
Pattern Structure:
The cup formed between September 2024 and May 2025, followed by a handle consolidation in June–September 2025.
The breakout is now visible as price closes above the 25,850–26,000 resistance zone — an area that acted as a strong supply region in the past.
Volume & Momentum:
Increasing bullish candles near resistance suggest accumulation and breakout intent.
Key Levels:
Resistance Zone (Neckline): 25,850–26,000
Breakout Confirmation: Weekly close above 26,000
Immediate Target: 26,800 (pattern depth projection)
Extended Target: 27,400–27,500 (1.618 Fibonacci extension)
Stop Loss: Weekly close below 25,500
Trading Plan:
✅ Enter on sustained move/close above 26,000
🔒 Stop loss below 25,500
🎯 Targets: 26,800 → 27,400
View:
Bullish (Positional) — As long as Nifty holds above 25,500, momentum remains in favor of a breakout continuation rally.
Full Coverage on my Newsletter this Week
Keep in the Watchlist and DOYR.
NO RECO. For Buy/Sell.
📌Thank you for exploring my idea! I hope you found it valuable.
🙏FOLLOW for more
👍BOOST if you found it useful.
✍️COMMENT below with your views.
Meanwhile, check out my other stock ideas on the right side until this trade is activated. I would love your feedback.
As per the Latest SEBI Mandate, this isn't a Trading/Investment RECOMMENDATION nor for Educational Purposes; it is just for Informational purposes only. The chart data used is 3 Months old, as Showing Live Chart Data is not allowed according to the New SEBI Mandate.
Disclaimer: "I am not a SEBI REGISTERED RESEARCH ANALYST AND INVESTMENT ADVISER."
This analysis is intended solely for informational purposes and should not be interpreted as financial advice. It is advisable to consult a qualified financial advisor or conduct thorough research before making investment decisions.
NSE:NIFTY

Selling in GoldGood has mede M pattern in 4 hour time frame.
Entry, SL and target is mentioned in the chart.
A good Risk Reward Ratio is there 1:2.
An entry after retracement in 1 hour time frame will be much better. And will better make the trade efficiency and Risk.
For more such content, subscribe to my channel given in bio.
Note: This analysis is for Educational Purpose Only. Please invest after consulting a professional financial advisor.
