GALLANTT – Clean Price Action Between Resistance & Strong SupporAfter a strong up move, price started making lower highs and formed a clear descending trendline.
Each time price moves up, sellers are entering near the trendline.
At the same time, buyers are strongly defending the horizontal support zone around 518–520.
This shows a proper correction happening in structure, not a random fall.
The market is now trapped between resistance (trendline) and strong support.
A breakout above the trendline can bring a fresh upside move,
while a breakdown below the support may lead to further downside.
No indicators used here — just pure price action, structure, and market behavior.
Sharing this to help the community understand how price respects levels.
Feel free to share your thoughts or doubts in the comments.
Beyond Technical Analysis

GOLD PRICE$ forecastgold huge discount price central banks still buying gold.dollar index is still weak.japanese yen is more weaker one of the big player of U$ BOND holder incase japan sells U$ bond dollar more bearish. only safe heaven asset in the entire world. the geopolitical tension is more chaos. #epstinfiles

GRWRHITECH – Clean Price Action Inside a Descending ChannelPrice moved in a strong uptrend earlier and after reaching the top, it started correcting in a clear descending channel.
Every time price touches the upper trendline, sellers step in.
Every time price reaches the lower trendline, buyers support it.
This shows that even during a fall, the market is moving in a controlled structure, not randomly.
No indicators, no noise — just pure price action and market behavior.
As long as price stays inside this channel, the correction is healthy.
A breakout above the channel can signal trend continuation, while a breakdown may bring further downside.
Sharing this clean structure to help the community understand how price really moves.
Feel free to share your thoughts or doubts in the comments

Nifty’s Elevated Volatility: Is Ichimoku Time Failure at Play?Nifty’s Elevated Volatility: Is Ichimoku Time Failure at Play?
Why is NIFTY witnessing unusually elevated volatility?
Are macro headlines such as the Union Budget, trade agreements, and tariff developments the only drivers?
Probably not.
With 38 weeks elapsed since the weekly Kumo breakout , NIFTY has now technically entered Ichimoku’s hard time-failure window — a phase where an unresolved structure often manifests as heightened volatility, accompanied by an increasing urgency for resolution .
Three possible paths of resolution before the 42nd week
1. Bullish scenario:
Price action rallies towards the initial follow-through reference (~27,193.8) and extends further higher.
2. Bearish scenario:
A decisive weekly close below the acceptance boundary (~24,274.8) , followed by further downside.
3. Time-failure scenario:
Price action remains range-bound within the acceptance zone , leading to time-decaying, non-directional moves.
Which of these scenarios appears more likely from here on?
Comments and thoughts are welcome

Part 2 Intraday Institutional TradingGreeks – The Heart of Option Pricing
The Greeks show how the option premium behaves:
Delta
Measures price change vs underlying.
Call delta: 0 to +1
Put delta: 0 to –1
Theta
Time decay.
Biggest enemy of buyers, friend of sellers.
Gamma
Rate of change of Delta.
High gamma = rapid premium movement.
Vega
Impact of volatility on premium.
Rho
Impact of interest rates (minor in India).

Axis Bank | Gann Square of 9 Intraday Study (Normal Case)Disclaimer:
This analysis is for educational purposes only. I am not a SEBI-registered advisor. This is not financial advice.
Symbol: AXISBANK (NSE)
Date Observed: 12 November 2024
Time Frame: 15-Minute Chart
This post presents a historical intraday observation using the Gann Square of 9, focusing on how normal price movement capacity and time alignment can highlight potential reaction zones.
📊 Market Structure at the Open
Axis Bank displayed upward strength from the first 15-minute candle.
The low of the opening candle (~1166) was used as the 0-degree reference level, following Square of 9 methodology.
This level acts as the base point for mapping the day’s upward price vibration.
Correct identification of the 0-degree reference is essential for consistent Square of 9 studies.
🔢 Square of 9 Level Mapping
Based on Square of 9 calculations:
0 Degree: ~1166
45 Degree (Observed Normal Capacity): ~1183
In intraday analysis, the 45-degree level often represents the stock’s normal price expansion range under typical market conditions.
⏱️ Price & Time Interaction (Observed Behavior)
Price reached the 45-degree level early in the session (around the second 15-minute candle).
Completion of the normal price capacity well before the later part of the trading day has historically shown temporary price pressure.
After interacting with this zone, the market displayed rejection behavior followed by short-term downside expansion.
This aligns with a commonly observed Gann concept:
Early completion of expected price capacity may increase the probability of a reaction.
📘 Educational Takeaways
Gann Square of 9 helps define logical intraday price limits
Normal (45-degree) reactions occur more frequently than exceptional cases
Combining price structure with time context improves market clarity
Small deviations around calculated levels are part of normal market behavior
This approach supports rule-based observation, not prediction
📌 Shared strictly for educational and historical chart-study purposes.

NIFTY Intra-Swing Level Analysis for 04th Feb 2026NIFTY Intra-Swing Level Analysis: for 04th Feb 2026
🚀Follow GIFTNIFTY Post for NF levels
━━━━₹₹₹₹₹━━━━━₹₹₹₹₹━━━━
📊PCR Data - 10th Feb 2026 EXP. Basis:
Put OI: 11,36,079, Call OI: 13,32,391, PCR: 0.85 , As per OI Strength => Neutral to Bearish (Excluding Global Event)
Intraday Basis=> Put OI Chg: 5,91,996, Call OI Chg: 7,19,434, Change OI PCR: 0.82
━━━━━━━━━₹₹₹₹₹₹₹₹₹₹₹₹━━━━━━━━
💥Level Interpretation / description:
L#1: If the candle crossed & stays above the “Buy Gen”, it is treated / considered as Bullish bias.
L#2: Possibility / Probability of REVERSAL near RLB#1 & UBTgt
L#3: If the candle stays above “Sell Gen” but below “Buy Gen”, it is treated / considered as Sidewise. Aggressive Traders can take Long position near “Sell Gen” either retesting or crossed from Below & vice-versa i.e. can take Short position near “Buy Gen” either retesting or crossed downward from Above.
L#4: If the candle crossed & stays below the “Sell Gen”, it is treated / considered a Bearish bias.
L#5: Possibility / Probability of REVERSAL near RLS#1 & USTgt
HZB (Buy side) & HZS (Sell side) => Hurdle Zone,
*** Specialty of “HZB#1, HZB#2 HZS#1 & HZS#2” is Sidewise (behaviour in Nature)
Rest Plotted and Mentioned on Chart
Color code Used:
Green =. Positive bias.
Red =. Negative bias.
RED in Between Green means Trend Finder / Momentum Change
/ CYCLE Change and Vice Versa.
Notice One thing: HOW LEVELS are Working.
Use any Momentum Indicator / Oscillator or as you "USED to" to Take entry.
━━━━━━━━━━━━━━━━━━━━━━━━━━━━━━━━━━━━━━━━━━━
⚠️ DISCLAIMER:
The information, views, and ideas shared here are purely for educational and informational purposes only. They are not intended as investment advice or a recommendation to buy, sell, or hold any financial instruments. I am not a SEBI-registered financial adviser.
Trading and investing in the stock market involves risk, and you should do your own research and analysis. You are solely responsible for any decisions made based on this research.
"As HARD EARNED MONEY IS YOUR's, So DECISION SHOULD HAVE TO BE YOUR's".
━━━━━━━━━━━━━━━━━━━━━━━━━━━━━━━━━
❇️ Follow notification about periodical View
💥 Do Comment for Stock WEEKLY Level Analysis.🚀
📊 Do you agree with this view?
✈️ HIT THE PLANE ICON if this technical observation resonates with you. It will Motivate me.
━━━━━━━━━━━━━━━━━━━━━━━━━━━━━━━━━
💡 If You LOOKING any CHART & want for Level and ANALYZE?
Share your desired stock names in the comments below! I will try to analyze the chart Levels, patterns and share my technical view (so far my Knowledge).
If Viewers think It can identify meaningful setups. Looking forward to hearing from all of you — let's keep this discussion going and help each other make better trading decisions.

Axis Bank | Gann Square of 9 Intraday Study (Normal Case)Disclaimer:
This analysis is for educational purposes only. I am not a SEBI-registered advisor. This is not financial advice.
Symbol: AXISBANK (NSE)
Date Observed: 13 November 2024
Time Frame: 15-Minute Chart
This post documents a historical intraday observation using the Gann Square of 9, focusing on how normal price movement capacity interacts with time to highlight potential reaction zones.
📊 Initial Market Structure
Axis Bank showed upward momentum from the first 15-minute candle.
The low of the opening candle (~1148) was treated as the 0-degree reference level, following standard Square of 9 practice.
This reference point acts as the base for mapping the day’s expected upward vibration.
Correct identification of the 0-degree is essential for meaningful Square of 9 observations.
🔢 Gann Square of 9 Level Mapping
Based on Square of 9 calculations:
0 Degree: ~1148
45 Degree (Observed Normal Capacity): ~1165
In intraday studies, the 45-degree level often represents a stock’s normal price expansion range under regular market conditions.
⏱️ Price & Time Interaction (Observed Behavior)
Price reached the 45-degree level early in the session (around the second 15-minute candle).
Completion of the normal price capacity well before the later part of the trading day has historically shown temporary price pressure.
After interacting with this zone, the market displayed rejection behavior and short-term downside expansion.
This reflects a commonly observed Gann principle:
Early completion of expected price capacity can increase the probability of a reaction.
📘 Key Educational Takeaways
Square of 9 helps define logical intraday price limits
Normal (45-degree) reactions occur more frequently than rare cases
Combining price structure with time context improves clarity
The method supports rule-based observation, not prediction
Small variations around levels are part of normal market behavior
📌 Shared purely for educational and historical chart-study purposes.
#AxisBank #GannSquareOf9 #WDGann #IntradayAnalysis #MarketEducation #TechnicalAnalysis #PriceTime

Axis Bank | Gann Square of 9 Intraday Study (Normal Case)Disclaimer:
This analysis is for educational purposes only. I am not a SEBI-registered advisor. This is not financial advice.
Symbol: AXISBANK (NSE)
Date Observed: 14 November 2024
Time Frame: 15-Minute Chart
This post is a historical intraday case study showing how the Gann Square of 9 can be used to identify potential reaction zones by combining price movement capacity with time.
📊 Opening Market Observation
Axis Bank showed bullish intent from the first 15-minute candle.
The low of the opening candle (~1131.60) was treated as the 0-degree reference, following standard Gann methodology.
This reference level acts as the base point for measuring upward price vibration for the session.
🔢 Square of 9 Level Structure
Based on Square of 9 calculations:
0 Degree: ~1131
45 Degree (Observed Normal Capacity): ~1148
In intraday studies, the 45-degree level often represents the stock’s normal directional movement range.
⏱️ Price & Time Interaction (Educational Observation)
Price reached the 45-degree level very early in the session (around the second 15-minute candle).
Completion of the normal movement range well before the latter part of the trading session has historically shown temporary price pressure or hesitation.
After interacting with this zone, the market displayed rejection behavior and short-term weakness.
This reflects a commonly observed Gann principle:
When price completes its expected movement capacity too early in time, the probability of a reaction increases.
📘 Key Educational Takeaways
Square of 9 levels can be projected in advance for structured observation
Correct identification of the 0-degree reference is critical
Alignment of price and time improves analytical context
Normal (45-degree) cases occur more frequently than rare (90-degree) cases
This approach supports disciplined chart reading rather than emotional decisions
📌 Shared purely for learning and historical chart-study purposes.
#AxisBank #GannSquareOf9 #WDGann #IntradayAnalysis #MarketEducation #TechnicalAnalysis #PriceTime

Axis Bank | Intraday Price Behaviour Using Square-Based GeometryDisclaimer:
This analysis is for educational purposes only. I am not a SEBI-registered adviser. This is not financial advice.
Educational Case Study | 7 February 2025
This idea presents an educational intraday case study on Axis Bank, focusing on how price movement capacity and time awareness can be observed using square-based geometric methods commonly referenced in classical market studies.
The purpose of this post is to study historical chart behavior, not to suggest trades or outcomes.
📊 Chart Context
Instrument: Axis Bank Ltd. (NSE)
Date: 7 February 2025
Timeframe: 15-minute (Intraday)
During the early part of the session, Axis Bank showed strong downward momentum. A structured framework was applied to observe how price behaved relative to predefined reference levels as the session progressed.
🔍 Observational Framework
The initial high of the session was treated as a reference point (around 1024.45)
From this reference, square-based projections were observed
A level near 1008 aligned with a 45-degree projection, often associated with normal intraday price reach in historical studies
This level was treated as a potential reaction zone, not a guaranteed support
All levels were used strictly as areas of observation.
📈 Observed Market Behavior
Price moved toward the projected zone during the morning session
Near this area, the market showed temporary pressure and a short-term response
The behavior aligned with previously observed historical interactions around similar geometric zones
Time context was noted as part of the observation, without implying causation
No trade execution, direction, or performance outcome is implied.
📘 Educational Insights from This Case
Square-based geometry can help outline normal intraday price movement capacity
Certain projected levels may act as areas where price behavior changes
Time awareness can provide additional context when studying intraday charts
This approach emphasizes structure and observation over indicators or predictions
All insights are based on historical chart study only.
📌 Important Note
This case study is shared strictly for learning and research purposes.
Geometric levels and time windows do not guarantee outcomes and should be treated as contextual analytical tools.
Market responses may include:
Temporary pauses
Short-term pressure
Continuation or expansion depending on broader structure
🚀 Summary
This intraday case study demonstrates how price geometry and time alignment can be used to observe market behavior in a structured and objective manner.
More educational chart studies will follow.

Cryptocurrency & Digital Asset MarketsIntroduction
The rise of cryptocurrencies and digital assets represents one of the most significant innovations in financial markets over the last decade. Originating with Bitcoin in 2009, cryptocurrencies have evolved from a niche technology experiment into a multi-trillion-dollar ecosystem encompassing thousands of digital assets, decentralized finance (DeFi) protocols, non-fungible tokens (NFTs), stablecoins, and blockchain-based applications. These markets challenge traditional financial structures by providing decentralized, borderless, and programmable forms of money and value transfer. Understanding the structure, dynamics, and risks of cryptocurrency markets is crucial for investors, traders, and policymakers alike.
Cryptocurrency and Digital Asset Basics
Cryptocurrencies are digital or virtual currencies that use cryptography for security, making them resistant to counterfeiting. Unlike fiat currencies, cryptocurrencies operate on decentralized networks, primarily using blockchain technology—a distributed ledger that records all transactions transparently and immutably.
Bitcoin (BTC): The first and most widely recognized cryptocurrency, designed as a decentralized digital alternative to traditional currency.
Altcoins: Other cryptocurrencies such as Ethereum (ETH), Cardano (ADA), Solana (SOL), and Ripple (XRP) with specific use cases beyond payment, including smart contracts, decentralized applications (dApps), and finance.
Stablecoins: Cryptocurrencies pegged to traditional currencies like USD (e.g., USDT, USDC) to minimize volatility and serve as a medium of exchange in digital markets.
Tokens: Digital assets built on existing blockchains, representing assets, access rights, or utilities within ecosystems.
Digital assets encompass a broader category beyond cryptocurrencies. They include NFTs, tokenized securities, and digital representations of real-world assets. Digital assets are programmable, tradable, and often interoperable across blockchain networks.
Market Structure
Cryptocurrency markets differ from traditional financial markets in several key aspects:
Decentralization: Unlike stock or bond markets, many cryptocurrency markets operate without a central exchange or authority. Peer-to-peer trading, decentralized exchanges (DEXs), and blockchain protocols allow transactions without intermediaries.
24/7 Trading: Cryptocurrency markets never close. Trading occurs continuously, globally, providing high liquidity opportunities but also exposing participants to constant market risk.
Market Participants: Participants include retail investors, institutional investors, miners, validators, and algorithmic trading bots. Institutional adoption has grown in recent years, introducing products like cryptocurrency ETFs, futures, and custody services.
Exchanges: Cryptocurrencies trade on centralized exchanges (CEXs) like Binance, Coinbase, and Kraken, which provide liquidity, custody, and compliance. Decentralized exchanges like Uniswap and Sushiswap operate without intermediaries, using smart contracts to facilitate trades.
Price Determinants
Cryptocurrency prices are influenced by multiple factors:
Supply and Demand: Fixed supply (e.g., Bitcoin’s 21 million cap) versus demand from investors, institutions, and retail users.
Market Sentiment: News, social media, and macroeconomic events can significantly impact crypto prices due to market psychology and herd behavior.
Regulation: Legal frameworks in different countries affect adoption and trading. Positive regulation encourages investment, while bans or restrictions can trigger sell-offs.
Technological Developments: Upgrades to blockchain protocols, new network features, or innovations in scalability and security can drive price appreciation.
Macro Factors: Inflation, interest rates, and currency depreciation indirectly influence crypto adoption as an alternative store of value.
Key Market Segments
Spot Market: The direct buying and selling of cryptocurrencies at current prices. Spot trading is the foundation of crypto markets.
Derivatives Market: Includes futures, options, and perpetual contracts allowing traders to hedge, speculate, or leverage positions. Derivatives markets add liquidity but increase systemic risk.
Decentralized Finance (DeFi): A rapidly growing sector offering lending, borrowing, yield farming, and automated market-making without traditional banks. DeFi uses smart contracts to automate financial services.
NFT Market: Non-fungible tokens represent unique digital assets such as art, collectibles, or virtual real estate. NFTs are changing the way ownership and creativity are monetized.
Tokenized Assets: Traditional assets like real estate, commodities, or stocks are increasingly tokenized to enable fractional ownership, faster settlements, and cross-border liquidity.
Trading and Investment Strategies
Cryptocurrency markets offer diverse opportunities, but they are highly volatile and risky. Common strategies include:
HODLing: Long-term holding of cryptocurrencies based on belief in their future adoption and value appreciation.
Day Trading: Short-term trading to exploit price volatility within intraday movements.
Swing Trading: Capturing medium-term price trends over days or weeks.
Arbitrage: Exploiting price differences between exchanges or markets.
Staking and Yield Farming: Earning rewards by locking cryptocurrencies in networks or DeFi protocols.
Market Risks and Challenges
Cryptocurrency and digital asset markets are exposed to several unique risks:
Volatility: Price swings of 10–20% in a single day are common. Extreme volatility can lead to significant gains or catastrophic losses.
Security Risks: Hacks, scams, phishing, and vulnerabilities in smart contracts or exchanges have historically caused large financial losses.
Regulatory Uncertainty: Governments worldwide are still defining legal frameworks. Sudden regulations can restrict access or impact asset values.
Liquidity Risk: Smaller cryptocurrencies may have low trading volume, making it difficult to enter or exit positions at desired prices.
Technological Risk: Blockchain bugs, network forks, and software vulnerabilities can disrupt trading and asset functionality.
Market Manipulation: Low liquidity and lack of regulation in some areas make cryptocurrencies susceptible to pump-and-dump schemes and price manipulation.
Adoption and Institutional Participation
Institutional adoption has accelerated the growth of cryptocurrency markets:
Major financial institutions now offer crypto custody, trading, and investment products.
Hedge funds, pension funds, and insurance companies are allocating portions of their portfolios to digital assets.
Payment companies like PayPal and Mastercard facilitate crypto transactions.
Central banks are exploring Central Bank Digital Currencies (CBDCs), potentially integrating digital assets with traditional monetary systems.
Regulatory Landscape
Regulation remains a defining factor in the future of crypto markets:
Countries like the United States and the European Union are working on clear regulatory frameworks covering taxation, anti-money laundering (AML), and investor protection.
Some nations, such as El Salvador, have adopted cryptocurrencies as legal tender.
Others, like China, have banned crypto trading and mining, illustrating the wide divergence in global policies.
Regulatory clarity is expected to increase market legitimacy, attract institutional capital, and reduce systemic risks.
Future Trends
DeFi Expansion: Decentralized finance is expected to grow, providing more sophisticated financial services without intermediaries.
Web3 Integration: Blockchain technology will underpin digital identity, social networks, and decentralized applications, creating new ecosystems for value exchange.
Layer-2 Scaling: Solutions like Ethereum’s layer-2 protocols aim to reduce transaction costs and increase network speed.
Interoperability: Cross-chain solutions will enable seamless asset transfers between blockchain networks.
Sustainable Practices: Energy-efficient consensus mechanisms like Proof-of-Stake (PoS) will gain traction over energy-intensive Proof-of-Work (PoW) models.
Conclusion
Cryptocurrency and digital asset markets represent a paradigm shift in how value is created, transferred, and stored. They combine technological innovation with financial markets, providing opportunities for speculation, investment, and new financial services. However, these markets remain highly volatile, technologically complex, and subject to regulatory uncertainty. Successful participation requires a strong understanding of blockchain fundamentals, market dynamics, risk management, and strategic foresight. As adoption grows and regulation matures, digital assets are likely to become a mainstream component of global finance, reshaping economies, investment strategies, and the financial system itself.

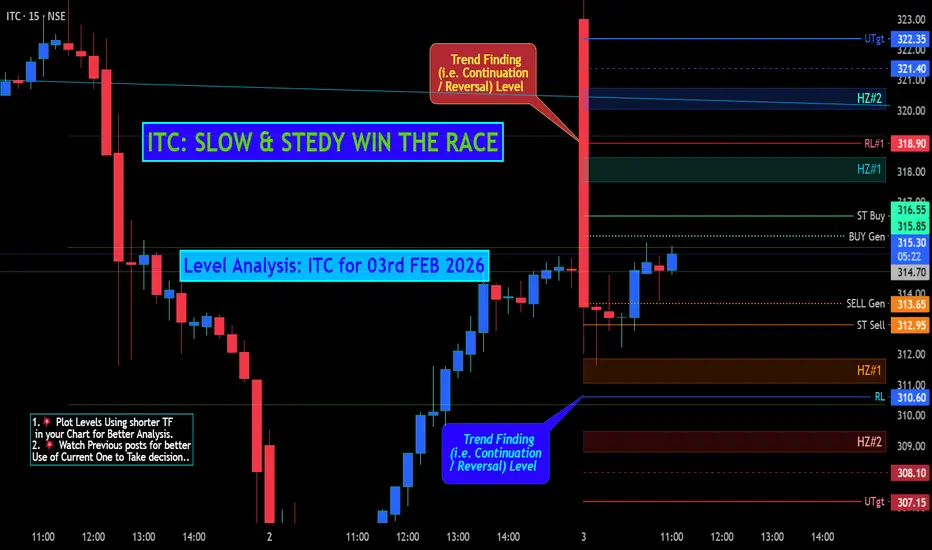
ITC: SLOW & STEDY WIN THE RACE 03rd FEB 2026+ Level AnalysisITC: SLOW & STEDY WIN THE RACE
Level Analysis: ITC for 03rd FEB 2026
━━━━━━━━━₹₹₹₹₹₹₹₹₹₹₹₹━━━━━━━━
💥Level Interpretation / description:
L#1: If the candle crossed & stays above the “Buy Gen”, it is treated / considered as Bullish bias.
L#2: Possibility / Probability of REVERSAL near RLB#1 & UBTgt
L#3: If the candle stays above “Sell Gen” but below “Buy Gen”, it is treated / considered as Sidewise. Aggressive Traders can take Long position near “Sell Gen” either retesting or crossed from Below & vice-versa i.e. can take Short position near “Buy Gen” either retesting or crossed downward from Above.
L#4: If the candle crossed & stays below the “Sell Gen”, it is treated / considered a Bearish bias.
L#5: Possibility / Probability of REVERSAL near RLS#1 & USTgt
HZB (Buy side) & HZS (Sell side) => Hurdle Zone,
*** Specialty of “HZB#1, HZB#2 HZS#1 & HZS#2” is Sidewise (behaviour in Nature)
Rest Plotted and Mentioned on Chart
Color code Used:
Green =. Positive bias.
Red =. Negative bias.
RED in Between Green means Trend Finder / Momentum Change
/ CYCLE Change and Vice Versa.
Notice One thing: HOW LEVELS are Working.
Use any Momentum Indicator / Oscillator or as you "USED to" to Take entry.
━━━━━━━━━━━━━━━━━━━━━━━━━━━━━━━━━━━━━━━━━━━
⚠️ DISCLAIMER:
The information, views, and ideas shared here are purely for educational and informational purposes only. They are not intended as investment advice or a recommendation to buy, sell, or hold any financial instruments. I am not a SEBI-registered financial adviser.
Trading and investing in the stock market involves risk, and you should do your own research and analysis. You are solely responsible for any decisions made based on this research.
"As HARD EARNED MONEY IS YOUR's, So DECISION SHOULD HAVE TO BE YOUR's".
━━━━━━━━━━━━━━━━━━━━━━━━━━━━━━━━━
❇️ Follow notification about periodical View
💥 Do Comment for Stock WEEKLY Level Analysis.🚀
📊 Do you agree with this view?
✈️ HIT THE PLANE ICON if this technical observation resonates with you. It will Motivate me.
━━━━━━━━━━━━━━━━━━━━━━━━━━━━━━━━━
💡 If You LOOKING any CHART & want for Level and ANALYZE?
Share your desired stock names in the comments below! I will try to analyze the chart Levels, patterns and share my technical view (so far my Knowledge).
If Viewers think It can identify meaningful setups. Looking forward to hearing from all of you — let's keep this discussion going and help each other make better trading decisions.
GIFTNIFTY Intra-Swing Level Analysis for 03rd FEB 2026GIFTNIFTY Intra-Swing Level Analysis for 03rd FEB 2026
🚀Follow & Compare NIFTY spot Post for Taking Trade
━━━━━━━━━₹₹₹₹₹₹₹₹₹₹₹₹━━━━━━━━
💥Level Interpretation / description:
L#1: If the candle crossed & stays above the “Buy Gen”, it is treated / considered as Bullish bias.
L#2: Possibility / Probability of REVERSAL near RLB#1 & UBTgt
L#3: If the candle stays above “Sell Gen” but below “Buy Gen”, it is treated / considered as Sidewise. Aggressive Traders can take Long position near “Sell Gen” either retesting or crossed from Below & vice-versa i.e. can take Short position near “Buy Gen” either retesting or crossed downward from Above.
L#4: If the candle crossed & stays below the “Sell Gen”, it is treated / considered a Bearish bias.
L#5: Possibility / Probability of REVERSAL near RLS#1 & USTgt
HZB (Buy side) & HZS (Sell side) => Hurdle Zone,
*** Specialty of “HZB#1, HZB#2 HZS#1 & HZS#2” is Sidewise (behaviour in Nature)
Rest Plotted and Mentioned on Chart
Color code Used:
Green =. Positive bias.
Red =. Negative bias.
RED in Between Green means Trend Finder / Momentum Change
/ CYCLE Change and Vice Versa.
Notice One thing: HOW LEVELS are Working.
Use any Momentum Indicator / Oscillator or as you "USED to" to Take entry.
━━━━━━━━━━━━━━━━━━━━━━━━━━━━━━━━━━━━━━━━━━━
⚠️ DISCLAIMER:
The information, views, and ideas shared here are purely for educational and informational purposes only. They are not intended as investment advice or a recommendation to buy, sell, or hold any financial instruments. I am not a SEBI-registered financial adviser.
Trading and investing in the stock market involves risk, and you should do your own research and analysis. You are solely responsible for any decisions made based on this research.
"As HARD EARNED MONEY IS YOUR's, So DECISION SHOULD HAVE TO BE YOUR's".
━━━━━━━━━━━━━━━━━━━━━━━━━━━━━━━━━
❇️ Follow notification about periodical View
💥 Do Comment for Stock WEEKLY Level Analysis.🚀
📊 Do you agree with this view?
✈️ HIT THE PLANE ICON if this technical observation resonates with you. It will Motivate me.
━━━━━━━━━━━━━━━━━━━━━━━━━━━━━━━━━
💡 If You LOOKING any CHART & want for Level and ANALYZE?
Share your desired stock names in the comments below! I will try to analyze the chart Levels, patterns and share my technical view (so far my Knowledge).
If Viewers think It can identify meaningful setups. Looking forward to hearing from all of you — let's keep this discussion going and help each other make better trading decisions.

Expecting EurCHF bearish Why should we trust this idea 💡??Eur has 2.15% interest rate ,while chf is safe heaven currency so
it would shows always significant strength towards chf ,apart from that any Ongoing panic
global events will also cause CHF bullish with aligning the price action parameters by following liquidity 💲⚔️
Disclaimer: This is not any financial advice! Simulated idea 😉

NIFTY Positional Level Analysis for 03/02/2026+ USA Rate CutNIFTY Positional Level Analysis for 03rd Feb 2026+
❇️ IMPACT of USA Tariff Cut Announcement
on February 2, 2026 Published NEW Levels
👇🏼Screenshot of NIFTY Spot All-day(02nd FEB 2026 at 1.23 AM) in 15 min TF.
On February 2, 2026, US President Donald Trump announced a significant trade deal with India, reducing tariffs on Indian goods from 25% to 18% effective immediately, following a phone call with Indian Prime Minister Narendra Modi. This move also includes dropping a separate 25% tariff imposed in August 2025 on Indian imports due to India's purchases of Russian oil, in exchange for India's commitment to cease those imports. The effective tariff rate on Indian exports to the US will now stand at 18%, down from a combined 50% in some interpretations.
❇️ Key Deal Elements
Tariff Reductions: US reciprocal tariffs on Indian goods reduced to 18% from 25%, with the additional 25% "fentanyl-related" tariff (linked to Russian oil) fully removed. India agreed to reduce its tariffs and non-tariff barriers on US goods to zero in reciprocation.
Russian Oil Pledge: India committed to halting purchases of Russian-origin oil, uranium, natural gas, and related products, addressing US concerns over sanctions evasion. This aligns with potential US legislation like the Sanctioning Russia Act of 2025.
US Purchases from India: As part of the deal, the US agreed to purchase $500 billion worth of Indian energy, technology, agriculture, coal, and other products.
Litigation Context: The announcement follows ongoing US court challenges to Trump's tariff authority, including a Federal Circuit ruling in September 2025 that partially invalidated similar "fentanyl" and reciprocal tariffs, though stayed pending Supreme Court appeal (oral arguments heard November 2025).
❇️ Background and Strategic Implications
Tariff History: The initial 25% reciprocal tariff was imposed in August 2025, escalating to 50% with an additional levy tied to India's Russian oil imports amid the Ukraine conflict. This deal defuses tensions, especially post-Trump's reelection and focus on global trade imbalances.
For India: Significant relief for exporters (e.g., textiles, pharma, IT services), potentially boosting bilateral trade from $200+ billion annually. It also aligns with India's diversification from Russian energy amid global pressures.
Market Reaction: I ndian stocks / Index future (e.g., GIFTNIFTY) rallied 4+% on the news, with export-oriented sectors like auto and textiles gaining. Rupee strengthened slightly against USD. However, some criticism on social media views it as a "surrender" to US pressure, reducing India's leverage.
🚀Follow & Compare NIFTY spot Post for Taking Trade
🚀Follow GIFTNIFTY Post for NF levels
━━━━━━━━━₹₹₹₹₹₹₹₹₹₹₹₹━━━━━━━━
💥Level Interpretation / description:
L#1: If the candle crossed & stays above the “Buy Gen”, it is treated / considered as Bullish bias.
L#2: Possibility / Probability of REVERSAL near RLB#1 & UBTgt
L#3: If the candle stays above “Sell Gen” but below “Buy Gen”, it is treated / considered as Sidewise. Aggressive Traders can take Long position near “Sell Gen” either retesting or crossed from Below & vice-versa i.e. can take Short position near “Buy Gen” either retesting or crossed downward from Above.
L#4: If the candle crossed & stays below the “Sell Gen”, it is treated / considered a Bearish bias.
L#5: Possibility / Probability of REVERSAL near RLS#1 & USTgt
HZB (Buy side) & HZS (Sell side) => Hurdle Zone,
*** Specialty of “HZB#1, HZB#2 HZS#1 & HZS#2” is Sidewise (behaviour in Nature)
Rest Plotted and Mentioned on Chart
Color code Used:
Green =. Positive bias.
Red =. Negative bias.
RED in Between Green means Trend Finder / Momentum Change
/ CYCLE Change and Vice Versa.
Notice One thing: HOW LEVELS are Working.
Use any Momentum Indicator / Oscillator or as you "USED to" to Take entry.
━━━━━━━━━━━━━━━━━━━━━━━━━━━━━━━━━━━━━━━━━━━
⚠️ DISCLAIMER:
The information, views, and ideas shared here are purely for educational and informational purposes only. They are not intended as investment advice or a recommendation to buy, sell, or hold any financial instruments. I am not a SEBI-registered financial adviser.
Trading and investing in the stock market involves risk, and you should do your own research and analysis. You are solely responsible for any decisions made based on this research.
"As HARD EARNED MONEY IS YOUR's, So DECISION SHOULD HAVE TO BE YOUR's".
━━━━━━━━━━━━━━━━━━━━━━━━━━━━━━━━━
❇️ Follow notification about periodical View
💥 Do Comment for Stock WEEKLY Level Analysis.🚀
📊 Do you agree with this view?
✈️ HIT THE PLANE ICON if this technical observation resonates with you. It will Motivate me.
━━━━━━━━━━━━━━━━━━━━━━━━━━━━━━━━━
💡 If You LOOKING any CHART & want for Level and ANALYZE?
Share your desired stock names in the comments below! I will try to analyze the chart Levels, patterns and share my technical view (so far my Knowledge).
If Viewers think It can identify meaningful setups. Looking forward to hearing from all of you — let's keep this discussion going and help each other make better trading decisions.

DowJones (DJI) IntraSwing Levels for 02nd-03rd Feb 2026 (2:30 amDowJones (DJI) IntraSwing Levels for 02nd-03rd Feb 2026 (2:30 am)
━━━━━━━━━₹₹₹₹₹₹₹₹₹₹₹₹━━━━━━━━
💥Level Interpretation / description:
L#1: If the candle crossed & stays above the “Buy Gen”, it is treated / considered as Bullish bias.
L#2: Possibility / Probability of REVERSAL near RLB#1 & UBTgt
L#3: If the candle stays above “Sell Gen” but below “Buy Gen”, it is treated / considered as Sidewise. Aggressive Traders can take Long position near “Sell Gen” either retesting or crossed from Below & vice-versa i.e. can take Short position near “Buy Gen” either retesting or crossed downward from Above.
L#4: If the candle crossed & stays below the “Sell Gen”, it is treated / considered a Bearish bias.
L#5: Possibility / Probability of REVERSAL near RLS#1 & USTgt
HZB (Buy side) & HZS (Sell side) => Hurdle Zone,
*** Specialty of “HZB#1, HZB#2 HZS#1 & HZS#2” is Sidewise (behaviour in Nature)
Rest Plotted and Mentioned on Chart
Color code Used:
Green =. Positive bias.
Red =. Negative bias.
RED in Between Green means Trend Finder / Momentum Change
/ CYCLE Change and Vice Versa.
Notice One thing: HOW LEVELS are Working.
Use any Momentum Indicator / Oscillator or as you "USED to" to Take entry.
━━━━━━━━━━━━━━━━━━━━━━━━━━━━━━━━━━━━━━━━━━━
⚠️ DISCLAIMER:
The information, views, and ideas shared here are purely for educational and informational purposes only. They are not intended as investment advice or a recommendation to buy, sell, or hold any financial instruments. I am not a SEBI-registered financial adviser.
Trading and investing in the stock market involves risk, and you should do your own research and analysis. You are solely responsible for any decisions made based on this research.
"As HARD EARNED MONEY IS YOUR's, So DECISION SHOULD HAVE TO BE YOUR's".
━━━━━━━━━━━━━━━━━━━━━━━━━━━━━━━━━
❇️ Follow notification about periodical View
💥 Do Comment for Stock WEEKLY Level Analysis.🚀
📊 Do you agree with this view?
✈️ HIT THE PLANE ICON if this technical observation resonates with you. It will Motivate me.
━━━━━━━━━━━━━━━━━━━━━━━━━━━━━━━━━
💡 If You LOOKING any CHART & want for Level and ANALYZE?
Share your desired stock names in the comments below! I will try to analyze the chart Levels, patterns and share my technical view (so far my Knowledge).
If Viewers think It can identify meaningful setups. Looking forward to hearing from all of you — let's keep this discussion going and help each other make better trading decisions.

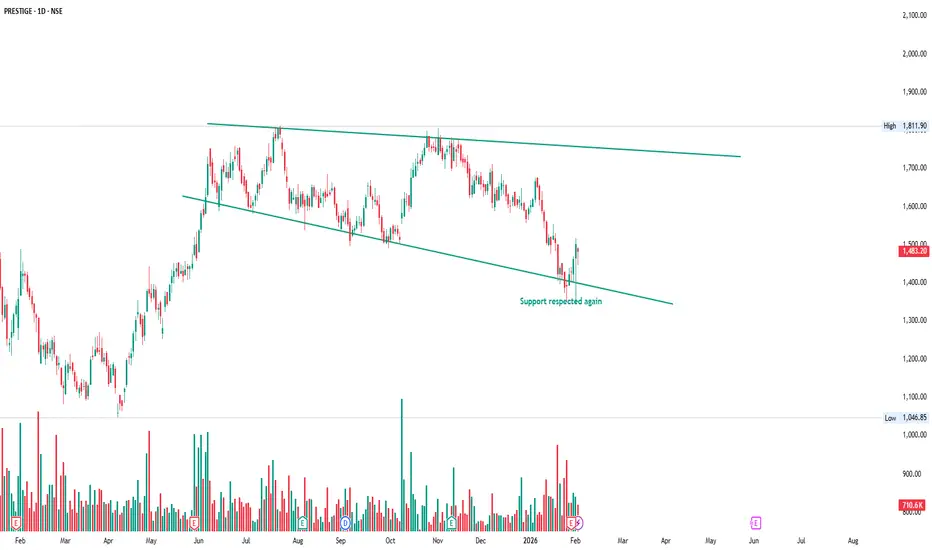
PRESTIGE: Controlled Correction Inside a Falling ChannelPrestige Group is currently moving inside a clear falling channel, where price is making lower highs and lower lows in a controlled manner.
This shows that the stock is going through a correction phase rather than panic selling.
Each time price reaches the upper trendline, sellers step in and push it lower.
And each time price reaches the lower trendline, buyers try to support it.
This back-and-forth movement is how markets cool down after a strong move.
Recently, price touched the lower channel support again and showed a bounce, which means buyers are still active at this level.
As long as price stays inside this channel, the move remains a correction within structure.
A strong move usually starts when price either breaks above the channel or forms a strong base near support.
This chart clearly shows how trendlines guide price without any indicators.
MARICO: Price Respecting Rising Channel – Healthy Correction MARICO has been moving inside a clear rising channel for a long time, showing a strong and healthy uptrend. Price has respected both the upper resistance line and the lower support line multiple times, bouncing whenever it reached the lower boundary and pulling back after touching the upper side. Recently, price moved down from the top of the channel and is now approaching the lower trendline support again. This move is not a sign of weakness but a normal correction within the ongoing trend, which helps the market cool down before the next move. As long as price holds above this rising support, the overall structure remains intact and the trend continues to be strong. This chart is a simple example of how price action and structure guide market movements without any indicators or confusion.

INDIGO: Event Fall Meets Strong Support (Price Action)The recent sharp fall in INDIGO was not random.
Over the past few weeks, the stock came under pressure due to major flight cancellations, regulatory issues related to pilot duty rules, and a sharp drop in quarterly profits.
These events created fear and selling pressure in the market.
Because of this, many investors booked profits and exited quickly, which caused the strong downward move you see on the chart.
This type of fall is called an event-driven correction.
From a price action view, INDIGO is still moving inside a long-term expanding channel, which means the overall trend is still active but swings are becoming wider.
After the sharp fall from the upper channel, price came down to the lower trendline support.
This support has been respected well in the past — and once again buyers stepped in here.
NOTE: I’m sharing these charts with pure price action — no indicators, no confusion. This simple way of reading structure and support is something you rarely see taught clearly in the community.

GODREJPROP – Multi-Timeframe Price Action in ActionThis chart shows a clean example of how price respects strong support levels.
On the weekly timeframe, GODREJPROP has reached a major support zone where price reacted strongly in the past.
On the lower timeframe, after a sharp fall, price formed a double bottom at the same support area.
This tells us:
• Sellers are losing strength
• Buyers are defending this level
• Price is trying to stabilize
When strong higher timeframe support combines with a double bottom on lower timeframe, it often gives early signs of recovery.
This doesn’t guarantee a reversal, but it shows that demand is stepping in.

NIFTY Spot level Analysis for 03rd Feb 2026+ NIFTY Spot level Analysis for 03rd Feb 2026+
👇🏼Screenshot of NIFTY Spot All-day(02nd FEB 2026) in 5 min TF.
🚀Follow GIFTNIFTY Post for NF levels
👇🏼Screenshot of GIFTNIFTY as of now i.e.1st Session (02nd Feb 2026) in 5 min TF..
━━━━━━━━━₹₹₹₹₹₹₹₹₹₹₹₹━━━━━━━━
💥Level Interpretation / description:
L#1: If the candle crossed & stays above the “Buy Gen”, it is treated / considered as Bullish bias.
L#2: Possibility / Probability of REVERSAL near RLB#1 & UBTgt
L#3: If the candle stays above “Sell Gen” but below “Buy Gen”, it is treated / considered as Sidewise. Aggressive Traders can take Long position near “Sell Gen” either retesting or crossed from Below & vice-versa i.e. can take Short position near “Buy Gen” either retesting or crossed downward from Above.
L#4: If the candle crossed & stays below the “Sell Gen”, it is treated / considered a Bearish bias.
L#5: Possibility / Probability of REVERSAL near RLS#1 & USTgt
HZB (Buy side) & HZS (Sell side) => Hurdle Zone,
*** Specialty of “HZB#1, HZB#2 HZS#1 & HZS#2” is Sidewise (behaviour in Nature)
Rest Plotted and Mentioned on Chart
Color code Used:
Green =. Positive bias.
Red =. Negative bias.
RED in Between Green means Trend Finder / Momentum Change
/ CYCLE Change and Vice Versa.
Notice One thing: HOW LEVELS are Working.
Use any Momentum Indicator / Oscillator or as you "USED to" to Take entry.
━━━━━━━━━━━━━━━━━━━━━━━━━━━━━━━━━━━━━━━━━━━
⚠️ DISCLAIMER:
The information, views, and ideas shared here are purely for educational and informational purposes only. They are not intended as investment advice or a recommendation to buy, sell, or hold any financial instruments. I am not a SEBI-registered financial adviser.
Trading and investing in the stock market involves risk, and you should do your own research and analysis. You are solely responsible for any decisions made based on this research.
"As HARD EARNED MONEY IS YOUR's, So DECISION SHOULD HAVE TO BE YOUR's".
━━━━━━━━━━━━━━━━━━━━━━━━━━━━━━━━━
❇️ Follow notification about periodical View
💥 Do Comment for Stock WEEKLY Level Analysis.🚀
📊 Do you agree with this view?
✈️ HIT THE PLANE ICON if this technical observation resonates with you. It will Motivate me.
━━━━━━━━━━━━━━━━━━━━━━━━━━━━━━━━━
💡 If You LOOKING any CHART & want for Level and ANALYZE?
Share your desired stock names in the comments below! I will try to analyze the chart Levels, patterns and share my technical view (so far my Knowledge).
If Viewers think It can identify meaningful setups. Looking forward to hearing from all of you — let's keep this discussion going and help each other make better trading decisions.

BLUESTARCO – Pure Price Action in ActionBLUESTARCO was moving inside a falling channel for a long time, where price kept coming down from the upper trendline and taking support at the lower trendline, showing how clearly it respected the structure. Recently, price reached the lower support again and bounced strongly, which tells us that selling pressure is reducing and buyers are stepping in. After this bounce, the stock is now moving sideways and holding above a support zone, which usually means the market is building strength for the next move. This is a simple example of how corrections are normal and how price action through trendlines and support levels guides the market direction without needing any indicators.

Will History Repeat Itself? A Warning from the Dow-Gold RatioRecently, the newly nominated candidate for the Fed chair, Kevin Warsh, talked about an upcoming global economic & financial shift, and it was shocking to hear from him because people at position like his never say such stuff unless it's already underway.
He said "we're entering a new economic system & it happens every 40-45 years" & called it "our Reagan moment" *
The DJI/ Gold ratio is mirroring the words of the next Fed chair
Note: search for "Kevin Warsh Reagan moment" on YouTube to listen to his full interview
----------------------------------------------------------------------------------------------
The ratio has already breached the symmetrical triangle on the bearish side
And entered the pivotal zone (marked red zone)
This level has been witnessed only 4 times in the entire history:
- 1929-30: The Great Economic Depression,
- 1973: oil crisis, & the collapse of the Bretton Woods system,
- 2008: Global Financial Crisis,
- 2026: something's cooking behind the curtains.
1980s: The ratio made bottoms => the election of Ronald Reagan as 40th president of USA: A major shift in US economy
1929-1973 = 44 years
1980-2025 = 45 years
-------------------------------------------------------------------------------------------
The DJI/Gold ratio chart suggests the market may be on the verge of a significant capital rotation event and a potential future economic downturn.
A high ratio indicates that stocks are expensive and overvalued compared to gold
Considering the technical levels and fundamental scenario, the ratio is expected to fall further...........
For this to happen:
- The Dow Jones needs to crash while gold prices remain constant (i.e., levels above 4000-4500 could be the new normal; lower gold prices will keep the ratio on higher levels)
- A falling Dow-to-Gold ratio indicates that gold is expected to outperform stocks, which usually happens during periods of market weakness, economic instability, or recession.
