Simple analysis for BHARTIARTL for next weekAfter studying multiple time frames, we can see a non trending picture in BHARTIARTL. But we see a strong support area near 580 and resistance zone @606-610. Crossing & closing above 610 on daily basis will bring new ATH sooner in BHARTIARTL.
BHARTIARTL

ATH Bo in AirtelBharti Airtel BO of 1-year-old TL. making new High at cmp. Looks good for positional traders at CMP. SL below the BO area.


BHARTIARTLStock coming out of range consolidation , with indecisive candle on daily with volume, short term buy above 560 SL 540 target will be 580 and 600
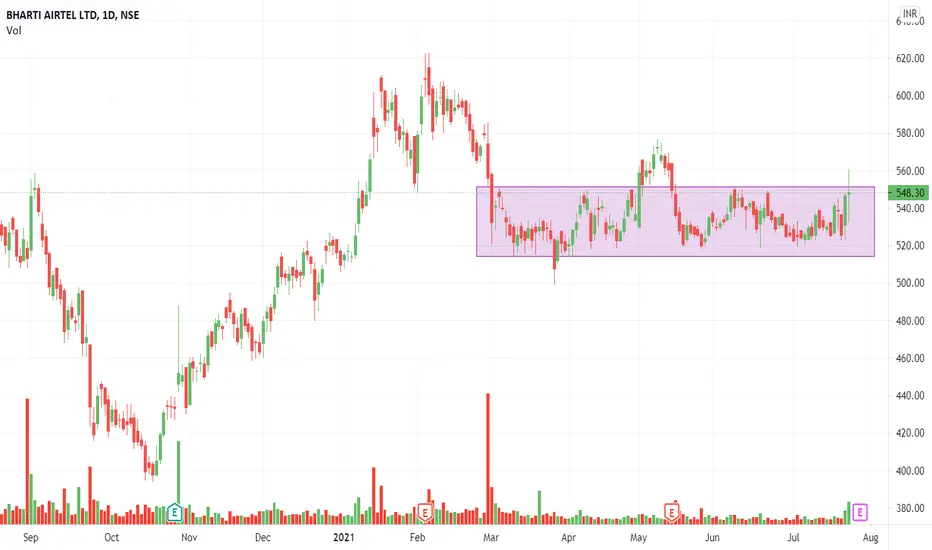
How to Do Swing trading in BHARTIARTL IMP LEVELS :
1) STRONG closing above 550 levels with the volume on 1hr
2) Good structure on D chart seems to be broken with already above avg volumes
3) IF sustains here only on D chart too or above 555 then A great upside can be seen in BHARTIARTL
4) Risk is 4% from 1hr closing candle buy point
5) Targets are - 580 levels than 610 levels in the near term ( 1:1 and 1:2.5 risk rewards ratio activated here )
6) Trade quality: Depends on the market ( NIFTY50 ) Bullishness too

BHARTIAIRTEL - Ready For Upside BHARTIAIRTEL - Buy call was shared before hand only. triggered today.
BHARTIAIRTEL
Buy- Above 552
SL - 540
Target - 565 577 590 610

Bharti Airtellooking strong taken triangle base support good consolidation can show 550/568/600 with support of 520 on closing basis.

#HEAD AND SHOULDER #BHARTIARTL #3HHEY FELLAS, Have a look at bhartiartl, it's price is trying to form a head and shoulder pattern in 3 hour timeframe, if the price is able to break the neckline, it may tumble till it reaches 460.

AIRTEL 📞📞Cup & Handle retest done in monthly
Descending triangle in hourly
Retracement towards 200MA in 2hrs
Will take a good move from here.
Take trade as per the values given in Fibonacci. always trail the stop loss. do your own analysis before taking trade
Check these Upcoming ideas - still active
Check these successful trades & approach on HINDZINC , ITC , ADANIPORT SPL
If you like my analysis do like & follow me as a token of appreciation. If you have any queries on any stock let me know.
Leave a comment that is helpful or encouraging. Let's master the markets together


AIRTEL- TIME FOR ACTION:{#73 (GENIE IDEAS): I will daily post intraday/swing/positional trading opportunities so u can analyse and get the most from it. if you like my analysis do like and follow me as a token of appreciation.and if you have any queries let me know.
Leave a comment that is helpful or encouraging. Let's master the markets together .

🌟 BHARTIARTL - Plan, Logic and Risk in Description 💲💲🌟 FOLLOW me @Averoy_Apoorv_Analysis and get these free analysis :) 🌟💲💲
✺ LOGIC ✺
✣Yellow Trendline: Supportive price line (Low-risk setups are created on this line )
✣Blue Trendline: Strong Resistance
✣Pink Trendline: Good Resistance
✣Red trendline: OK-OK Resistance
✣Blue Horizontal line: Monthly Resistance now Support LEVEL
✺Plan
✣One should enter on these levels with a Risk of 4% and hold as much as you can, as its a low risk and high reward setup
✣If you are a Breakout trader then enter only when it crosses all the resistance trendlines and SL can be below the Candle (small risk) or Swing low, I would say go for small risk as there might be some other good trade that u might miss the more you wait on a loser trade
🔰 {Some info}
➼My name is Apoorv and I am a 2nd year Engineering student, I want to pursue trading as my career, and thus whatsoever setups or trades I potentially see on my charting platform, I post it here and share them with you all.
➼I hope you will love my simple analysis style.
➼Feel free to suggest your view on this as learning is earning here :)
➼I take my trades on my Zerodha account :)
➼These charts are my and only my work, my thought process, just from an educational point of view and no calls.
<<<<<>>>>>

#LGBBROSLTD CMP353 #Target 394(13%) #RIIL #DEEPAKFERT #CALSOFTWeekly Chart
NSE: LGBBROSLTD
Short Term Quick Profit
CMP 353.20
Target : 394.95
SL : 327
Timeframe < 45 days
Factors:
Inverted Head & Shoulder
Trend Following
Rising Volume with rising Prices.
Flag pattern breakout.
Pennant Pattern Breakout with Bullish Candle.
Retest Successful.
Higher Highs & Higher Lows.
Broken above RESISTANCE levels
Trading at SUPPORT levels
Earnings are strong.
Bullish Wedge Breakout
Risk Return Ratio is healthy.
And
Rising from Double Bottom Pattern to Flag Pattern forming.
If you like my work KINDLY LIKE SHARE & FOLLOW this page for free Stock Recommendations.
With 💚 from Rachit Sethia

Bharti Airtel on the verge !!!cross 550....buy for 570... doesn't sustain 550... short for 520.......

#TRITURBINE 107 to 122+ 15% return #Nifty #bankbifty #energy #it#TRITURBINE
NSE: TRITURBINE
CMP 107.50
TARGET 122++
HOLD AFTER BOOKING APART!
Long Term Target 146++
Factors:
BREAKOUT
Rising Volume with rising Prices.
Flag pattern breakout.
Pennant Pattern Breakout with Bullish Candle.
Retest Successful.
Higher Highs & Higher Lows.
Broken above RESISTANCE levels
Trading at SUPPORT levels
Fundamental are strong.
Risk Return Ratio is healthy.
And
Rising from Double Bottom Pattern to Flag Pattern forming
The stock has potential to go beyond 146 in longer time.
If you like my work KINDLY LIKE SHARE & FOLLOW this page for free Stock Recommendations.
With 💚 from Rachit Sethia


Trend Breakout Bharti Airtelon 5 Min chart Frame a Trend Breakout noticed for Bharti Airtel Share. Breakout is having a good volume as well as price action. Seems a good Long bullish trend can be seen in upcoming time for Bharti Airtel.

Bharti Airtel - 07th May | IntradayStock has broken major resistance zone (550 levels) on 4th April. From last 2 days it is consolidating above that zone and forming a symmetrical triangle.
In coming days if stock breaks 565.5 then can give good upside of 1-2% in Intraday.
However if lower Tl is broken then stock can easily fall to 550 levels in one session only.

BHARTIARTL have selling pressure in between 579.15 to 585.95BHARTIARTL have selling pressure in between 579.15 to 585.95

Bharti Airtel Trend Analysis !!TREND ANALYSIS & TRADE SETUP !
ELLIOTT WAVE ANALYSIS !!
Follow Chart Instruction.
Do not be Hurry for entry.
Wait for Proper Entry Setup.
Buy/Sell with Best Risk Reward.
Educational Chart Only.
Wait for ENTRY CONFIRMATION !
Reward is 8-10 times .

BHARTIARTL - HIGH PROBABILITY TRADE...THE CHART SAYS IT ALL !!!Hi Friends and Fellow Traders,
I have interpreted what the CHART is saying in simple English. Hope you like this analysis.
Happy Trading !


BHARTIARTL RESISTANCE BREAKOUT 1HBHARTIARTL is trading around it's resistance. The stock has tested the resistance many times at the same level and it can now give a breakout. We can initiate a long position when price crosses the high of breakout candle.
