BTC Update 15th august BTC recovers the inefficiency left on10th July, bouncing on the support level at 111K and returning on the last target, in the red zone.
From a technical point, this is could be forecast following the empty zone, as the wick on July 14th, which underlines a POL (point of liquidity), also supported by the heatmap liquidation.
Fundamentally, this new sphere of positivity and institutional adoption is helping BTC's rally to conclude this cycle with the utter targets.
The grow in the past cycle is been sustained- less hyped than the previous two. Both due to the high currency price of the Big coin, which makes difficult have a high percentage changes in short time, and due the consistent consolidation of the VIX index. At the same time, the entrance of new institutional players, as side general traders, investors and big whales, has stabilized a bit the market in terms of entrance and exit, make it more forecastable and stable.
New targets in the next post.
Thanks for reading,
M
Bitcoin (Cryptocurrency)

BTC - 13th Aug viewPrice seems to be making sub waves inside the 5th wave where we have new ATH targets open.
In the sub waves price just took 2nd wave support and make 3rd wave and need to see 4th sub wave re test 120200 to 120400 support area or else make false move by breaking to 118 which is a possibility but i do not want or do not expect it to happen after such a good up move. Just want to caution so money management is taken care and do trade only with 50 to 60% capital all ways. buy the dips and sell the rallies with profits and with no greed for more and more without taking profits... we will get dips too... or at least higher low with proved support to take raisk instead of chasing

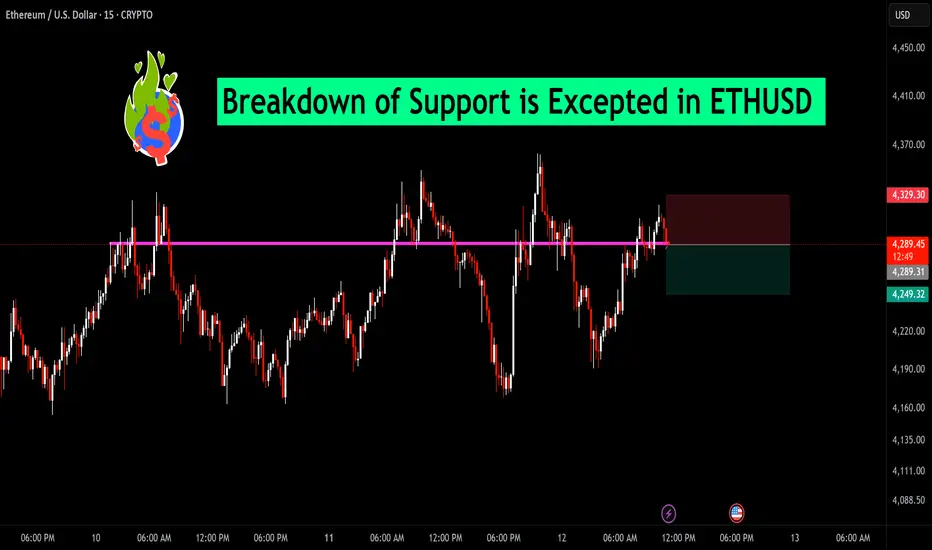
Breakdown of Support is Excepted in ETHUSD Ethereum is currently hovering just above a key horizontal support zone near $4,289. Price has tested this level multiple times, and selling pressure appears to be increasing. A decisive breakdown below this zone could trigger a short-term bearish move toward the next support near $4,249.
Traders should watch for a strong close below this support on the 15-min chart to confirm the breakdown. A tight stop above $4,329 could help manage risk for short positions.
Bias: Bearish below $4,289 | Bullish recovery only above $4,329
BTC - 12thAug2025 - 4th wave bottom and 5th wave TP - 1248004th wave has fallen more because 2nd wave was also bigger. 4th wave bottom is expected in the zone marked in green where we have W formed support and this area is vital to call the trend is in bull trend and no change of character untill this area holds. my wave count is in line with all analysts so far and if this support is broken then BTC is too much manipulation, This view is shared before important US data so stay cautious in money management. Its good level to buy BTC and hold at least 60% long as its a key technical support area and potential move to new ATH from here with out further down move.

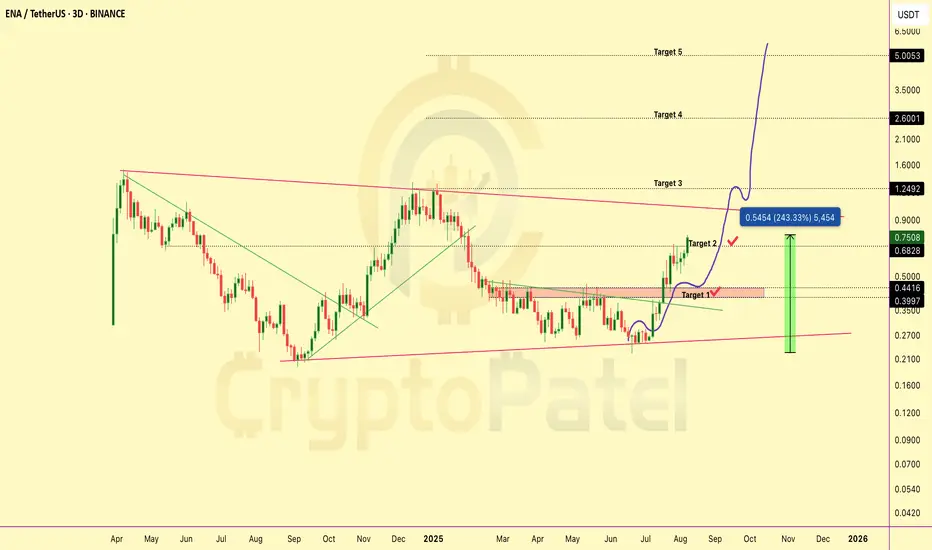
$ENA Up 243% From My $0.25 Entry And I’m Still BullishMIL:ENA Up 243% From My $0.25 Entry And I’m Still Bullish
Now MIL:ENA is trading at $0.75 and up 243% from our $0.25 entry ✅
TP1 and TP2 hit ✅ and I’m still super bullish, eyeing $1 / $2 / $5 next.
But remember, Greed has no limits.
Smart traders book partial profits and ride the rest with house money.
NFA & DYOR
#ETHEREUM – Macro Breakout Setup#ETHEREUM – Macro Breakout Setup 🚀
▶️ 6th time in history testing $4K macro resistance.
▶️ A clean weekly close above could ignite HTF expansion to $8K → $10K → $15K.
6 rejections in 4 years… one breakout can change it all.
NFA & DYOR

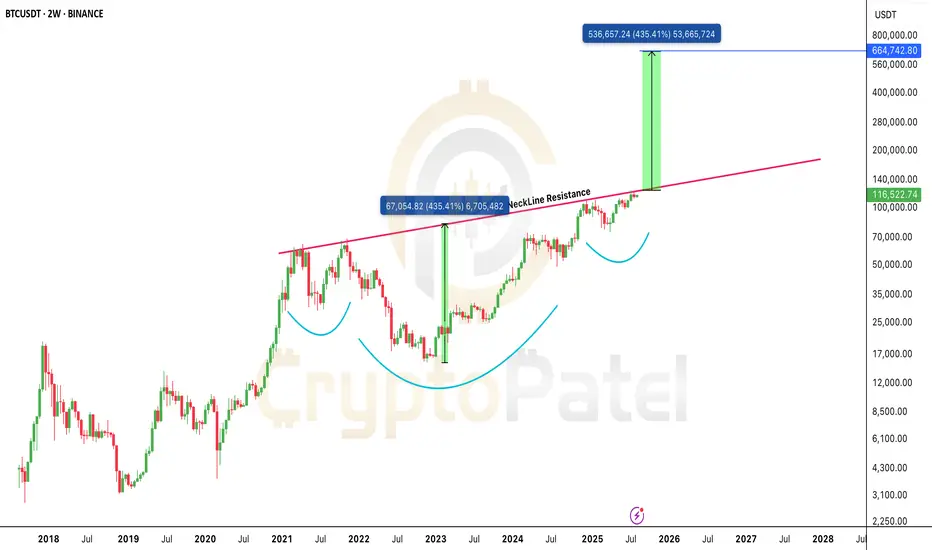
Bitcoin’s $664K Target Is Not a Joke: It’s a Chart-Based WarBitcoin is forming a massive macro structure and the neckline is the final barrier.
Break above it, and the technical target stretches to $664,000.
Yes, you read that right.
This isn’t hopium. It’s based on measured move projections from the breakout zone.
The only question now:
Does BTC explode to $664K this cycle… or in the next?
One breakout changes everything.
Watch the neckline. Stay focused.
Note: NFa & DYOR
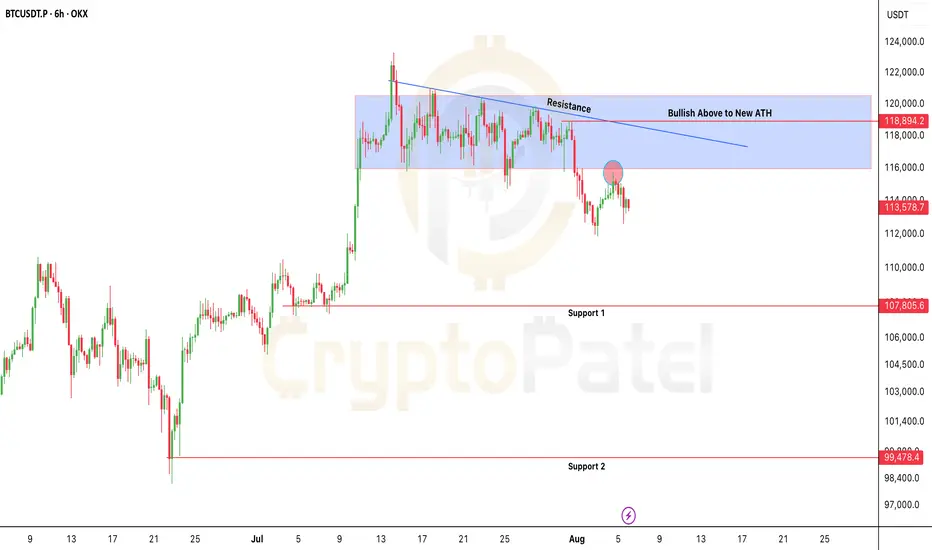
Bitcoin at Risk: $115.7K Is the Line Between Bounce or BreakdownBitcoin at Risk: $115.7K Is the Line Between Bounce or Breakdown
CRYPTOCAP:BTC is trading below key resistance ($115.7K–$118.9K) and rejected cleanly at the trendline.
As long as price holds below $115,700, bearish bias remains.
⚠️ Failure to reclaim = high risk of breakdown toward $107K and even sub-$100K levels.
Bearish invalidation only above $119K
NFA & DYOR
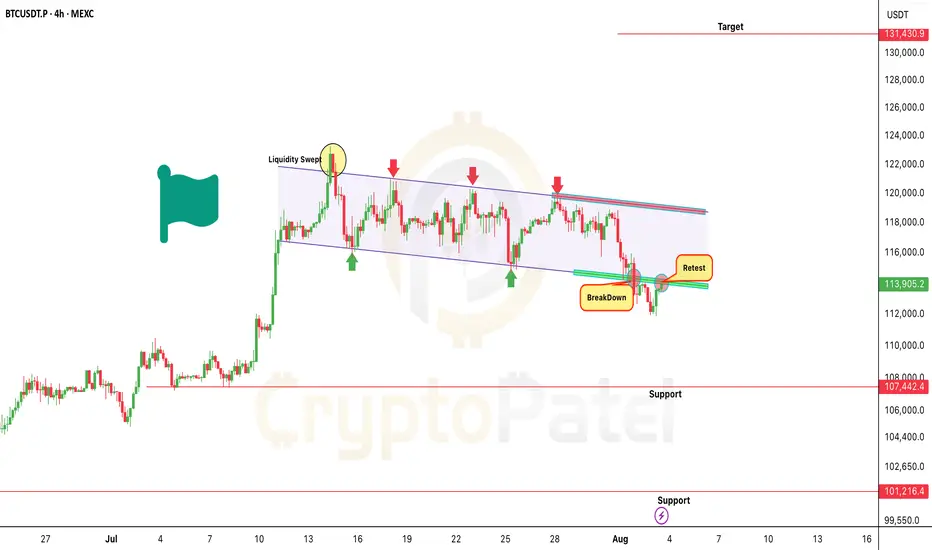
Bitcoin Breakdown or Bull Trap? $100K or $131KAs previously shared CRYPTOCAP:BTC had a potential to tap $114K when it was around $120K.
But now, $114K support has broken, and price is currently trading in the bearish retest zone post-breakdown.
Bearish Targets: $107,000/$101,000
Important Note:
Watch $115,700 zone closely- This could be a liquidity sweep trap.
If any HTF candle (4H/D) closes strongly above $115,700, it invalidates the bearish structure and may flip into a bull flag breakout.
Key Levels:
Bullish Flip Zone: $115,700 (Close Above HTF = Exit Shorts)
Trend Reversal Trigger: HTF close above $119,000 → Can open door to $131,000
Remember:
Trade with confirmation, not assumption.
Always respect key levels and adapt if market structure shifts.
NFA & DYOR
Urgent Bitcoin Update: BTC Must Hold $110K🚨 Urgent Bitcoin Update: BTC Must Hold $110K – Or Risk Dropping Below $100K
BTC is trading near $113,900, sitting right on key support at $112K–$110K.
This zone is crucial- Holding it could lead to a rally toward $150K ATH.
But if BTC breaks below $110K, expect downside pressure with possible moves to: $100K / $93K / $83K
Price has also broken below the ascending trendline- a bearish sign unless bulls step in.
I mentioned exiting around $122K–$123K: Hope you booked profits ✅
Now, just observe how BTC reacts between $110K–$112K.
Note: NFA & DYOR

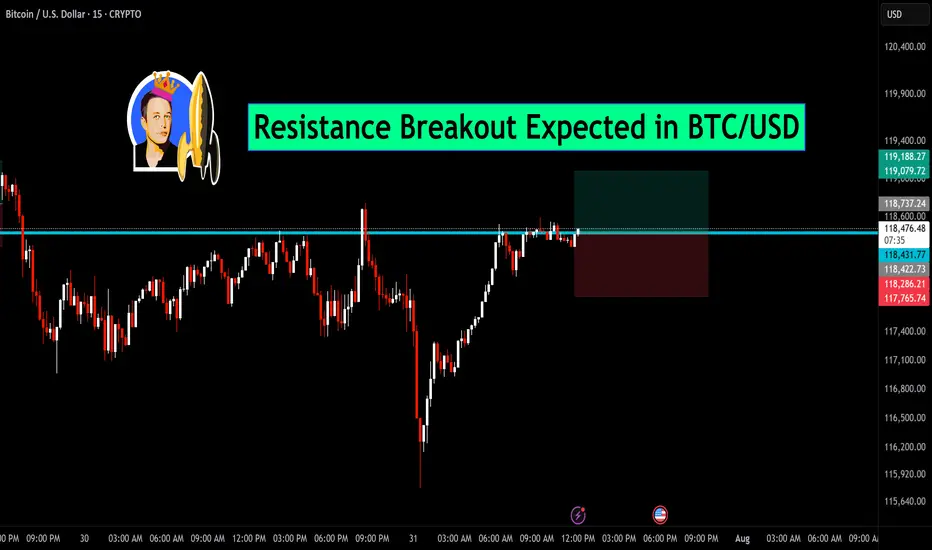
Resistance Breakout Expected in BTC/USDBitcoin is currently testing a key horizontal resistance near the $118,600 zone. After a sharp recovery from recent lows, the price is consolidating just below this level, indicating a potential breakout.
🔍 Chart Insights:
Price action forming higher lows, showing strength.
Breakout above the marked resistance may trigger a strong bullish move.
Tight consolidation near resistance suggests bulls are preparing for a push higher.
📈 Trade Setup:
Entry: Above $118,600 breakout
Target: $119,188 and beyond
Stop-loss: Below $118,200
If price sustains above resistance with volume confirmation, BTC/USD could witness fresh momentum on the upside. Stay alert for the breakout candle.
POL Could 3x After Breakout: Are You Buying the Right Zone?Price is consolidating above the accumulation zone ($0.19–$0.21) after multiple rejections off demand.
Now trading above this base, if price retests the zone, it could offer a high-probability entry.
Key Resistance = Targets: $0.28 → $0.41 → $0.52 → $0.70 → $1–$2
Structure remains valid above $0.150 (HTF close below = invalidation)
Break + Retest of $0.28 = Bullish continuation confirmed
Setup: Accumulation → Expansion
NFA & DYOR

LPT/USDT could 10x soon — If it breaks $8.50, it may fly to $64+LPT/USDT could 10x soon — If it breaks $8.50, it may fly to $64+
🔹 Structure: Accumulation within defined range
🔹 Volume: Gradually increasing near base – sign of quiet accumulation
🟩 Accumulation Zone: $5.00 – $7.50
Price has respected this zone for weeks, with multiple wicks and strong recoveries- suggesting buyer interest and absorption of supply.
🔻 Strong Support: $3.70
Only bullish bias is valid above this zone. A weekly close below it invalidates the bullish setup.
Key Resistances: $8.50/$22.14/$64.67
Structure Bias:
Forming a macro rounded bottom- a Bullish reversal base. Breakout above $8.50 could trigger trend expansion toward higher timeframe targets.
Observation: Breakout + Retest of Resistance 1 = Momentum confirmation. Hold bias only above weekly closes above R1.
Note: NFA & DYOR Before any Investments.

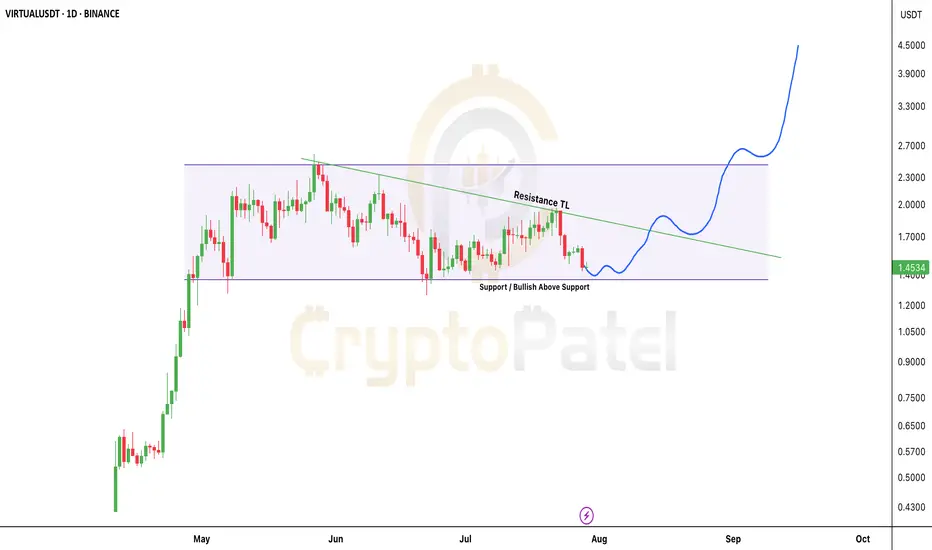
$VIRTUAL Gaining strength- hold above $1.30 could send it to $5$VIRTUAL/USDT: SPARKS:VIRTUAL is Gaining strength- hold above $1.30 could send it to $5+
Price is respecting the accumulation range between $1.30–$1.60 with multiple successful retests of the demand zone at the base.
🔹 Structure: Accumulation phase within a descending triangle
🔹 Support: Strong base at $1.30 – bulls defending this level consistently
🔹 Resistance: Descending TL compressing price- breakout imminent
🔹 Bias: Bullish above $1.30
Expectations:
✅ Clean breakout above the TL (~$1.60) will flip structure bullish
✅ Post-breakout targets: $2.00/$2.70/$4.50+
✅ If $1.30 continues to hold as HTF support, I’m expecting $5+ in the coming days.
Invalidation: Any HTF close below $1.30 shifts the bias.
Watch for breakout volume- confirmation will trigger rapid upside movement.
NFa & DYOR
Bitcoin rebounds with strength after whale dumpAfter a surprising sell-off triggered by whale pressure, Bitcoin (BTCUSD) has shown impressive internal strength, bouncing quickly from the Fibonacci support zone between 114,488 and 116,571 USD (0.618 – 0.5 levels).
The D1 chart reveals that the bullish structure remains intact, with EMA 34 and EMA 89 acting as solid support levels. The recent "dump" did not alter the overall trend; on the contrary, it created an opportunity for reaccumulation within the price box—serving as a vital base for the next breakout.
A likely scenario is that BTCUSD will continue to move sideways for a few more sessions before targeting the 1.272 Fibonacci extension near the 128,000 USD area. If this plays out, it would be a strong confirmation of the next growth phase for Bitcoin.
Do you believe Bitcoin is ready to break all-time highs and set a new record? Share your thoughts below!

Buy BTC @ 117250 area - FIB LevelEvery one know BTC is in 5th main wave and in that it has done first wave and now second correction wave which is mostly 50% FIB level of first level coming at 117250 area where i strong suggest every one to buy long positions again in BTC

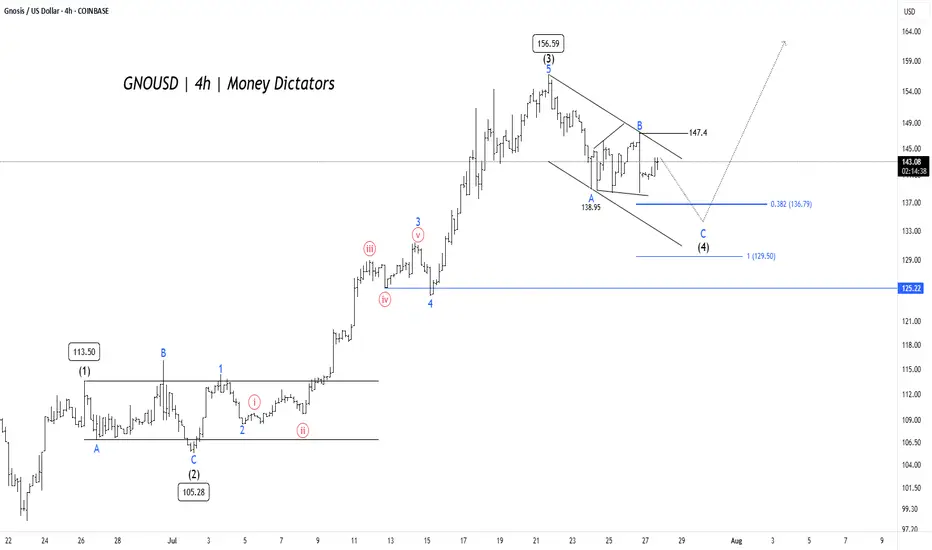
GNO/USD Price Action Aligns for Final Wave 5 PushGNO/USD pair is unfolding a clean Elliott Wave impulse pattern on the 4-hour chart. The rally began with Wave (1) reaching 113.50, followed by a corrective Wave (2) that bottomed near 105.28. This set the stage for a powerful Wave (3) that surged to 156.59 , aligning well with Elliott Wave theory where Wave 3 is typically the strongest and steepest leg in the sequence.
Wave (4) is now in progress, taking the form of an A-B-C correction inside a descending channel. Interim support was found at 138.95 during Wave A, and Wave C could extend toward the 0.382 Fibonacci retracement level at 136.79 or the deeper support zone near 129.5. These levels are crucial, as they often mark the end of a corrective phase and the beginning of the next impulse. A confirmed breakout above 147.4 would signal the start of Wave (5) and the return of bullish momentum.
Short-term targets have the potential to reach 135 – 128 , while 125.22 remains the invalidation level for this bullish setup. After the completion of Wave (4), traders can look for long opportunities targeting 147 – 154 – 172 . As long as the structure holds and price respects key supports, the outlook remains favorable for a fresh push higher in Wave (5).
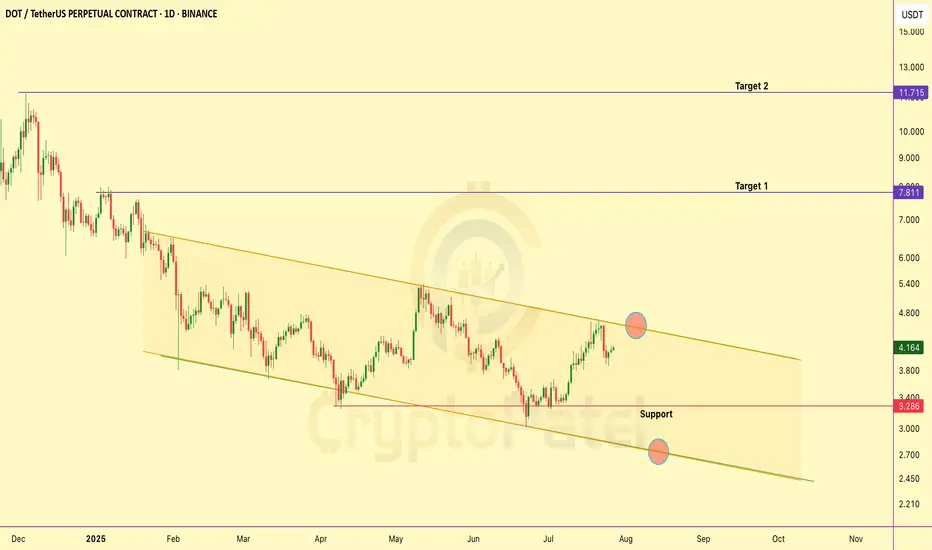
Polkadot is at $4.60 — breakout or last chance to buy?Polkadot is trading just under a key resistance at $4.60 — a level it’s failed to break several times in the past.
If it finally breaks above this, we could see a strong rally toward $8 and maybe even $12 in the coming weeks.
But if it gets rejected again, the price might drop back to the $3.30–$2.60 zone which has been a strong support area before and a good place to build long positions.
For now, DOT is still inside a long downtrend. A clean breakout above $4.60 could flip the whole structure bullish.
If it breaks — it could fly
If it fails — it’s a re-entry chance
Risk-takers can start slow accumulation from here because let’s be honest, no one can predict the exact bottom or top.
Not: NFA & DYOR
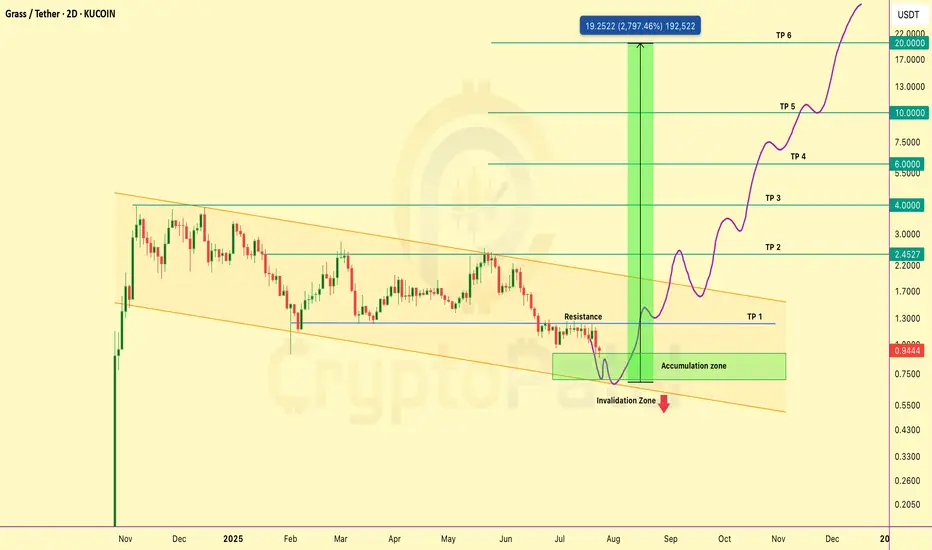
GRASS could grow 10x in this bull run: Don’t ignore this AIGRASS could grow 10x in this bull run: Don’t ignore this AI project
Price is consolidating inside a falling wedge and holding the key accumulation zone around $0.60–$0.85.
A breakout above trendline resistance could trigger a strong bullish move.
🔸 Structure: Falling wedge
🔸 Invalidation: Close below $0.55
Targets on breakout: $1.30 / $2.45 / $4 / $6 / $10 /$20
Fundamental Highlights
🔹 DePIN x AI powered by Solana
🔹 Share your unused internet and earn $GRASS
🔹 Backed by Polychain & Tribe Capital
🔹 Over 2M users across 190 countries
🔹 ZK-proof privacy, passive income, and scalable L2 infra
🔹 Only 29% supply unlocked, next major unlock in Oct 2025
This isn’t just another altcoin. GRASS is building the decentralized data layer for AI.
NFA & DYOR
Bullish In Bitcoin Just My View
We Have to wait for an Confirmation can 5M candle I.e. Hammer or Bullish Engulfing, Marubozo...
Entry @ 119035
Sl @ 118170
Tp 1 @ 122287 ( Must Book 75%)
Tp 2 @ 125000 (With Trailing SL)
Have a Great Day guys

BTCUSDT – Uptrend Remains IntactBitcoin is undergoing a mild pullback after breaking out to a recent high near 120,000 USD. The price is currently consolidating within a price box ranging from 112,325 to 120,016 USD – a healthy pause before a potential continuation of the bullish trend.
The key support zone lies at 112,325 USD (Fibonacci 0.618), which could act as a launchpad if retested. Should buying pressure clearly re-emerge at this level, BTC may resume its upward trajectory and aim for the 1.618 Fibonacci extension at 132,459 USD.

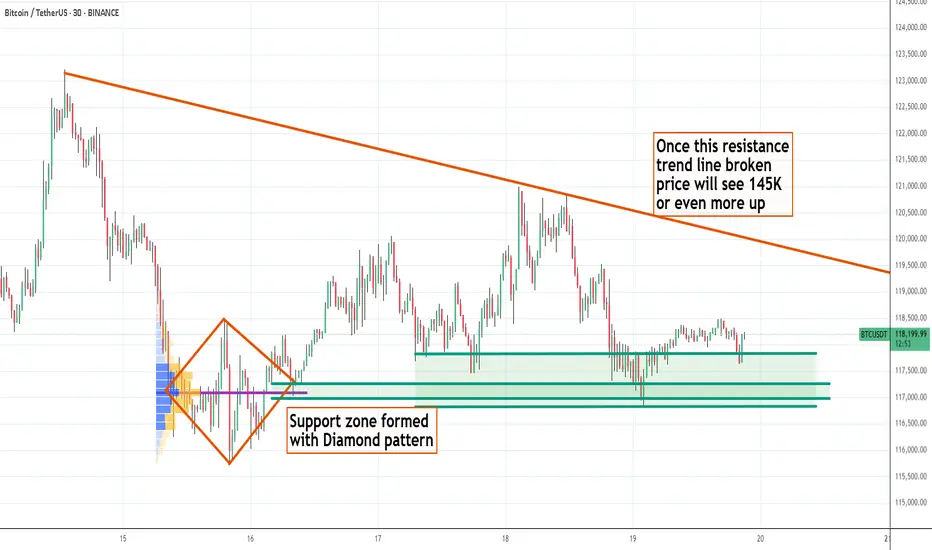
BTC - 19th July - Bullish with sideway correction - Target 145KBTC has been bullish with fundamental reasons - Fiat US $, US Govt Crypto Policy and non stop accumulation by Saylor and ETF, corporates etc ... every week and month new corporates adapting BTC After a good move price is now seeing side way correction and once the newly formed resistance line taken, I strongly expect BTC price to see 145 K easily
$XRP just broke its all-time high: $3.66CRYPTOCAP:XRP just broke its all-time high: $3.66 — and this is just the beginning?
After years of waiting, XRP finally explodes past $2 and hits $3.66 this bull run. It’s not just a win for XRP holders — it’s a lesson in patience, conviction, and catching early setups before the hype.
Why it matters now:
🔹 While everyone’s chasing the latest meme coin, XRP silently did a clean 7x from $0.50.
🔹 Regulatory clarity is improving — XRP’s bullish narrative is finally unfolding.
🔹 Market rotation is real: old giants like XRP are moving again, and this signals strength in Layer 1 comeback plays.
Quick breakdown:
📌 First signal at $0.50 → 7x
📌 Second entry below $2 → already 2x
📌 Current price: $3.66 (ATH)
📌 Many ignored it, some mocked it — but price tells the truth.
Patience beats hype. Quality setups > chasing pumps.
Save-worthy takeaway:
If you ever feel FOMO, remember this:
The best trades aren’t loud. They’re early, quiet… and require conviction.
What’s your biggest “I told you so” moment in this bull run?👇
Let’s hear your favorite early calls — drop them in the replies!
