BTCUSD - RESISTANCE RETEST IN PROGRESSSymbol - BTCUSD
Bitcoin continues to consolidate beneath the previously breached ascending trendline, with no distinct signs indicating the end of the corrective phase or the emergence of strong bullish momentum. A retest of the resistance zone is currently forming.
Bitcoin is trading within a defined range between 1,11,650 & 1,06,250 At present, there are no clear bullish reversal signals, and price action suggests a corrective move toward resistance before a potential decline into the liquidity pool near 1,06,250, shaped by prior consolidation and retesting activity.
Two critical resistance zones lie ahead — 1,11,650 and 1,13,600 Resistance at 1,11,650 has been validated. However, failure to sustain rejection here may lead to a test of the upper boundary. A false breakout in that area could trigger a subsequent pullback. Overall, the cryptocurrency market remains relatively subdued, reflecting ongoing uncertainty and caution surrounding broader macro and policy factors.
Resistance levels: 1,11,650 - 1,13,600
Support levels: 1,08,650 - 1,07,375 - 1,06,250
Current price action indicates a developing consolidation phase within a localized downtrend. A confirmed breakout above 1,13,000 and subsequent consolidation above 1,13,500 would strengthen the case for a potential trend reversal. Until such confirmation emerges, a pullback from resistance into the zone of interest remains the primary expectation.
Bitcoinprediction

BTCUSD SHOWING A GOOD UP MOVE WITH 1:10 RISK REWARD BTCUSD SHOWING A GOOD
UP MOVE WITH 1:10 RISK REWARD
DUE TO THESE REASON
A. its following a rectangle pattern that stocked the market
which preventing the market to move any one direction now it trying to break the strong resistant lable
B. after the break of this rectangle it will boost the market potential for break
C. also its resisting from a strong neckline the neckline also got weeker ald the price is ready to break in the outer region
all of these reason are indicating the same thing its ready for breakout BREAKOUT trading are follws good risk reward
please dont use more than one percentage of your capitalfollow risk reward and tradeing rules
that will help you to to become a bettertrader
thank you

BLOOD BATH IN BITCOIN Bitcoin is going to crash within 1/2 days only if sustains below 106,400 USD. We can plan for sell side after closing below the level. CRYPTO:BTCUSD . Mark the level and simple wait for the confirmation.

BTC - Long1. The colored horizontal areas show Fibonacci retracement levels, which traders use to spot possible support and resistance zones where the price might reverse or continue its move.
2. The 0% level is at the top (115,943) and the 100% level is at the bottom (109,523).
3. The price is currently near 113,207 and close to the 50% (112,732) and 61.8% (111,975) retracement levels.
4. Volume bars at the bottom show how much Bitcoin is being traded at each time.
5. If price bounces from the 50% or 61.8% levels (these are green and blue zones), traders can consider buying (long entry), hoping the price will go up. Always watch for a reversal candle or increased volume at these levels before entering.
6. Place your stop-loss just below the 61.8% level. For example, below 111,975.
7. Set your first target near the 38.2% level (113,490) and second target near the 23.6% level (114,428).
8. If price breaks below the 61.8% level with strong volume, avoid buying and look for a sell setup instead.
9. This setup uses common trading concepts like Fibonacci, support and resistance, and volume confirmation. Remember to wait for confirmation signals and manage risk with stop-loss orders.

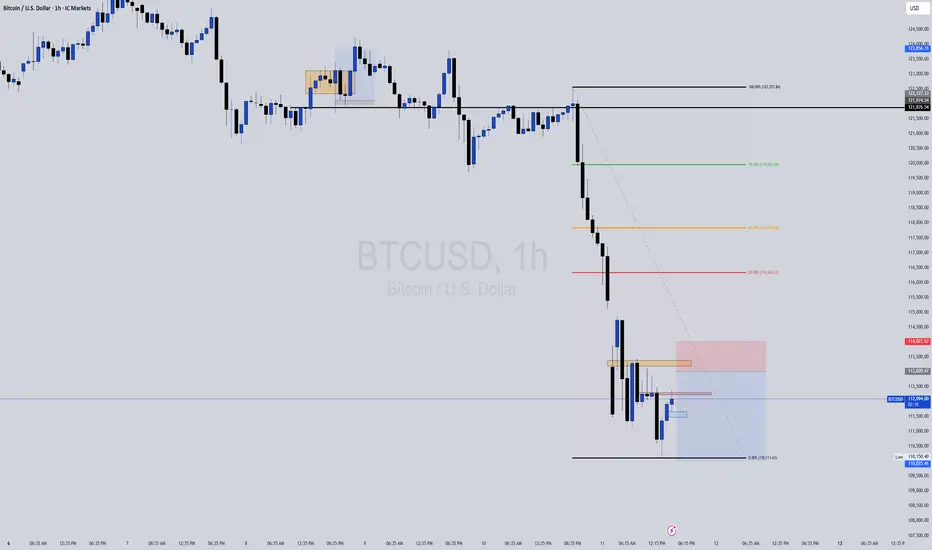
Bitcoin H1 Analysis: Shorting the Retracement After Major BrKDWNLet’s analyze your **BTCUSD H1 chart** carefully 👇
---
🧠 Chart Summary
* **Symbol:** BTCUSD
* **Timeframe:** H1
* **Current Price:** ~112,309
* **Sell Limit:** 113,041.61
* **Stop Loss (SL):** just above 113,041.61 (roughly near 113,300–113,400)
* **Take Profit (TP):** not explicitly shown but likely near 109,000–108,000 based on structure.
---
📊 **Technical Breakdown**
1️⃣ Trend Direction
* The pair is **in a clear short-term downtrend** after failing to hold above the **Previous Daily High (≈122,900)**.
* Price broke **below 50% and 61.8% Fibonacci retracement levels**, confirming bearish momentum.
* **Moving averages (Red = short-term EMA, Yellow = long-term EMA)** are both sloping **downward**, showing strong bearish momentum.
2️⃣ Key Structure Levels
* **Previous Daily High:** ~122,900 (Major resistance zone)
* **Previous Daily Low:** ~114,700 (Broken → retest expected)
* **Sell Limit Level (113,041.61):** Perfectly placed near the **Fibonacci 23.6%–38.2% retracement zone** of the last swing leg.
* This is an **ideal “lower-high” retracement entry** in a downtrend.
#### 3️⃣ Support Zones Below
Immediate support:** 111,800
Next key support:** 109,250 (around your possible TP zone)
Weekly low zone:** 108,350 – if that breaks, we could see a deeper push to 106,000.
---
⚙️ **Trade Plan Analysis (Sell Limit 113041.61)
| Aspect | Analysis |
| --------------------- | --------------------------------------------------------------- |
| **Setup Type** | Pullback Sell / Lower-High Entry |
| **Bias** | Strongly Bearish |
| **Entry Level** | 113,041.61 (Good retracement zone) |
| **Stop Loss** | Above 113,400–113,600 (just beyond structure) |
| **Take Profit** | 109,200–108,300 (previous support and 100% Fibonacci extension) |
| **Risk/Reward Ratio** | ~1:3 or better depending on TP placement |
| **Probability** | High – provided retracement completes to your Sell Limit |
---
🔥Confirmation Points Before Entry Triggers
If price retraces upward:
* Watch for **bearish engulfing** or **rejection candle** near 113,000 zone.
* If price fails to break above 113,400, your entry is valid.
* If it closes **above 113,600 on H1**, consider canceling the order — it would mean short-term momentum shifted bullish temporarily.
---
🧩 Summary Plan
✅ **Entry:** Sell limit at 113,041.61
✅ **SL:** 113,400–113,600
✅ **TP1:** 111,900
✅ **TP2:** 109,200
✅ **TP3:** 108,350
📉 **Bias:** Bearish continuation after pullback
---
⚠️Extra Notes
* Momentum is strong; if the retracement doesn’t reach 113,000, you might miss the entry — don’t chase.
* A secondary entry could form near **112,700** if a fresh rejection candle appears there.
* News events or BTC volatility spikes can create fake pullbacks — always watch the **H1 close** for confirmation.
-
ETHFIUSDT - BULLS ARE NOT DONE YET?Symbol - ETHFIUSDT
ETHFIUSDT is undergoing a corrective phase after updating its local high at 1.938 The breakout above the 1.677 zone appears to be an attempt to initiate a distribution phase following an extended period of consolidation. The key question now is whether the bulls can sustain control above this area.
Bitcoin is also in correction mode following a false breakout of its resistance level. In this context, the broader cryptocurrency market is experiencing a temporary decline. Nevertheless, the prevailing trend remains bullish, supported by a favorable fundamental outlook. Once the current correction concludes, market growth may resume.
On the daily timeframe, ETHFIUSDT is attempting to transition into a distribution phase after approximately five to six months of consolidation. The overall trend remains upward, and following the breakout of resistance, a corrective movement toward the liquidity zone at 1.677 is developing. A false breakdown, accompanied by a shift in market imbalance and subsequent consolidation above 1.678, could stimulate renewed buyer interest - potentially leading to further price appreciation.
Resistance levels: 1.898, 1.938
Support levels: 1.677, 1.534
The chart highlights two critical support zones - 1.677 and 1.534, Sustained bullish activity above the 1.677 level may result in a rebound and continued upward movement, confirming the ongoing distribution phase. Conversely, failure to maintain this level could prompt a retest of the zone at 1.534, where a liquidity sweep may subsequently trigger a new wave of buying pressure.

BTC LONG SETUPBTC/USDT – 1H Long Setup Analysis
🔹 Current Price: 111,653 USDT (Bitget Perpetual)
🔹 Trend: After a sharp drop from recent highs, BTC is showing signs of forming a base with a possible rebound setup.
⸻
Key Observations:
1. Support Zone:
• Strong support is visible around 110,744 – 110,747 USDT, marked by previous demand and horizontal structure.
• Below that, deeper support lies near 109,383 – 108,534 USDT.
2. Resistance Levels / Targets:
• TP1: ~115,078 – 115,980 USDT
• TP2: ~117,340 – 118,165 USDT
• Higher extension target: ~119,810 USDT
3. Trend Structure:
• Price broke a rising channel but has bounced back after a correction.
• Current pullback is retesting demand, indicating potential continuation to the upside if bulls defend the base.
4. Indicators:
• EMA 9 (blue) is currently under pressure, suggesting short-term weakness, but if reclaimed, momentum could shift bullish.
• Volume shows increased activity at recent lows, hinting at accumulation.
⸻
Long Trade Plan (Swing Bias):
✅ Entry Zone: Between 111,000 – 111,700 USDT (current price zone, near support)
✅ Stop-Loss: Below 110,744 USDT (to avoid fakeouts)
✅ Take Profit Targets:
• TP1 → 115,078 – 115,980 USDT
• TP2 → 117,340 – 118,165 USDT
• Extended TP → 119,810 USDT
📊 Risk-Reward Ratio: Favorable (approx. 1:3+ if targeting TP2).
⸻
Summary:
BTC is consolidating above a strong support base. If bulls hold the 111K–110.7K zone, upside targets remain valid towards 115K–118K. A break below 110.7K would invalidate this setup and could push price toward 109K or lower.

BTCUSD – Short Opportunity Building 30m Chart1. Price rejected from the supply zone near 115,700–115,800, showing resistance.
2. Current structure has shifted bearish with lower highs after rejection.
3. Key intraday support stands at 115,100–115,000; a sustained break below could accelerate downside.
4. Next demand levels to watch: 114,280 and 114,116, aligning with liquidity zones.
📉 Plan:
Short entries remain valid below 115,300.
First target: 114,280
Extended target: 114,116
Invalidation above 115,800.
Recommendation: Monitor for clean bearish continuation; keep risk tight due to BTC volatility.

It's Time to get fully Bearish on Bitcoin for next 3 years.I think this bull cycle is over now and now its time to get bearish on Bitcoin till 2028.
My targets of bitcoin for next three years is 76000 dollar or possibly 56000 dollar is conditions get worse.

BTC - OTE + SD Bearish Targets- As per my previous analysis, BTC Long targets were achieved perfectly and exactly from those levels a selling was expected. So, we hopped on to a SHORT trade at the TOP.
1. OTE (Optimal Trade Entry)
2. Bearish SD Targets (Standard Deviation Projections)
- Short Trade TP1 and TP2 are completed, which is almost 3000 points!
- Waiting for TP3
Do drop in your thoughts about this trade!
CRYPTO:BTCUSD Let's HODL!

BTC - OTE + SD Entry Model1H - 15m Analysis
1. Optimal Trade Entry (OTE) level tapped
2. Standard Deviation (SD) Projections marked out as Targets
2-2.5 zone as 1st TP
4-4.5 zone as 2nd TP
3. Liquidity pool below is set as StopLoss
Let's HODL!
Share your analysis as well!

BTC-USD Price Analysis!This analysis, using MACD and EMAs, aims to predict the price of BTC in the near term as well as in the coming years.

Trendline Support Retest in BTCUSDBTCUSD is currently retesting a crucial trendline support after a sharp pullback. Price broke above resistance earlier and has now returned to retest the breakout zone — a classic setup where buyers may step back in. ✅
📉 After a strong downtrend, we saw a bullish reversal pattern forming, followed by a clean breakout. This retest can act as a potential entry point for a long setup, provided the support holds.
📌 Key Levels:
Support Zone: ~$115,250 – $115,280
Resistance Zone: ~$116,180 – $118,200
Risk-Reward looks balanced with a well-placed SL below the retest candle.
🛡️ Watch for bullish confirmation (like a strong bullish engulfing or volume spike) before entering!
📅 Timeframe: 15-Minute Chart

BTC - TP 127200 confirmed coming !!! 29th july viewEveryone are in same page with respect to wave 5 is in progress and we will be seeing new high.
Inner waves of 5th wave is clear now with support formed and ABC corrective move of 2nd wave seems to be completed price moving up. when price respect fib levels and align with wave theory then we can predict the targets. 3rd, 4th and 5th are plotted based on the first 2 move and this will happen for minimum possibilities. so with this data points I am predicting TP of 127200 for BTC very soon in short term.

BTCUSD - Consolidation Breakout & RetestBitcoin has successfully broken out of its consolidation zone on the 15-minute chart. After a strong breakout above the horizontal resistance, we are now seeing a textbook retest of the breakout level, which may act as a fresh support.
✅ Bullish confirmation if price sustains above the breakout zone
📍 Resistance turned support at ~118,700
🎯 Upside momentum likely to continue if this retest holds

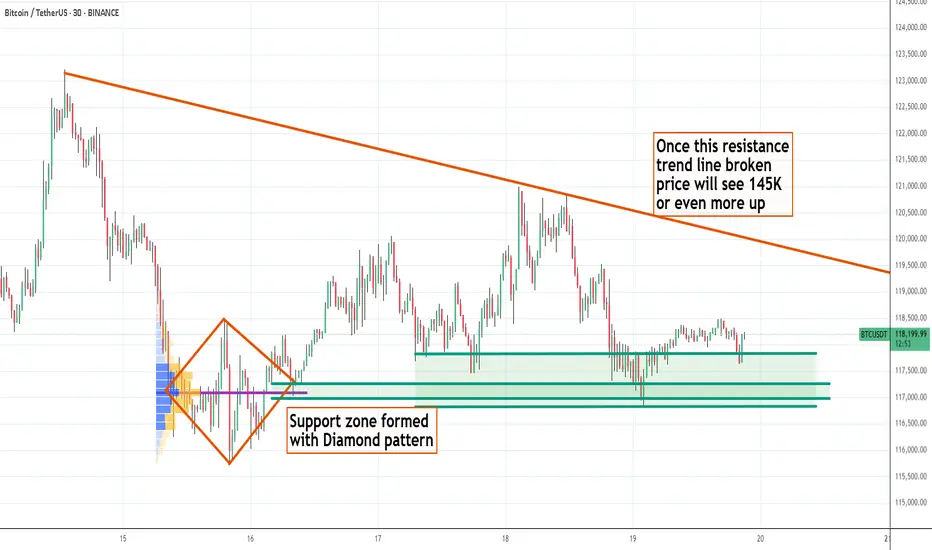
BTC - 19th July - Bullish with sideway correction - Target 145KBTC has been bullish with fundamental reasons - Fiat US $, US Govt Crypto Policy and non stop accumulation by Saylor and ETF, corporates etc ... every week and month new corporates adapting BTC After a good move price is now seeing side way correction and once the newly formed resistance line taken, I strongly expect BTC price to see 145 K easily
Bitcoin at Monthly resistance!Bitcoin is showing resistance currently at 108339 last month and 109327 this month.
Historically in monthly chart whenever the price touched the trendline, the price has seen a reversal.
Stay alert new investors and traders.

BTC - new ATH will happenIn the month of April, I clearly pointed out BTC will take support and will move upside only and all news are favorable for up move. In less than 3 months we are seeing the expected up move. From July first week I am expecting BTC to make new ATH and T1 is near 118K and T2 is around 130K and BTC could even see 145 K easily in this year 2025. All the news coming from US are only indicating higher levels for BTC. Avoid all other Alt coins and stay long in BTC for few more weeks to see the biggest profits in 2025.

BITCOIN: Wait For The Drop! Fellow Traders,
Hope you are doing great, in our view bitcoin is likely to drop around 90k region. So Expect price to breakthrough the sellers pressure and then drop around 95k first and then 90k which will be a key level for swing buyers.
Thank you

BTCUSD Short Opportunity – Bearish Channel Resistance TestPair: BTCUSD
Timeframe: 4H
I’m planning a short position on Bitcoin based on this well-defined descending channel structure.
🔹 Setup Explanation:
Price has been respecting a downward-sloping channel, with multiple touches at both the upper and lower bounds.
Currently, BTC is testing the upper trendline resistance of this channel near the $108,000–$109,000 area.
This area also aligns with prior supply zones where strong selling pressure emerged.
The recent impulsive move up appears overextended, increasing the likelihood of a technical pullback.
🔹 Potential Reversal Area:
Upper channel boundary: ~108,500–109,000 USD
Confluence with previous horizontal resistance
Weak momentum candles forming near this resistance
🔹 Trade Plan:
Entry Zone: Between 108,000–109,000 (as price consolidates near the channel top)
Stop-Loss: Above 110,000 to protect against breakout and invalidation of the pattern
Target Zone:
First Target (TP1): 104,500 (gray support zone mid-channel)
Second Target (TP2): 97,000 (lower channel boundary)
🎯 Risk-to-Reward:
Targeting a 1:2 to 1:3 R:R, depending on execution
This means risking ~1,500–2,000 points for a potential reward of 4,000–10,000 points
🛡️ Important Notes:
Watch for strong bullish momentum or a clean breakout above 110,000—this invalidates the setup.
Confirm rejection with lower timeframe bearish signals (e.g., bearish engulfing or supply zone rejection).
Be prepared to trail stop after TP1 is hit to secure profits.
✅ Summary:
This setup aims to capitalize on the potential rejection from the upper boundary of a long-standing descending channel, expecting BTCUSD to retest the mid and lower range support zones.

$BTC 45-min Chart Analysis
Bitcoin 💰 has just completed a clean 5-wave impulse move, peaking near $109K, and is now entering a short-term ABC correction phase.
Wave Count Overview🔎
(1)-(5) impulse wave completed
Wave (a) correction underway – already bounced off local support
Currently tracking Wave (b) relief rally
🔁 Wave B Retracement Key Level
0.618 Fib = $108,004
This level is a critical rejection zone. If CRYPTOCAP:BTC faces resistance here, expect continuation toward Wave C next.
🔻 Short-Term Scenarios
Bearish Case (ABC plays out)
🅰️ Wave (b) bounce may fade near $108K
🅱️ Wave (c) could drag price down toward $105.5K–$106K zone for completion
Bullish Case (Shallow Correction)
Holding above $107K and breaking $108K cleanly could invalidate Wave C
Price may resume impulsive structure if no deeper correction follows
⚠️ Key Observations
This is a standard post-rally correction, not a reversal
No panic unless $105K breaks
Next 12–24 hours crucial: will CRYPTOCAP:BTC reclaim $108K or head into deeper Wave C?
The trend is still bullish — this short-term ABC is a healthy cooldown. If bulls defend above $106K and reclaim $108K, momentum could quickly flip back in favor of a new rally.

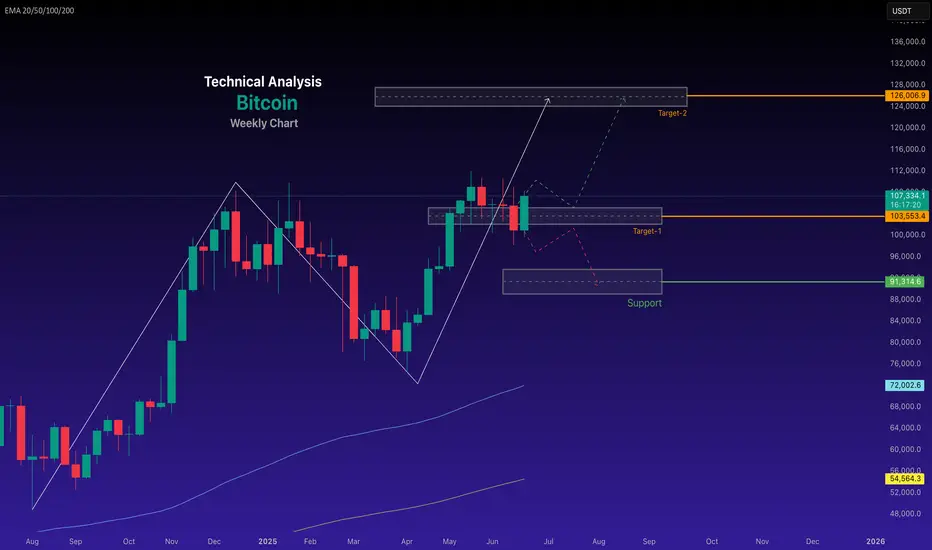
Bitcoin Technical Analysis for the Week of 29, June - 07, July
Here's a Bitcoin price analysis for June 29, 2025, based on available data and technical indicators from recent sources:
#Current Market Overview
Price: Bitcoin is trading around $107,331.08 as of June 28, 2025, with a slight 24-hour decrease of approximately 1.99%.
#Market Sentiment: The market shows a neutral to bullish sentiment. The Fear & Greed Index is at 65 (Greed), indicating optimism but not extreme euphoria. Technical indicators suggest a 67% bullish sentiment, with 25 bullish signals versus 5 bearish signals.
Trading Volume: 24-hour trading volume is around $43.1 billion, slightly below recent averages, suggesting cautious trading amid volatility.
~~ Technical Analysis ~~
Price Trends:
Bitcoin is currently testing support at the 20-day EMA ($106,211), with additional support at the 50-day EMA ($103,110) and 100-day EMA ($98,807). The 200-day EMA ($93,092) serves as a key macro support level.
The 50-day moving average is rising and remains above the 200-day moving average, forming a golden cross, a bullish indicator.
Bitcoin is within a descending triangle pattern, which could resolve by July 1, 2025. A breakout above $110,000 could signal a new bull run, while failure to hold $102,000–$104,000 may lead to a drop toward $95,000–$98,000. even to $90,000.
Key Levels:
Support: $100,000 (recently held), $98,000 (psychological), $95,000 (flag pattern lower border).
Resistance: $108,700 (recent high), $110,000 (key psychological level), $112,000 (all-time high from May 2025)
Trend Bullish - Chart for your reference
-- Disclaimer --
This analysis is based on recent technical data and market sentiment from web sources. It is for informational purposes only and not financial advice. Trading involves high risks, and past performance does not guarantee future results. Always conduct your own research or consult a SEBI-registered advisor before trading.
#Boost and comment will be highly appreciated
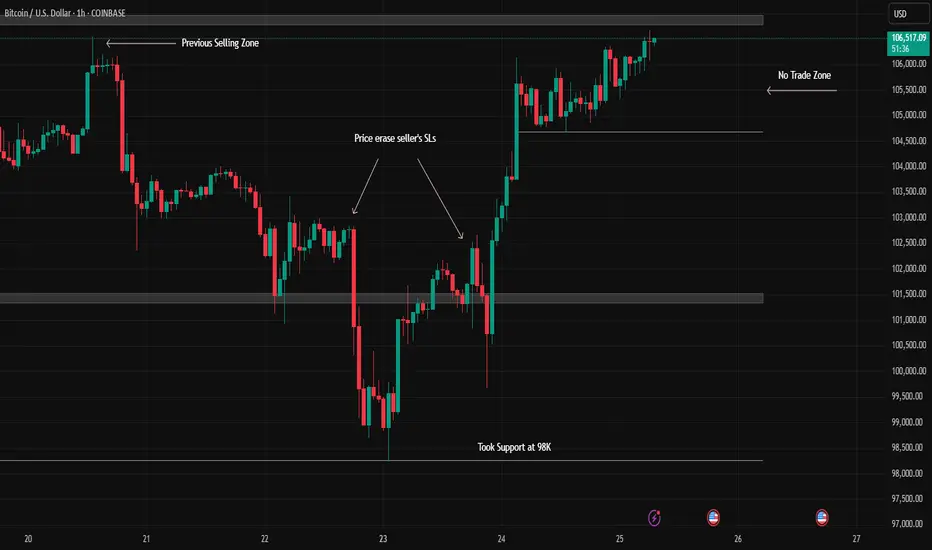
Bitcoin - Interesting Price Action in 1 HTFTRADERS AND INVESTORS,
The Bitcoin chart presents an interesting setup on the 1-hour timeframe (1 HTF). Here's a breakdown of recent price action:
Initial Resistance & Downtrend : Bitcoin's chart indicated potential trend changes, with significant selling pressure at the $106,000 mark establishing a clear resistance level.
Downtrend Confirmation & Support : This was followed by a series of lower highs, confirming a downtrend. Subsequently, Bitcoin found support and bounced from the $98,000 level.
Potential Reversal Signal : The recent upward movement cleared sellers' stop-losses, which could be an early indication of a potential trend reversal.
WHAT MIGHT HAPPEN NEXT?
Currently, Bitcoin is re-testing the crucial $106,000 resistance level.
Bullish Scenario : A confirmed breakout and sustained move above $106,000 could signal the continuation of an uptrend.
Bearish Scenario : Conversely, a strong rejection from this level might lead to a decline, potentially targeting the $101,000 support.
Current Stance : At present, this area appears to be a no-trade zone due to the indecisive price action.
Disclaimer : This analysis is for educational purposes only and should not be considered financial advice. Always conduct your own research before making investment decisions.