EURUSD – Breakout From Falling Resistance, Retest Holding WellEUR/USD was trading under a falling resistance trendline for a long time, with sellers consistently stepping in at higher levels. Recently, price managed to break above this trendline, which was the first sign that bearish pressure was easing.
After the breakout, price came back for a retest of the broken structure and previous resistance area. This retest is holding well so far, showing that buyers are defending the level and not allowing price to slip back below the structure.
What stands out here is how price respected the retest and then pushed higher, leaving behind a small imbalance. This often indicates acceptance above the breakout level rather than a false move.
As long as price holds above the retest zone and structure support, the path of least resistance remains to the upside, with higher resistance levels marked on the chart. A clean breakdown below this area would invalidate the bullish view.
This is a structure-based idea, not a prediction. Let price continue to confirm.
Disclaimer: This analysis is for educational purposes only and does not constitute financial advice. Trading involves risk. Please manage risk responsibly.
Breakandretest

GBPUSD – Breakout Retest Looks Healthy, Bulls in ControlGBP/USD has been trading below a falling resistance trendline for quite some time. Recently, price managed to break above this trendline, which is the first sign that selling pressure is weakening.
After the breakout, price did not continue straight up. Instead, it came back for a retest, and that retest is holding well so far. This is usually a healthy sign, showing that buyers are willing to step in at higher levels instead of letting price fall back below structure.
What Price Is Telling Us:
Price is respecting the previous resistance as support and forming higher lows. Sellers are trying, but they are unable to push price back below the trendline. This behavior often appears when the market is preparing for continuation rather than reversal.
As long as price holds above this zone, the bullish bias remains intact, with upside levels marked on the chart. A clean breakdown below the structure would invalidate this view.
This is a structure-based idea, not a prediction. Let price do the work.
If this analysis helped you, like, follow, and comment for more clean Forex breakdowns.
Disclaimer: This analysis is for educational purposes only and does not constitute financial advice. Trading involves risk, and past performance does not guarantee future results. Please manage risk responsibly.

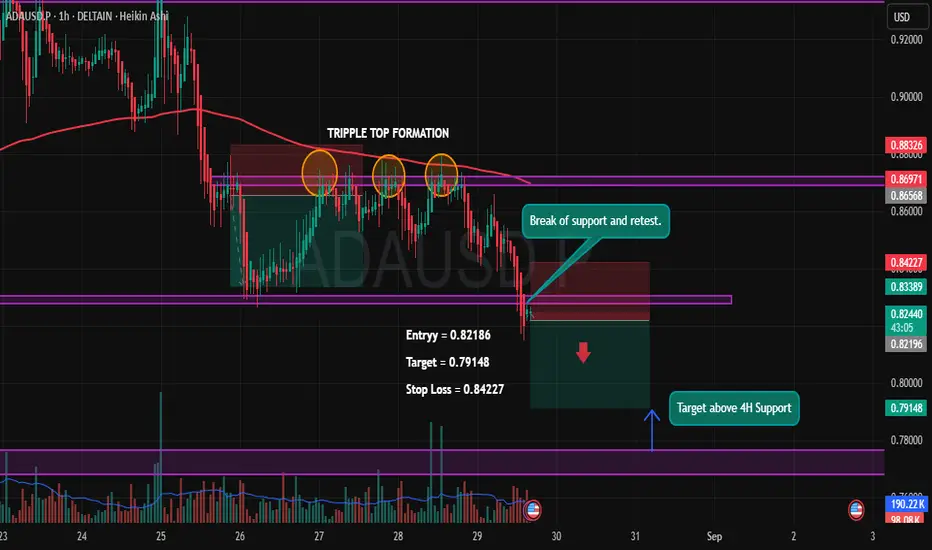
ADA/USDT – Triple Top Breakdown Play🔎 Setup Insight:
ADA has formed a Triple Top pattern near the 0.869 zone, confirming strong rejection from resistance. After multiple failed attempts to break higher, price finally broke down key support and is now retesting it, giving a clean short opportunity.
✨ Trade Plan:
Entry: 0.82186
Target: 0.79148 (Above 4H support zone)
Stop Loss: 0.84227
✅ Reasons for Short Bias:
Triple Top Formation ➝ Strong bearish reversal signal.
Break & Retest of Support ➝ Previous demand now acting as supply.
Confluence with 200 EMA rejection ➝ Trend remains bearish.
Volume Confirmation ➝ Selling volume stronger than buying.
🎯 Targeting the next major support on the 4H timeframe, with a favorable Risk-Reward setup.
⚠️ Disclaimer: This analysis is for educational purposes only and not financial advice. Always manage your risk before entering any trade.
Grindwell Norton - Powerful RetestNSE:GRINDWELL Made Beautiful Chart Structure today before Q4 Results with Good Price and Volume action.
Price Action Analysis:
Base Formation and Breakout: a critical technical development with today's powerful price surge:
1. Base Structure: Grindwell Norton formed a well-defined horizontal base in the ₹1,750-1,800 range (highlighted in green), which has served as strong resistance since January 2025. This level has been tested multiple times and rejected, creating a clear technical ceiling.
2. Today's Retest: With a massive 14.67% gain, the stock has finally retested through this stubborn resistance zone after multiple failed attempts. This represents a significant technical event after approximately 4 months of price struggle at this level with Volumes.
3. Prior Downtrend Context: The Retest is especially meaningful as it comes after a prolonged downtrend from the ₹2,300 level in late 2024, indicating a potential trend reversal.
Volume Analysis:
The volume characteristics strongly support the Retest breakout's validity:
- Today's volume at 79.44K shares is substantially higher than normal trading activity
- The volume spike (visible as a large green bar at the bottom) coincides perfectly with the price breakout
- Prior resistance tests showed diminishing volume, indicating sellers were becoming exhausted
- The volume pattern shows classic accumulation characteristics before the breakout
Key Support and Resistance Levels:
Key Resistance Levels
1. Immediate Resistance: ₹1,900-1,950 (prior consolidation zone)
2. Intermediate Resistance: ₹2,100 (previous reaction high)
3. Major Resistance: ₹2,300 (52-week high)
Key Support Levels
1. New Support: ₹1,750-1,800 (previous resistance may likely to act as support - this is critical)
2. Secondary Support: ₹1,550-1,600 (consolidation zone from April)
3. Strong Support: ₹1,400 (major reaction low from February/March)
Technical Pattern Recognition:
The chart demonstrates a classic "break and retest" pattern:
- Initial drop below the ₹1,800 level in early 2025
- Multiple attempts to reclaim this level
- Extended period of base-building and consolidation
- Final powerful Retest on exceptional volume
This pattern often precedes sustained upward movements, particularly when the Retest breakout occurs on high volume, as seen today.
Accumulation Indicators:
Several signs of institutional accumulation appear in the chart:
- Increasing volume on up days versus declining volume on down days
- Formation of higher lows since the March bottom
- Clear volume divergence during the April-May consolidation phase
- Today's massive volume spike suggests strong institutional buying
Technical Outlook:
The combination of a decisive breakout from a multi-month base coupled with exceptional volume support suggests the potential for continued upward momentum. The prior resistance level at ₹1,750-1,800 should now function as support in any pullbacks.
Traders should closely monitor whether the stock can maintain positions above the breakout level in subsequent sessions, as this will confirm the pattern's validity and potential for a new uptrend toward the ₹2,000-2,100 range.
Keep in the Watchlist and on your Radar.
NO RECO. For Buy/Sell.
📌Thank you for exploring my idea! I hope you found it valuable.
🙏FLLOW for more
👍BOOST if useful
✍️COMMENT below with your views.
Meanwhile, check out my other stock ideas on the right side until this trade is activated. I would love your feedback.
Disclaimer: "I am not SEBI REGISTERED RESEARCH ANALYST AND INVESTMENT ADVISER."
This analysis is intended solely for informational and educational purposes and should not be interpreted as financial advice. It is advisable to consult a qualified financial advisor or conduct thorough research before making investment decisions.

GEEKAYWIRE - Breakout and retest GEEKAYWIRE - Breakout and retest observed in Geekay Wires, the breakout was with good volumes.
This stock has excellent fundamentals and a classic compounder chart patterns. The company has been a very good performer with very impressive clientele.
This can be both a swing and long term option.
Note: These views are personal and for educational purpose. Please conduct your own research when investing.

BANKNIFTY - 13TH SEPTEMBER NSE:BANKNIFTY ANALYSIS FOR TOMORROW 🔺
❇️ IMPORTANT LEVELS 🚀
❇️ Support: 51730-51555-51420-50925
❇️ Resistance : 51950-52060-52225.
👉🏻 PURPLE LINE : 51555 is a key level, above buying, Below selling.
👉🏻 @thetradeforecast 🇮🇳

ASIAN PAINTS - INVERTED HEAD AND SHOULDER PATTERNThe stock has given breakout of INVERTED HEAD AND SHOULDER pattern & Retested
on the daily chart.
One can enter above 3054 with a strict Stoploss of 2970
Target 1 - 3200
Target 2 - 3280
Target 3 - 3360
#SWINGTRADE
#FUNDAMENTALLY STRONG STOCK
What is your view please comment it down and also boost the idea this help to motivate us. All views shared on this channel are my personal opinion and is shared for educational purpose and should not be considered advise of any nature.

Muthoot Finance - Risky 1:3 RR bet based on BO1. Volumes are low
2. Risk of BO failure
3. For now prices are sustaining above the BO level that's a good sign
4. Below Dz will be the best area to go long.
5. Trade with 10% SL
- Stay tuned for further insights, updates and trade safely!
- If you liked the analysis, don't forget to leave a comment and boost the post. Happy trading!
Disclaimer: This is NOT a buy/sell recommendation. This post is meant for learning purposes only. Please, do your due diligence before investing.
Thanks & Regards,
Anubrata Ray

TVS MOTOR INV HEAD & SHOULDER BREAKOUT & RETEST STRATEGY TVS MOTOR CO
1. Inv Head & Shoulder Pattern
2. Breakout & retest strategy
3. Close within 52W high zone (2313.45)
4. Close above the previous day's high (2238.80)
5. High increase in 1 month (+9.6%)
6. High increase in 12 months (+72.3%)
7. Promoter holding 50.27 %
8. Pledged percentage 0.00 %
9. Change in Prom Hold 0.00%
10. FII holding 20.8 %
11. Chg in FII Hold 1.56 %
12. DII holding 20.3%
13. Chg in DII Hold -1.53%
14. Stock PE 63.4
15. Industry PE 63.4
16. ROCE 18.8%
17. ROE 27.4%
For Educational Purpose Only

Unleashing Potential: VSTTILLERS's Exciting U.S. ExpansionThe recent strategic move by NSE:VSTTILLERS , an Indian firm known for its robust agricultural machinery, company is now the largest manufacturer of Power Tillers in India. NSE:VSTTILLERS has created waves in the financial markets. This analysis delves into the technical aspects of the company's stock performance following the announcement of their new subsidiary in the United States.
🔍 A New Frontier for VST Tillers
NSE:VSTTILLERS has announced the incorporation of a new subsidiary in the United States. This new company, named VST FIELDTRAC LLC, is a Limited Liability Company (LLC) and was incorporated on April 25, 20241.
The new subsidiary will be involved in the manufacturing and trading of tractors and other farm machinery. This move is generally seen as a positive development for VST Tillers Tractors Ltd. Incorporating a subsidiary in a foreign country can provide a company with new opportunities for growth and expansion.
The market responded positively, with the company's stock price surging by 5.74% immediately following the announcement. This uptick is a clear indicator of investor confidence in the company's growth trajectory.
Technical Breakout Insights : The stock exhibited a breakout from a consolidation phase, signaling strong buying interest and potential for further upward movement.
📈 Stock's Technical Journey
Post-announcement, VST Tillers Tractors Ltd. displayed a remarkable chart pattern that deserves a closer look:
Prior to this breakout, the stock was in a tight consolidation phase after a downtrend, which can be interpreted as stage 2 or an accumulation phase.
Interestingly, before the breakout, the stock was halted in a very tight range of 5% for around 1 month. This period of consolidation is a positive sign as it often precedes significant price movements. This halting occurred in a phase of stage 2, and the subsequent news led to a breakout of the stock.
A notable aspect was the stock's ability to break through a critical resistance zone, previously a strong barrier on multiple occasions. This breakthrough reflects a robust bullish sentiment among investors.
Entry Strategies for Traders : Aggressive traders might consider entering the stock if it surpasses the recent high of 3558, capturing the momentum. Conversely, conservative traders should eye the demand zone around 3480 for potential buy opportunities, especially if a retest of the breakout level occurs.
🌱 Final Thoughts & Cautionary Notes
While the expansion into the U.S. market and subsequent stock response are promising, investors are advised to conduct comprehensive research and align their trading actions with their risk tolerance and investment goals. It's crucial to remember that stock market investments carry risks, and past performance is not a reliable indicator of future results.
Lastly, thank you for your support, your likes & comments. Feel free to ask if you have questions. 💡 Trading is not just about strategies but about seizing opportunities. 🚀
Please note: This analysis is for educational purposes only and is not intended as a trading or investment recommendation. I am not a SEBI registered Analyst.

BREAKOUT IN ELIN 📌SWING TRADE FOR NEXT WEEK🚀
Hello Traders⚡
I am a Swing Trader by Passion i only trade on Momentum Stock's.
📌I Post Daily SWING CHARTS Analysis on My Trading view profile..
So let's Start
📌TRADE ANALYSIS OF ELIN
• Potential Breakout Chart
• Symmetrical Triangle Pattern
• Short Range Consolidation
• Price Can Take Retest from support Line
• Overall The Price Is Moving In HH-HL Formation
• Volume Buildup Near BO Zone
• Looks Good For 10-20% Upside Levels After The Breakout
📌 If you have any questions about any stock you can comment on post 📱
📌Disclaimer:-
This all chatrs analysis are only for educational purposes only
I do not provide any CALL or Tips

LINCOLN Perfect Breakout Retest candidate.The stock is retesting previous breakout. despite fall in market pharma stocks are holding strong.
Supporting SMA 30 and SMA 50.
No significant weakness in last two days fall.

MIDHANI has exhibited remarkable strength in the recent selling MIDHANI has exhibited remarkable strength in the recent selling market, showcasing its resilience and potential for further upside. Yesterday's breakout, shared in our group, highlights the stock's robust performance. Despite broader market conditions, MIDHANI has maintained a strong trajectory, reflecting its underlying strength.
Technical Analysis:
Uptrend Confirmation: MIDHANI is currently in a strong uptrend, demonstrating its ability to withstand market pressures. The consistent upward movement signals positive sentiment and investor confidence.
Consolidation Period: After a consolidation phase lasting around 3 months, MIDHANI formed a classic rounding bottom structure. This pattern suggests a potential reversal from a downtrend to an uptrend and is often indicative of a bullish trend reversal.
Breakout: Yesterday, MIDHANI successfully broke out of the consolidation range, confirming the validity of the rounding bottom pattern. This breakout is a powerful signal, indicating a shift in momentum and a potential start of a new bullish trend.
Maintaining Strong Levels: The stock is currently holding above the breakout level, showcasing resilience and confirming the newfound bullish momentum. This stability is a positive sign for traders and investors looking for a sustained uptrend.
Disclaimer: This post is for informational purposes only and should not be considered as financial advice. Always do your own research before making any investment decisions. Trading involves risks, and past performance is not indicative of future results.

PITTIENG Resilient Rally:Strong Uptrend with Potential Breakout.Technical Analysis:
Uptrend Formation: The consistent higher highs and higher lows demonstrate a well-defined uptrend, indicating strong bullish sentiment.
SMA Support: The recent price movements have shown significant support around the Simple Moving Averages (SMA), particularly the 50 SMA. This adds an extra layer of confidence to the overall bullish bias.
Breakout Potential: The current price is flirting with a breakout above a key resistance level. A decisive move beyond this point could trigger a strong bullish momentum.

Stock of the Week: SUNDARMHLD - A Bullish Opportunity Unfolding.Weekly Time Frame:
On the weekly chart, SUNDARMHLD is displaying strong bullish signals. The stock is currently undergoing a retest, which often signifies a robust support level. What's particularly noteworthy is the formation of a rounding structure, indicating a potential reversal or continuation of the current uptrend. This structure has the potential to set the stage for a sustained upward move.
Daily Time Frame:
Zooming in on the daily chart, we observe a breakout from the rounding structure mentioned earlier. This breakout not only validates the strength of the bullish trend but also provides an excellent entry point for traders. The gradual consolidation and accumulation over the past few days indicate a healthy and controlled price action, allowing for strategic entry positions.
Key Technical Indicators:
Higher Highs and Lower Lows: SUNDARMHLD is consistently establishing higher highs and lower lows, a classic sign of a healthy and sustainable uptrend. This pattern suggests a strong buying interest and potential for further price appreciation.
Risk Management:
As with any trade, it's essential to implement a robust risk management strategy. Consider setting stop-loss orders to protect your capital and adhere to sound risk-reward ratios. Additionally, stay informed about relevant news and market developments that may impact the stock's performance.
In conclusion, SUNDARMHLD is shaping up to be an exciting opportunity for traders seeking a bullish play. Keep a close eye on the stock's price action, and may the markets favor your trades! Happy trading! 📈💰
(Note: This analysis is for informational purposes only and does not constitute financial advice. Please conduct your own research and consult with a financial advisor before making any investment decisions.)

NAZARA: 1 Year Cup BreakoutNAZARA is breaking out of a 1 Year Cup pattern. Breakout has retested and bounced and lets see if it sustains. High RSI and Volume at breakout.

FACT: Fresh BreakoutFACT is taking good support on rising trendline. Breakout of 3 month resistance, then retest and continues breakout of last high on good volumes and good RSI.

Possible Upside Trade IDEA | Everything Mentioned on Chart .52 Weeks High Stock
Everything Mentioned on Chart. If you have any Question Regarding this please comment down Below

EURUSD break and retest setup.this is eurusd setup . if this daily candle closes under the green zone then we will wait for retest and then sell to the next structure which is shown as back line ...

Long jyothylabs retesting with green candle on 163-164 Able to sustain 162-163 resistance level and now retesting it again

Coromandel Short to Mid term EntryNSE:COROMANDEL Coromandel gave a breakout of a resistance trendline on March 17, 2022 , now it has retested the levels n rising again . T1 - 930 , T2 - 1020 , T3- 1100 keep SL of 700

VRL Logistics: Medium term outlookStock made an all time high and is now retesting the breakout levels.
10% dip from top with low volume and is now in demand zone i.e, 450-480 levels.
Stop loss: closing below 439
Target 1: New ATH (>534.8)
Target 2: Open
Disclaimer: for education purpose only.
