BUY TODAY SELL TOMORROW for 5%DON’T HAVE TIME TO MANAGE YOUR TRADES?
- Take BTST trades at 3:25 pm every day
- Try to exit by taking 4-7% profit of each trade
- SL can also be maintained as closing below the low of the breakout candle
Now, why do I prefer BTST over swing trades? The primary reason is that I have observed that 90% of the stocks give most of the movement in just 1-2 days and the rest of the time they either consolidate or fall
Cup and Handle Breakout in PRECAM
BUY TODAY SELL TOMORROW for 5%
Breakout!

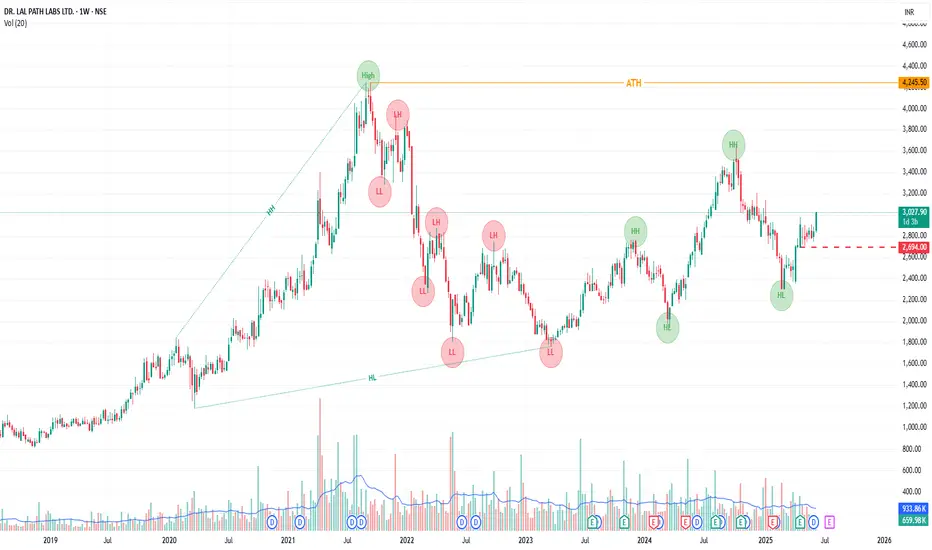
LALPATHLAB By KRS Charts12th June 2025 / 12:44
Why LALPATHLAB?
1. Fundamentals are good company's figures are stable and giving Dividends too.
2. Technically, All Time Bullish Stock making Higher Highs and H.Low.
3. Today in 1D timeframe it broke neckline of invt. Head & Shoulder chart pattern.
4. NSE:CNXPHARMA is also looking good which is one more reason to be bullish on one of a good company.
Targets will be New High Point 3750+ Rs.
SL is mentioned in Chart.
BUY TODAY SELL TOMORROW for 5%DON’T HAVE TIME TO MANAGE YOUR TRADES?
- Take BTST trades at 3:25 pm every day
- Try to exit by taking 4-7% profit of each trade
- SL can also be maintained as closing below the low of the breakout candle
Now, why do I prefer BTST over swing trades? The primary reason is that I have observed that 90% of the stocks give most of the movement in just 1-2 days and the rest of the time they either consolidate or fall
Resistance Breakout in STYLAMIND
BUY TODAY SELL TOMORROW for 5%

Buy, Sell, or Skip? Backtesting Charts with Bar Replay!Using TradingView’s Bar Replay, I break down an old chart and reveal the exact logic behind whether it was a buy, sell, or skip trade. Perfect for traders who want to sharpen entry-decisions with real market context.

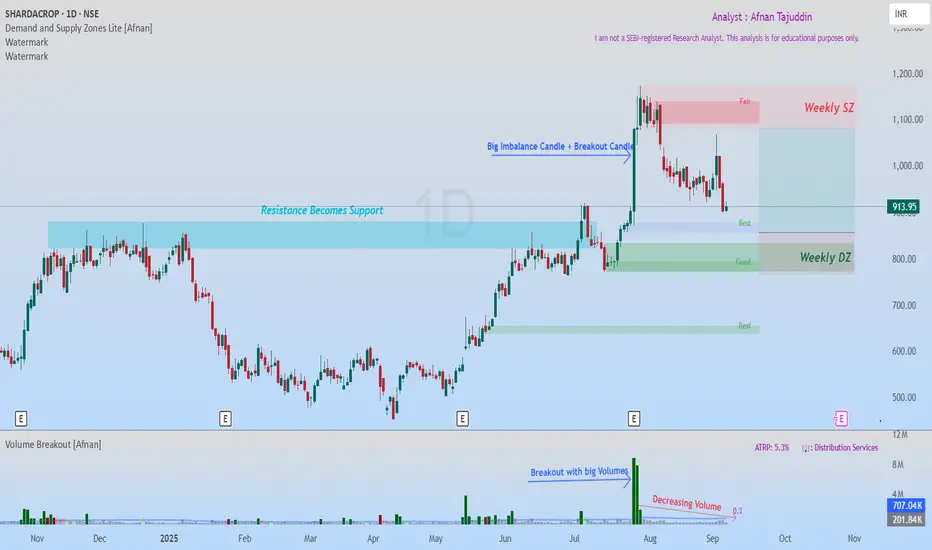
SHARDACROP: Smart Money Demand Zones Align with Classic BreakoutI've been tracking SHARDACROP, and what I'm seeing is honestly one of those setups that doesn't come around too often. There's something brewing here that caught my attention—and it's not just one signal, but two completely different analytical approaches pointing to the exact same conclusion.
Today, I'm breaking down this chart using the modern supply & demand approach that tracks institutional footprints, and the classic technical analysis. When these two methodologies start singing the same tune? That's when you know it's time to pay attention.
What makes this SHARDACROP setup special? Both methods are screaming the same message. And in my experience, that's usually when the big moves happen.
💡 Supply & Demand Analysis - Reading the Smart Money Trail 💡
Let's start with the supply and demand zones. Think of these as crime scenes—they're where the big players left their fingerprints. These aren't random levels; they're areas where massive institutional orders are sitting, waiting to be filled.
🎯 How the Big Players Play 🎯
Here's what most retail traders don't get: when institutions want to buy or sell millions of dollars worth of stock, they can't just hit the market buy button like we do. They'd move the price against themselves instantly. Instead, they layer in orders over time, creating these demand and supply zones.
So when price comes back to test a demand zone, we're betting that the same smart money players who were buying there before still have unfilled orders waiting. It's like they've set a trap—and price is walking right into it.
🔥 What Jumped Out at Me with SHARDACROP 🔥
Solid Weekly Foundation : There's a weekly demand zone that's been acting like a fortress
Stacked Daily Zones : Inside that weekly zone, we've got 1 daily demand zone and another demand zone is latest layered on top of each other.
Leg-out Candle Signature : That leg-out candle? Breaking to new highs, Pure smart money. The size of that imbalance tells me this wasn't retail traders getting excited
📈 The Setup That's Unfolding 📈
Now here's where it gets interesting. Price is drifting back toward our demand zone, and everything's lining up perfectly:
Entry Sweet Spot : Right within that established demand zone
Clean Risk Level : Stop goes below the zone—simple
Clear Target Path : Measured move up to the next supply zone
What I love about this risk-reward setup is the clean path to our 1:2.5 target. There's no major supply zone standing in our way, and the weekly trend is up.
⚡ Traditional Technical Analysis ⚡
Now let's flip the script and look at this through classic technical analysis. And you know what? The story gets even better.
🏗️ The Resistance That Finally Cracked 🏗️
This chart's telling a story I've seen a thousand times, but it never gets old:
The Struggle Phase : Price kept banging its head against the same resistance level, over and over
The Explosion : When it finally broke, it didn't just break—it demolished that level with a massive candle and huge volume
Volume Don't Lie : That breakout volume spike? That's confirmation the move was real
The Polarity Play : Now that old resistance is getting ready to flip into support—textbook price action
📊 Volume Tells the Real Story 📊
What really caught my eye is how volume's behaving on this pullback. As price drifts down toward our support zone, volume's drying up. That's not weakness—that's actually bullish. It means the selling pressure is fading, and when volume contracts like this during a retest, it often sets the stage for the next leg higher.
🎯 When Two Worlds Collide - The Confluence Magic 🎯
Here's where things get really exciting. I'm not just seeing one good setup—I'm seeing two completely different analytical methods pointing to the exact same opportunity:
Supply & Demand Says : Smart money demand zone with layered institutional support
Technical Analysis Says : Classic breakout retest with polarity support and volume confirmation
The Bottom Line : Both methods identify the same zone as the high-probability entry point
When this happens, I call it a "confluence setup." It's like having two different GPS systems both telling you to take the same route—you can be pretty confident you're heading in the right direction.
🌟 Putting It All Together 🌟
SHARDACROP's showing me: institutional footprints perfectly aligned with classic technical patterns. The Multiple Timeframe demand zones, the breakout retest setup, the volume behavior—it's all coming together in a way that makes me sit up and take notice.
But remember, even the best setups can fail. The market doesn't owe us anything, and it certainly doesn't care how confident we are. Trade smart, manage risk, and let the probabilities work in your favor over time.
💪 "The best traders aren't the ones who are right the most—they're the ones who make the most when they're right and lose the least when they're wrong." 📈
Disclaimer: This analysis is purely for educational purposes and isn't meant as trading or investment advice. I'm not a SEBI registered analyst. Always consult with qualified financial advisors before making investment decisions.
BUY TODAY SELL TOMORROW for 5%DON’T HAVE TIME TO MANAGE YOUR TRADES?
- Take BTST trades at 3:25 pm every day
- Try to exit by taking 4-7% profit of each trade
- SL can also be maintained as closing below the low of the breakout candle
Now, why do I prefer BTST over swing trades? The primary reason is that I have observed that 90% of the stocks give most of the movement in just 1-2 days and the rest of the time they either consolidate or fall
Resistance Breakout in ZYDUSWELL
BUY TODAY SELL TOMORROW for 5%

BUY TODAY SELL TOMORROW for 5%DON’T HAVE TIME TO MANAGE YOUR TRADES?
- Take BTST trades at 3:25 pm every day
- Try to exit by taking 4-7% profit of each trade
- SL can also be maintained as closing below the low of the breakout candle
Now, why do I prefer BTST over swing trades? The primary reason is that I have observed that 90% of the stocks give most of the movement in just 1-2 days and the rest of the time they either consolidate or fall
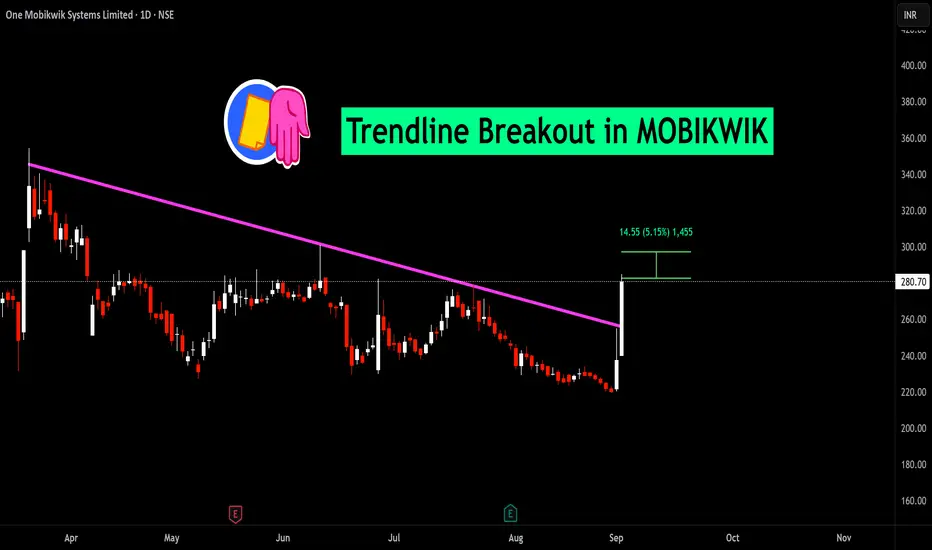
Trendline Breakout in MOBIKWIK
BUY TODAY SELL TOMORROW for 5%
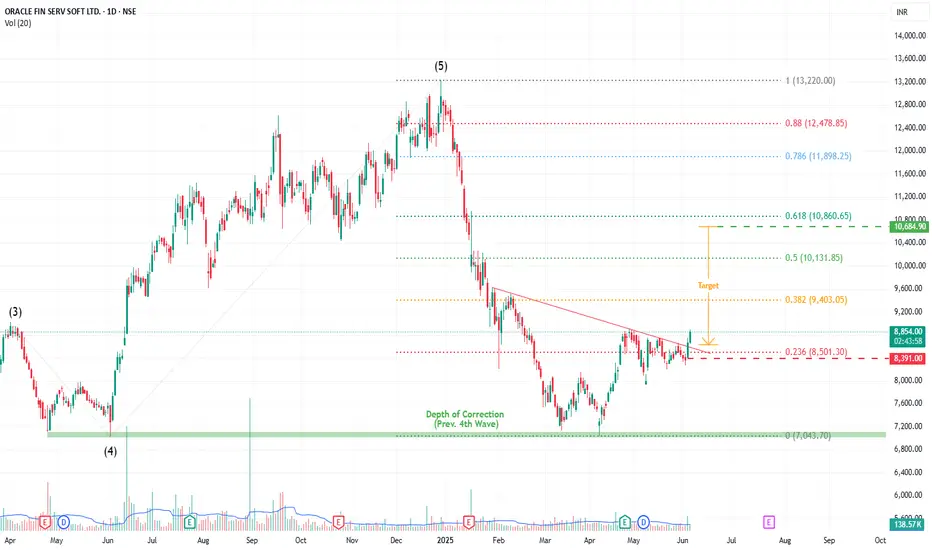
OFSS (ORACLE FIN SERVICE) By KRS Charts5th June 2025 / 12:35 PM
Why OFSS?
1. Fundamentally Good Company.
2. Technically, Bullish Stock for a long time and here again made higher low on bigger time frame.
3. Wave Theory vice it bounces back from 4th impulsive wave (Depth of Correction).
4. After that it has formed few bullish charts pattern like Invt. Head & Shoulder and Flag and Pole is also visible within.
5. Yesterday it Broke Neckline with good volume green candle.
Targets & SL (1D Closing Basis) is mentioned in Chart
Jindal Steel Breakout Study | Momentum, Volume & Key Levels📊 STWP Stock Analysis – JINDAL STEEL (3rd Sept 2025)
Price Action:
Jindal Steel surged to a CMP of ₹1028.35, marking an impressive +5.46% gain on the day. The stock is currently riding on strong momentum with a clear bullish crossover trend, signaling further upside potential. However, traders must remain cautious as the risk level is high, fueled by sharp price swings. What adds conviction to the move is the heavy volume participation, showing strong market interest and active participation by investors.
Volume & Participation
Jindal Steel witnessed a massive trading volume of 45.2 lakh shares today, almost 2x its 20-SMA average of 19.9 lakh shares (Volx: 1.98x ). This sharp surge in participation clearly highlights the presence of strong hands in action, adding weight to the bullish move and reinforcing market conviction.
Indicator Check
The indicators are painting a mixed yet insightful picture for Jindal Steel. The RSI at 61.1 shows strong momentum, while the CCI at 109 confirms a bullish bias. However, the MACD at -1.07 signals a slight bearish crossover, which needs monitoring. Meanwhile, the Stochastic at 98 suggests the stock is overbought, hinting at possible short-term profit booking. Importantly, prices remain above all key EMAs, reinforcing the broader bullish structure.
Key levels
Resistance: 1048/1067/1105
Support: 991/953/934
📰 Latest News Snapshot — JINDALSTEL
Jindal Steel & Power is making headlines on multiple fronts. In its Q1 FY26 results (Aug 12, 2025), the company delivered a strong turnaround with net profit at ₹1,494 crore, aided by a 32% QoQ jump in EBITDA and healthier margins at 24.4%, though revenues softened to about ₹12,294 crore. On the operational side, JSPL commissioned its first continuous galvanising line (CGL-1) at Angul, Odisha, enhancing its ability to supply value-added coated steel for automobiles, appliances, infrastructure, and construction — a big step in product diversification. Meanwhile, the market responded positively as the stock surged 4–5% on heavy volumes on September 3, 2025, also factoring in its recent ₹2/share final dividend declaration.
🧭 Sentiment Outlook & Investment Perspective
Jindal Steel & Power is showing a moderately positive outlook, backed by a strong turnaround in profitability with margins and EBITDA improving, while its new galvanising line at Angul adds valuable capacity in coated steel for autos, appliances, and infrastructure — a move that strengthens its long-term product mix and earnings potential. The recent surge in trading volumes and price action highlights strong market participation, which can attract further momentum buying in the near term. However, risks remain in the form of softer revenues, exposure to the cyclical swings of steel prices and exports, and the possibility of short-term corrections after sharp rallies. In the short term, volatility may stay elevated as the stock digests its recent gains, but in the long term, the focus on higher-margin products and disciplined capacity expansion positions the company constructively for sustainable growth — making it a stock to watch with cautious optimism.
🚀 Bullish Momentum
The stock is also riding on strong technical momentum, with a Bullish Marubozu candle and an Open = Low setup, both pointing to firm buying support. A Bollinger Band breakout following a BB squeeze indicates the potential for sharp price expansion. Adding to the momentum, an RSI breakout, combined with a powerful bullish candle structure, confirms the strength of the move. The setup even aligns with a possible Buy Today, Sell Tomorrow (BTST) opportunity, making the near-term trend look decisively bullish.
📊 STWP Trade Analysis – JINDAL STEEL
JINDAL STEEL is showing strong momentum supported by volume. I will consider my entry near ₹1030 as part of a breakout setup. If the stock dips closer to ₹1015, I will look at that as a more conservative entry with tighter risk, which suits my swing trading approach.
For me, the pullback level around ₹954.25 is an important support zone where buyers might re-enter, while the invalidation level near ₹910 would signal that my bullish view has failed. On the upside, I will be watching ₹1117 and ₹1205 as possible target zones if momentum continues. 🚀
⚠️ Disclaimer – Please Read Carefully
The information shared here is meant purely for learning and awareness. It is not a buy or sell recommendation and should not be taken as investment advice. I am not a SEBI-registered investment advisor, and all views expressed are based on personal study, chart patterns, and publicly available market data.
Trading — whether in stocks or options — carries risk. Markets can move unexpectedly, and losses can sometimes exceed the money you have invested. Past performance or past setups do not guarantee future results.
If you are a beginner, treat this as a guide to understand how the market works — practice on paper trades before risking real money. If you are experienced, always assess your own risk, position sizing, and strategy suitability before entering trades.
Consult a SEBI-registered financial advisor before making any real trading decision. By engaging with this content, you acknowledge full responsibility for your trades and investments.
💬 Found this useful?
🔼 Give this post a Boost to help more traders discover clean, structured learning.
✍️ Drop your thoughts, questions, or setups in the comments — let’s grow together!
🔁 Share with fellow traders and beginners to spread awareness.
👉 “If you liked this breakdown, follow for more clean, structured setups with discipline at the core.”
🚀 Stay Calm. Stay Clean. Trade With Patience.
Trade Smart | Learn Zones | Be Self-Reliant 📊

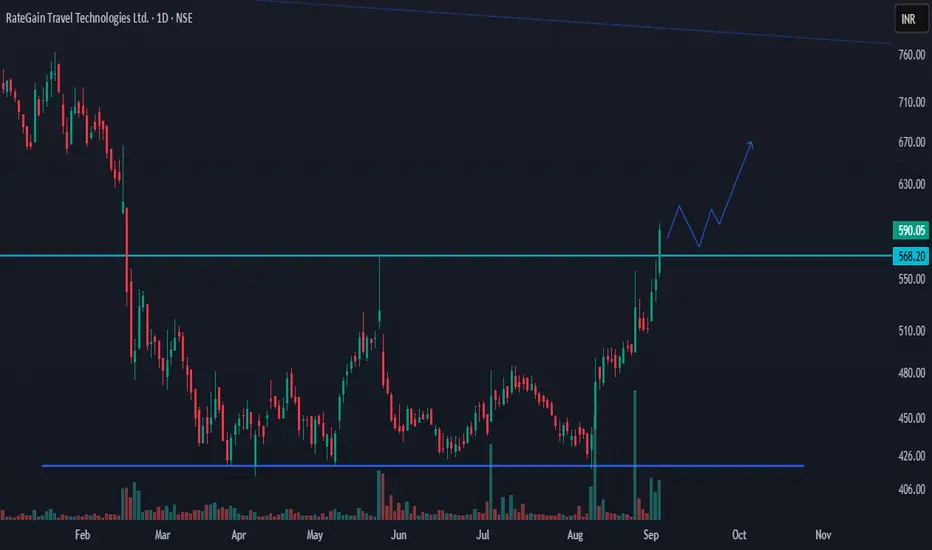
Breakout on daily chart - Holding TradeRATEGAIN is shaping up so nicely.
The stock built a base around 430–445 and has now moved back above the 568–570 zone, which turns into support if daily closes keep holding.
As long as price stays above 570, the next areas to watch are 645–660 and then 700-720, with a bigger hurdle near 800–810 from the old down‑trend line.
A healthy setup would be a dip toward 572–585 that shows buying strength; that gives a cleaner entry. Manage risk below 548 for a tight stop, or below 530 for a wider swing stop.
If the stock closes back under 570 and doesn’t quickly recover, treat it as a failed reclaim and wait. On the business side, the company has been posting double‑digit growth with improving margins from its AI‑driven travel‑tech products—so buying dips while 570 holds and higher lows keep forming makes sense.
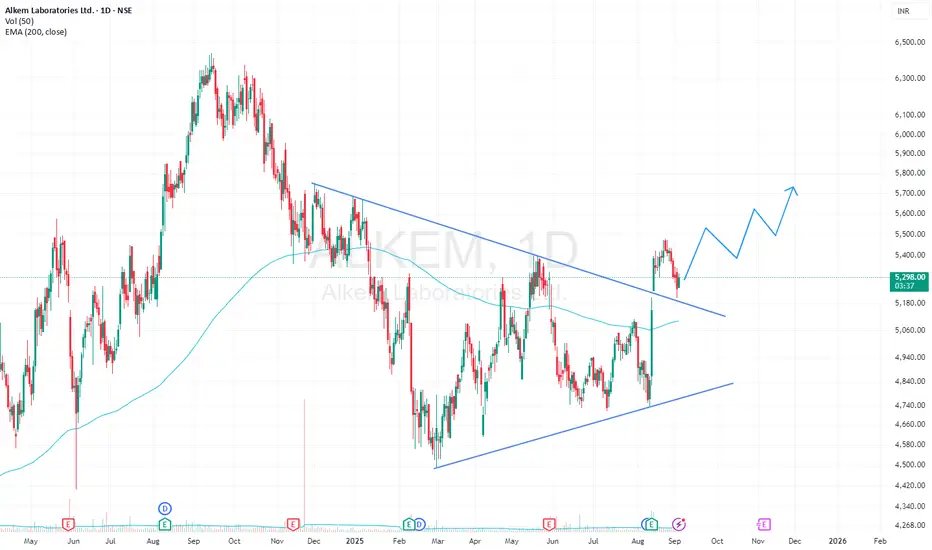
ALKEM Triangle BreakOutAlkem labs has given a breakout from Triangle pattern on 1D timeframe with high volumes. It is apparently retesting the resistance trendline. The stock is also trading above its 200 EMA.
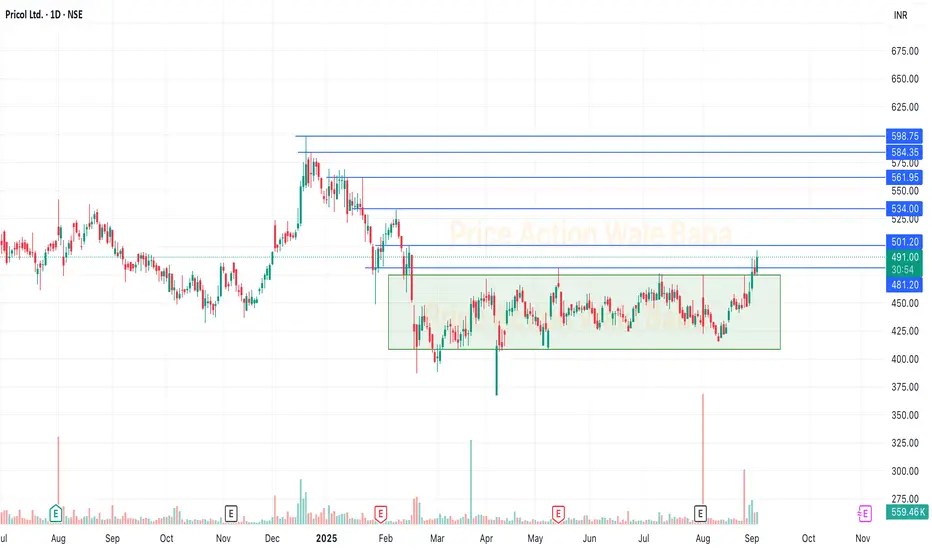
Pricol - Breakout from the Box.Pricol is looks good to buy and hold for the long term.
It has breakout from the box and ready to move up. Once it sustain above 500 than we can see the all target will hit one by one soon.
Target levels are market on the chart.
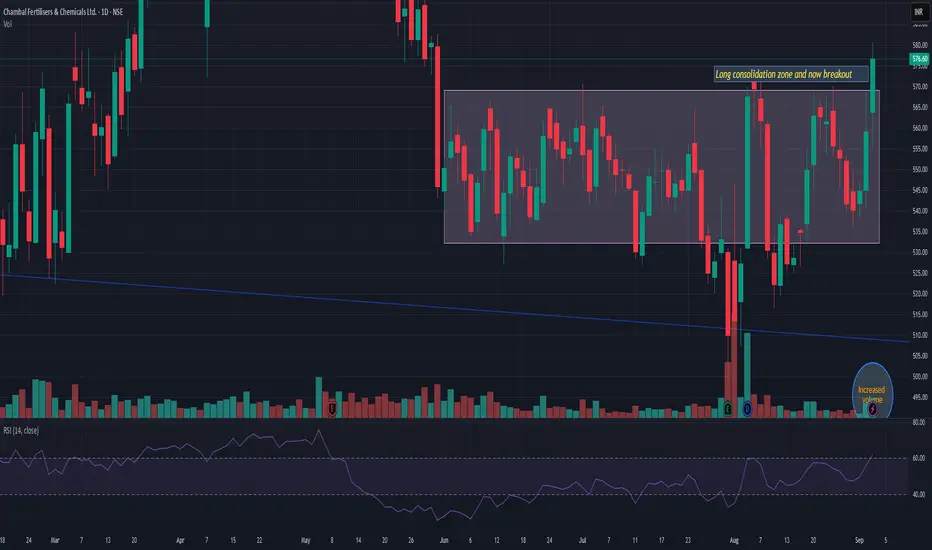
CHAMBLFERT CHAMBLFERT is giving rectangle breakout with decent volume. Stock is in consolidation zone since 1 quarter. Near term support is near 552. Next resistance seems to be near 635/666. Keep it watchlist.
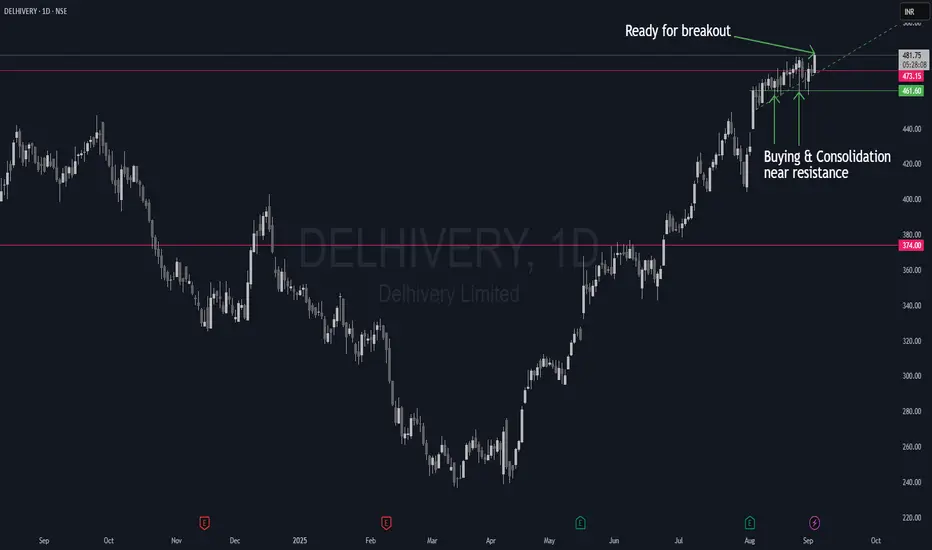
NSE:DELHIVERY - Breakout in progressAfter consolidating at the resistance for over three weeks, the stock is finally ready to launch and break above the resistance.
Entry: Break & Retest of resistance OR pullback to 9EMA/21EMA
SL: 448 (below the consolidation)
Target-1: 510
Target-2: 550
Disclaimer: The idea is for educational purposes only and must not be construed as advice to buy or sell. Consult your investment advisor before making the decision. Investments are subject to market risks.
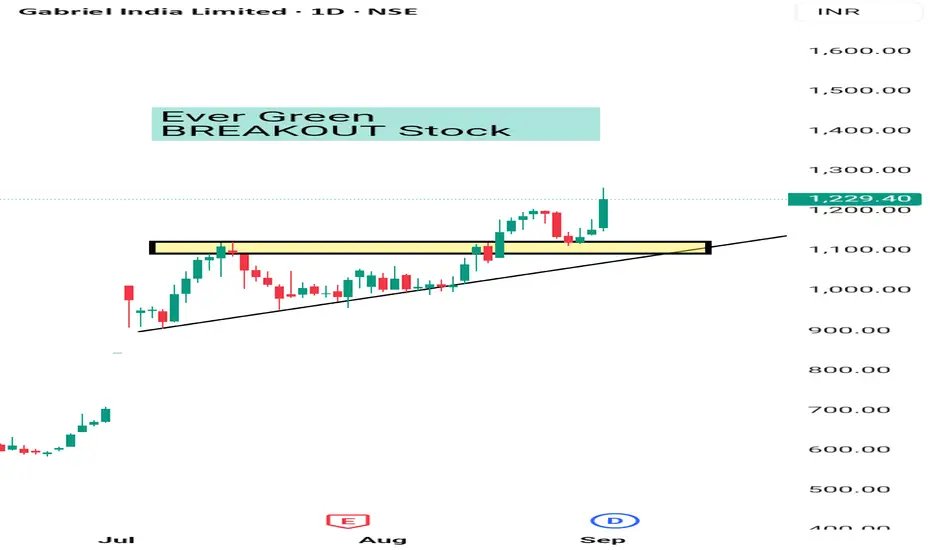
GABRIEL INDIA BULLISH CHART Gabriel India is a Strong Fundamental Company in Auto Component Sector . It's Technically also Breakout. It's a Uptrend Stock And moving Up with Sector and on basis of Gst Cut . Good bet for swing trading as well as long term . In swing trading u can expect 5 -6% move and in long term 20-30% move in next 6 months . No buy sell Reccomendation just for educational purposes only.
Always consult your financial advisor before making any position in stock market.
Multi-Confirmation Price Action: Fibonacci Zones, Base BreakoutsExplore multi-confirmation techniques using Fibonacci retracement to identify high-probability base breakout zones. Learn how to spot double bottom and inverted head & shoulders patterns at demand levels and execute confirmation trades for precision entries

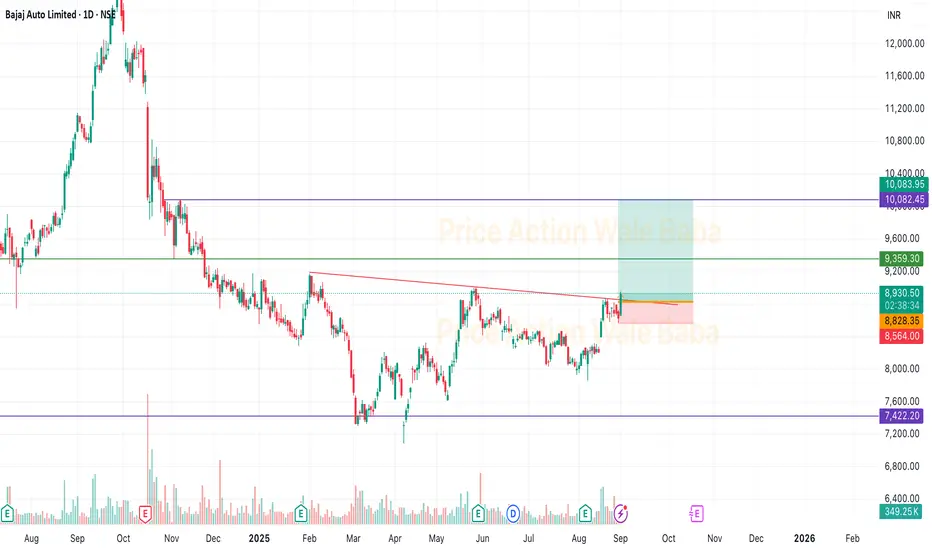
Bajaj Auto - BreakoutBajaj Auto has a trendline breakout and give good upside movement.
Good to buy now at cmp 8900 with the SL of 8560.
Strong upside move possible till 10080.
Above 10100, possible 10800-11500.
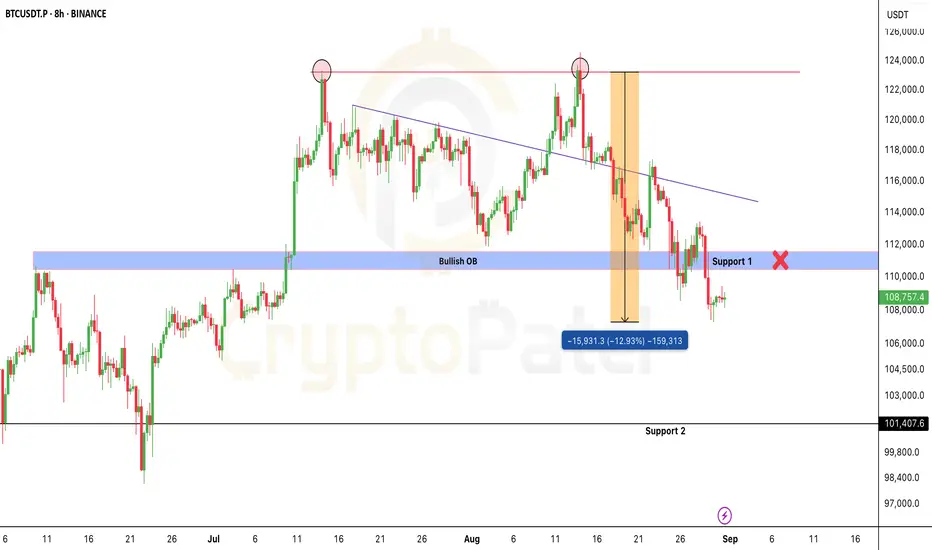
Bitcoin Chart Analysis And Bearish overview #BTC Bearish Outlook
Bitcoin stays bearish below $113,400.
No H4 close above = downtrend intact, targeting the $100K psychological level.
Break $100K support, and liquidity near $90K becomes the next magnet.
Key levels:
$113,400 → HTF resistance
$100,000 → Psychological support
$90,000 → Demand zone
Already 13% down from our short entry, hope you caught the move. 🫡
NFA & DYOR
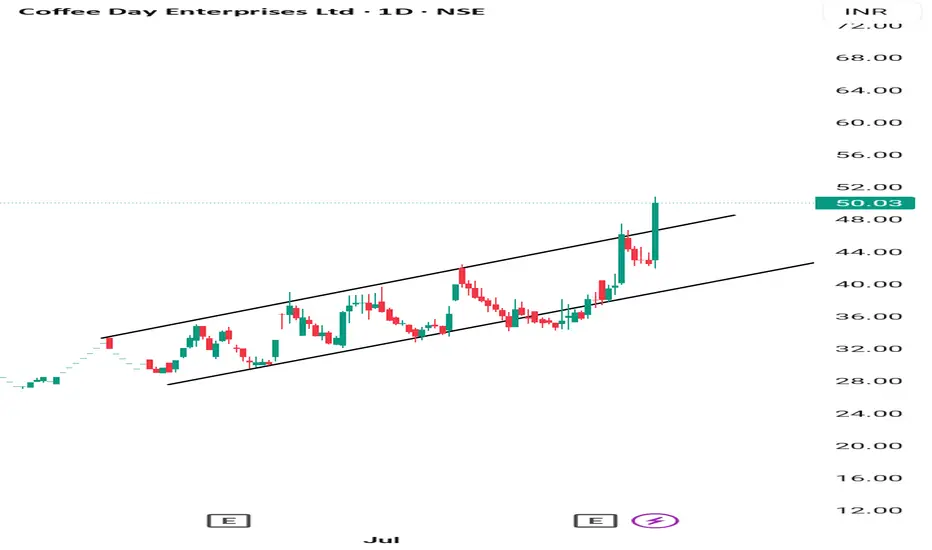
COFFEE DAY 1 DAY CHANNEL BREAKOUT Coffee Day Given Channel Breakout on 1 Day Chart . Coffee prices also increasing World wide bcoz of moonson. It's a good bet for next 10% 15%
BUY TODAY SELL TOMORROW for 5%DON’T HAVE TIME TO MANAGE YOUR TRADES?
- Take BTST trades at 3:25 pm every day
- Try to exit by taking 4-7% profit of each trade
- SL can also be maintained as closing below the low of the breakout candle
Now, why do I prefer BTST over swing trades? The primary reason is that I have observed that 90% of the stocks give most of the movement in just 1-2 days and the rest of the time they either consolidate or fall
Trendline Breakout in ROHLTD
BUY TODAY SELL TOMORROW for 5%

BUY TODAY SELL TOMORROW for 5%DON’T HAVE TIME TO MANAGE YOUR TRADES?
- Take BTST trades at 3:25 pm every day
- Try to exit by taking 4-7% profit of each trade
- SL can also be maintained as closing below the low of the breakout candle
Now, why do I prefer BTST over swing trades? The primary reason is that I have observed that 90% of the stocks give most of the movement in just 1-2 days and the rest of the time they either consolidate or fall
Round Bottom Breakout in APOLLO
BUY TODAY SELL TOMORROW for 5%

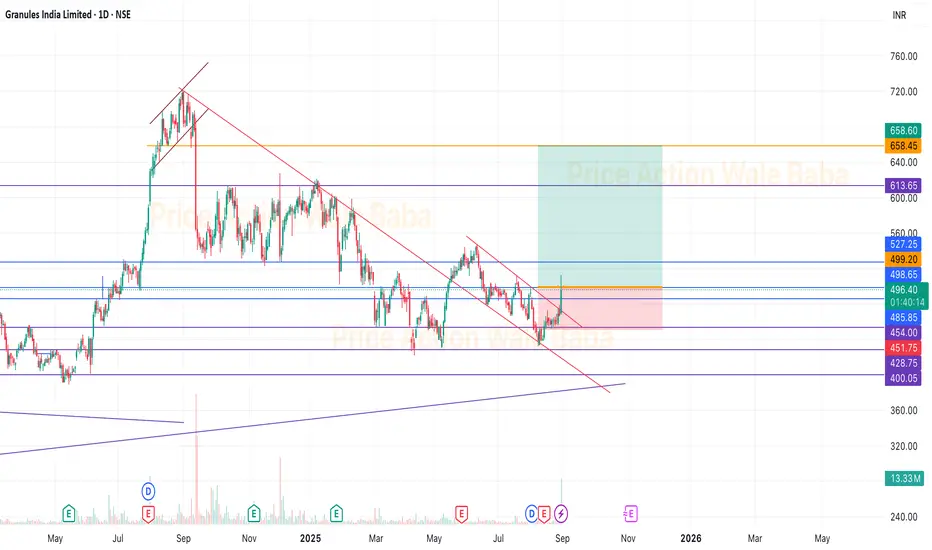
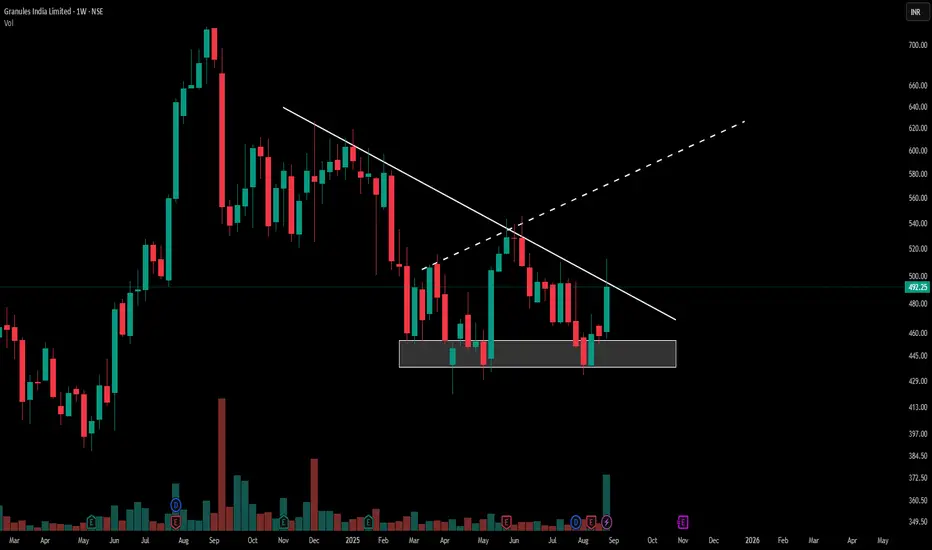
Granules India: Critical Descending TriangleGranules India Limited presents a descending triangle pattern on the weekly chart. The price has moved from the established support zone near ₹440-450 and is currently challenging the resistance trendline around ₹492.25. This movement appears with a marked increase in trading volume, highlighting the level where buyers and sellers are most active.
Pattern Character
A descending triangle pattern is identified by a series of lower highs against a stable support base. Granules India’s recent action displays persistence at support and upward momentum toward resistance. The volume expansion indicates notable participation during the current move.
Chart Observation
Price action above the triangle’s resistance can indicate a change in the prevailing sentiment if confirmed by continued volume. The current structure and market activity are being closely watched by participants for further development. No forecast or recommendation is made within this post.
Granules - BreakoutGranules has give good breakout with volume and proper consolidation.
Above 520, we can see proper rally in the stock and good to hold for the long term.
Keep buying on every dip and wait for the next 3-6 months for the good returns.