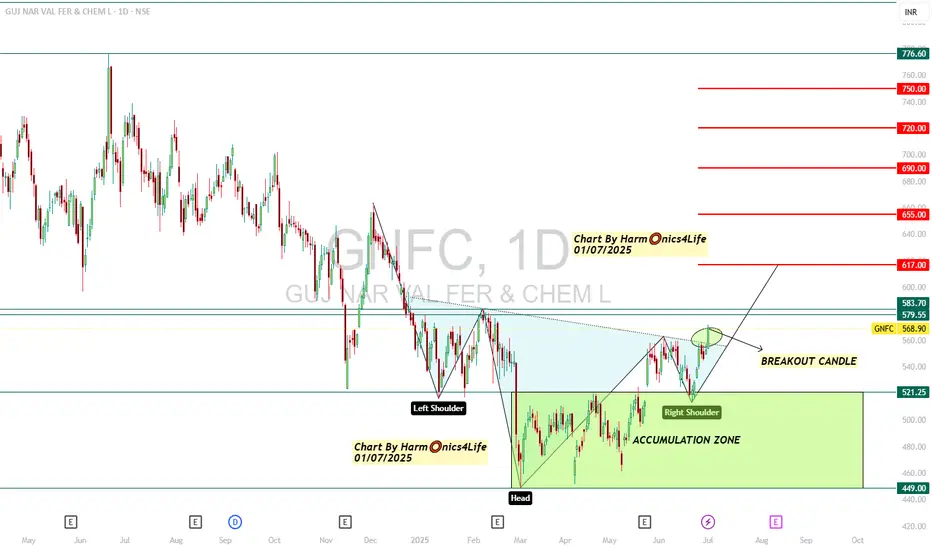
GNFC INVERTED HEAD AND SHOULDER BREAKOUT !NSE:GNFC (Gujarat Narmada Valley Fertilizers & Chemicals)
LTP 568.9
Inverted Head & Shoulder breakout on chart !
Buy here and accumulate in zone of 520---450
For Target🎯 617 / 625 / 655++
#Positional Target🎯 690 / 720 / 750++
==============================================
Positional Breakout chart
===============================================
Technical Setup:
1) More than 30% down from recent highs of 815 levels
2) Inverted Head & Shoulder breakout on chart
3) Came out of a tight consolidation range
4) Available at cheap valuations
5) Indication of Bottoming Out with High Volumes !!!
===============================================
Regards,
Harm⭕️nics4Life
01/07/2025
===============================================
Disclaimer & Risk Warning
I am not sebi registered analyst.
My studies shared here are for educational purposes .. Do Consult Your Financial advisor Before Taking any Trade.....Good Luck!
Breakout!
APOLLO HOSPITALS (NSE: APOLLOHOSP)View: Strongly Bullish.
Bias: High momentum uptrend.
Strategy:
BUY: Initiate at current levels (around ₹7500) or on dips towards ₹7250-₹7300, or on a confirmed daily close above ₹7600.
Targets (T):
T1: ₹7800-₹8000
T2: ₹8250-₹8500
Stop-Loss (SL): ₹7150 (on daily closing basis).
Reasoning:
Confirmed breakout from a significant Rectangle/W-pattern consolidation.
Exceptional volume accompanying the breakout.
Strong bullish momentum indicated by RSI.
Potential for a new leg of the uptrend after clearing ₹7600.
Note: This is an educational analysis and not financial advice. Do your own due diligence before investing.

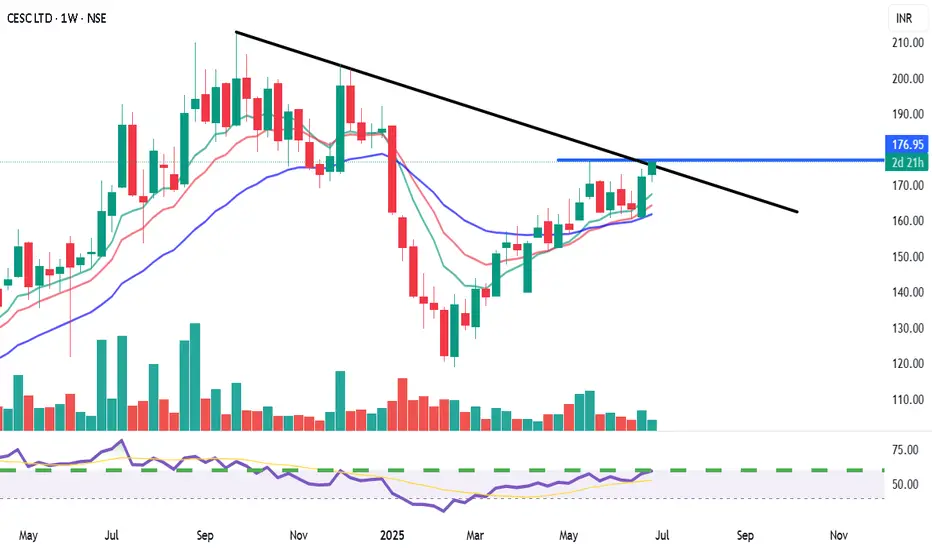
CESC Ltd. (NSE: CESC) - Weekly Chart AnalysisView: Bullish on confirmed breakout.
Bias: Positive momentum.
Strategy:
BUY: Above ₹178-180 (on weekly closing basis, confirming trendline and resistance breakout).
Targets (T):
T1: ₹195-200
T2: ₹210-220+
Stop-Loss (SL): ₹168 (on weekly closing basis).
Reasoning:
Attempting a breakout from a significant descending trendline.
Cleared horizontal resistance at ₹175.
Bullish crossover in moving averages with price above all MAs.
Strong RSI and supportive volume.
Potential for a major trend reversal.
Note: This is an educational analysis and not financial advice. Do your own due diligence before investing.
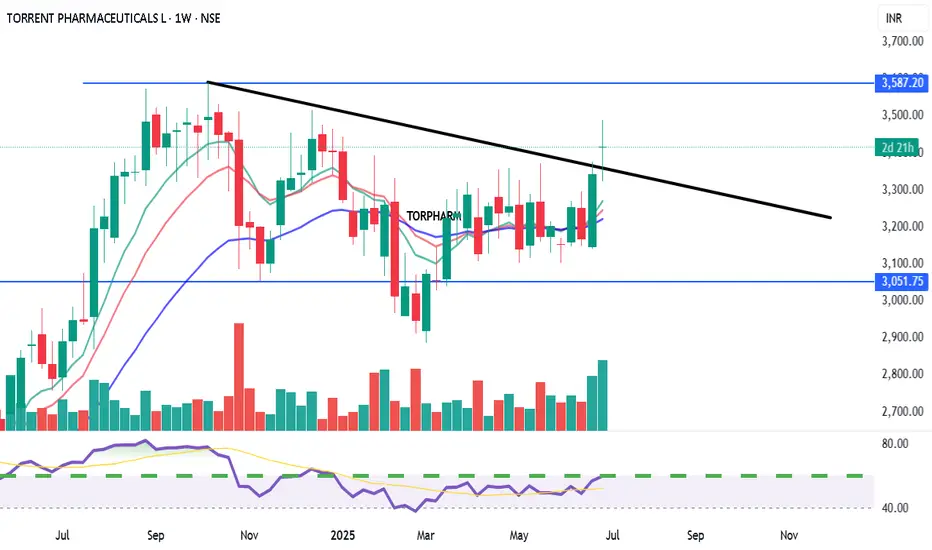
TORRENT PHARMACEUTICALS LTD. (TORPHARM) View: Bullish on confirmed breakout.
Bias: Positive momentum building.
Strategy:
BUY: Above ₹3600 (on weekly closing basis with strong volume confirmation).
Targets (T):
T1: ₹3750
T2: ₹3950+
Stop-Loss (SL): ₹3400 (on weekly closing basis).
Reasoning:
Strong support at ₹3000-₹3050.
Challenging multi-month descending trendline resistance.
Positive RSI divergence and increasing volume.
Potential for a significant trend reversal if breakout is confirmed.
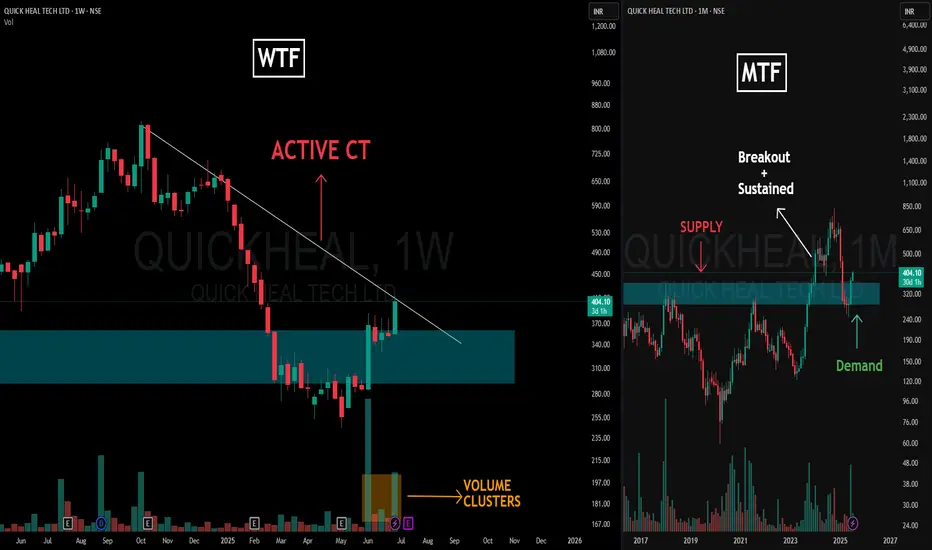
Supply Flips, Trendline Squeezes & Volume Talks – Clean MTFA📌 Charting Breakdown
This post dives into a clean Multi-Timeframe Analysis (MTFA) for QUICKHEAL using structural logic — with Weekly Time Frame (WTF) on the left and Monthly Time Frame (MTF) on the right.
🔍 Left Side – Weekly Time Frame (WTF)
-The Active CT (Counter-Trend) is marked via the dominant trendline resistance, which price is actively engaging.
-We observe a strong Volume Cluster forming near the base of the reclaimed demand zone — often a sign of accumulation or significant interest.
🧠 Right Side – Monthly Time Frame (MTF)
-Here, a textbook Supply & Demand Conversion is visualized.
-Initially, price reacted to a clear Supply Zone, creating the resistance base.
-Once that zone was broken with strength and sustained above it, the previous supply area transformed into Demand, validating the impulse move.
-Price then returned to test this now-converted zone — an SR flip seen through the lens of supply-demand logic, not just support/resistance lines.
🧾 Disclaimer:
This post is not a forecast, tip, or financial advice. It is purely an educational breakdown of price structure and market behavior based on my personal charting style. Feel free to ask your doubts or thoughts in the comments — let’s build clarity, not predictions.
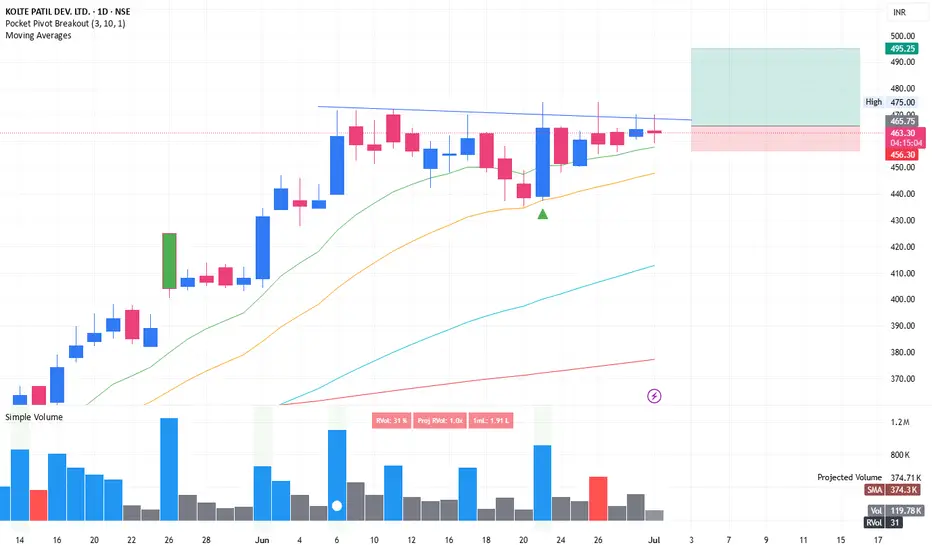
Swing trade opportunity in KOLTEPATILKOLTEPATIL: Tight consolidation with inner bar structure is formed in last 5-6 days. Breaking above the pivot line could lead to significant push when crossing with good volume.
SL is somewhere around 3% (Refer the long position drawn over the chart).
One can invest 10% portfolio size as per following calculations
Position sizing and managing risk is the key.
Portfolio is: 1,00,000
Position size: 10,000
Risk 3%: 300. Which means only 0.3% of overall portfolio value is under risk.
Stay connected for commentary for coming days
Disclaimer:
The information provided herein is for educational and informational purposes only and should not be construed as investment advice. The stock analysis and recommendations are based on publicly available information, data sources believed to be reliable, and our interpretation at the time of writing.
Investing in equities involves risks, including the risk of loss of capital. Past performance is not indicative of future results. Readers and investors are advised to conduct their own research or consult a qualified financial advisor before making any investment decisions.
The author(s), affiliates, or associated entities may hold positions in the stocks mentioned, and such positions are subject to change without notice.
We do not guarantee the accuracy, completeness, or timeliness of any information presented, and we disclaim any liability for financial losses or damages resulting from the use of this content.
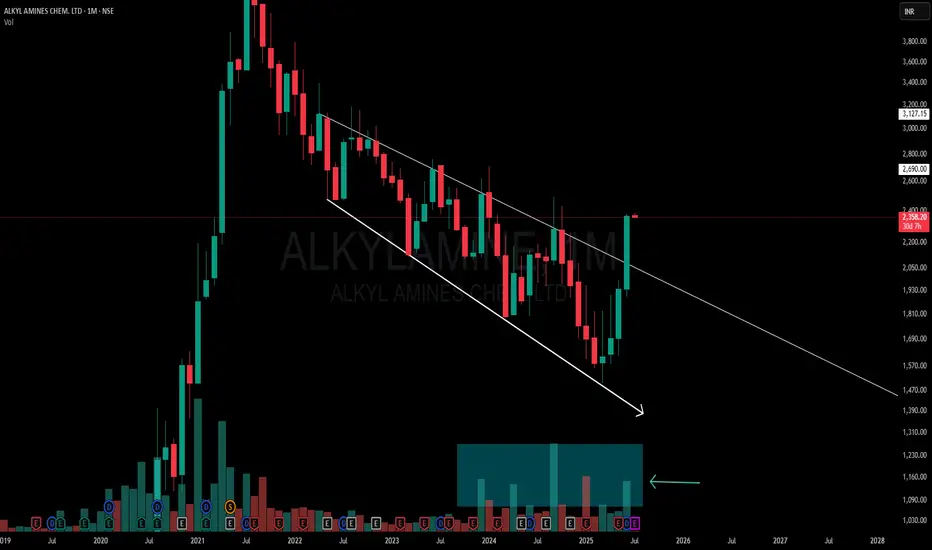
Powerful Monthly Channel | Clean Price Structure Across📉 Description:
-This is a classic example of a broadening falling channel on the Monthly Time Frame (MTF), where the counter-trendline (CT) has just been taken out by a strong bullish candle. Volume confirms the strength
📌What makes this setup particularly interesting:
-MTF structure: Despite a series of lower lows on the monthly, it has respected the broad structure of the falling channel throughout.
-WTF/DTF structure: Weekly and Daily timeframes are making higher lows (HLs),
-Price behavior: Clean reaction to the trendline and no choppiness around breakout — this reflects a well-absorbed selling zone
⚠️ This is not a forecast, not a call or tip — just me charting what I see. Drop any doubts in the comments.
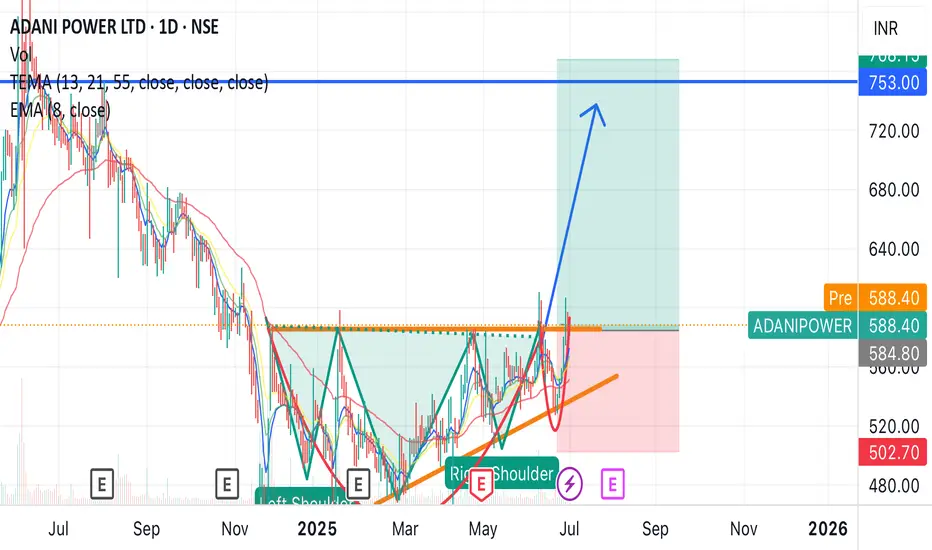
Adani power breakout anytime Adani power price hover just above resistance can give breakout anytime, earlier it was showing head and shoulder pattern and now changed into cup and handle pattern, also the support is also moving up.
Can expect a breakout anytime.
Entry around - 600
Target - 750
Duration 1-2 month
Bear Flag Breakdown Looms on XAUUSDGold (XAUUSD) is currently forming a clear bear flag pattern on the H1 chart, signaling a weak corrective move within a dominant downtrend. The 5-wave structure (1 to 5) inside the flag indicates limited bullish momentum. If the lower trendline breaks, gold could plunge toward the key support zone at 3,295 USD.
On the news front, the ceasefire agreement between Iran and Israel brokered by the U.S. has significantly reduced geopolitical risk, weakening the demand for safe-haven assets like gold. In under 48 hours, gold lost over 60 dollars, reflecting the market's rapid shift toward risk-on sentiment. Additionally, speculative money is flowing out of precious metals and into growth assets, adding further downside pressure.
Given this confluence of technical and fundamental factors, I lean strongly toward a bearish continuation, with a likely breakdown of the flag pattern. As long as price remains below the EMA 89 (around 3,342 USD), the short-term trend favors the bears.
Are you ready for the next leg down?

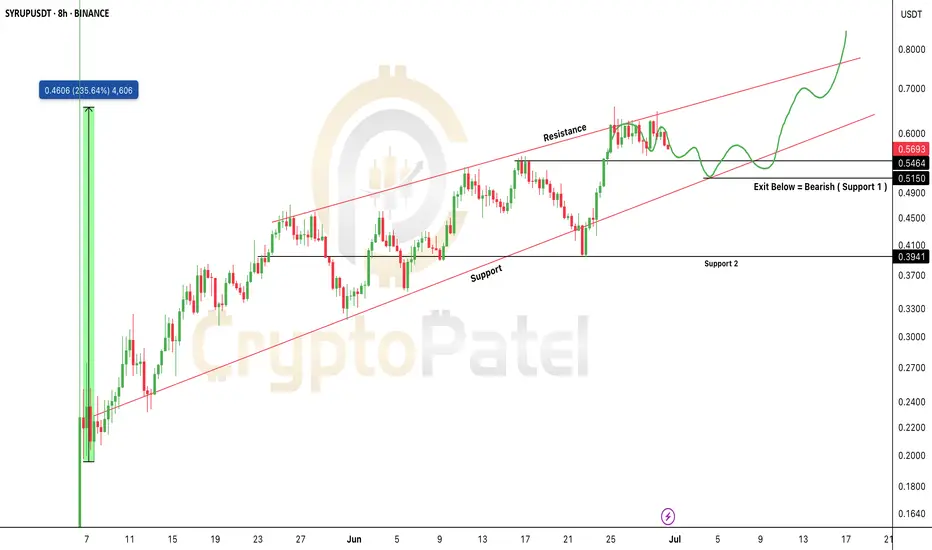
$SYRUP Price Prediction Analysis as per Ascending ChannelSYRUP/USDT – Technical Chart Update (8H Timeframe)
SYRUP is trading inside a clean ascending channel, showing a bullish structure with higher highs and higher lows.
Key Levels to Watch:
Support: $0.51
Resistance Targets: $0.70 → $0.80+
Exit Level: Bearish if price breaks below $0.51
Current Setup:
Price is respecting the lower trendline of the channel. A bounce here could lead to another leg up toward resistance.
Strategy:
Bullish bias as long as SYRUP holds above $0.51
Ideal zone to look for buy opportunities on dips
Exit or hedge if price closes below $0.51
Important Note:
If CRYPTOCAP:SYRUP holds the $0.51 support, it could soon enter the $1 club 🚀
But if it drops below $0.50, we may see a 30–50% retracement.
So always watch the chart closely before entering any trades.
Note: NFA & DYOR
Gold at Make-or-Break Zone – Will Sellers Strike Back?Gold is staging a rebound, but don't let it fool you — the real battle is just ahead.
After last week's sharp drop, the price is now approaching a key resistance near 3,355, where the 34 and 89 EMAs meet a supply zone. This is not just any level — it's the perfect spot for sellers to step in.
Meanwhile, markets are bracing for high-impact US data this week, including Core PCE and Q1 GDP. If inflation runs hot, it could crush gold’s momentum and fuel another leg down.
If rejection happens here, gold could drop back toward the 3,265 zone. Bulls need a breakout to regain control — but right now, the edge leans bearish.
Are you ready for the next move?

EUR/USD Stuck in a Box – Breakout or Breakdown Ahead?EUR/USD is currently moving sideways within a narrow range around 1.1700–1.1750, as traders await key economic data from both the US and the Eurozone. The chart reflects a consolidation phase, with repeated resistance tests but no clear breakout yet.
This week, the euro remains under pressure after the ECB delivered a more dovish tone than expected, reinforcing the view that interest rates in the euro area may stay unchanged for longer. Although inflation data has stabilized, the euro’s recovery momentum has stalled.
Looking ahead, EUR/USD must break above the 1.1740 resistance zone to resume its longer-term bullish trend. Otherwise, the bearish pullback scenario, as outlined in the chart, could come into play.
What’s your take — will we see a breakout, or is a correction coming first? 📉📈
Share your view in the comments!

Update the latest gold price todayGold kicks off the new week with a sharp drop, sliding to around $3,258/oz, down more than $14 from Friday’s close. The primary driver behind this decline is the easing geopolitical tension in the Middle East, following a ceasefire agreement between Israel and Iran, which has significantly reduced demand for safe-haven assets.
In addition, stubborn inflation and weak global growth are forcing central banks — especially the Federal Reserve — to keep interest rates elevated for longer. This policy stance continues to pressure gold prices.
From my perspective, gold had surged too quickly in recent weeks due to geopolitical risks. Now that those tensions have calmed, capital is flowing out of gold and rotating into risk-on assets like stocks, bonds, and real estate.
Looking ahead, this week brings a wave of high-impact economic data from the US, Eurozone, China, and Japan — including the June PMIs from the US and China, and preliminary CPI from the Eurozone. These releases are likely to shape gold’s short-term direction.
For now, the bearish bias remains, with $3,300 acting as a key resistance level to watch.

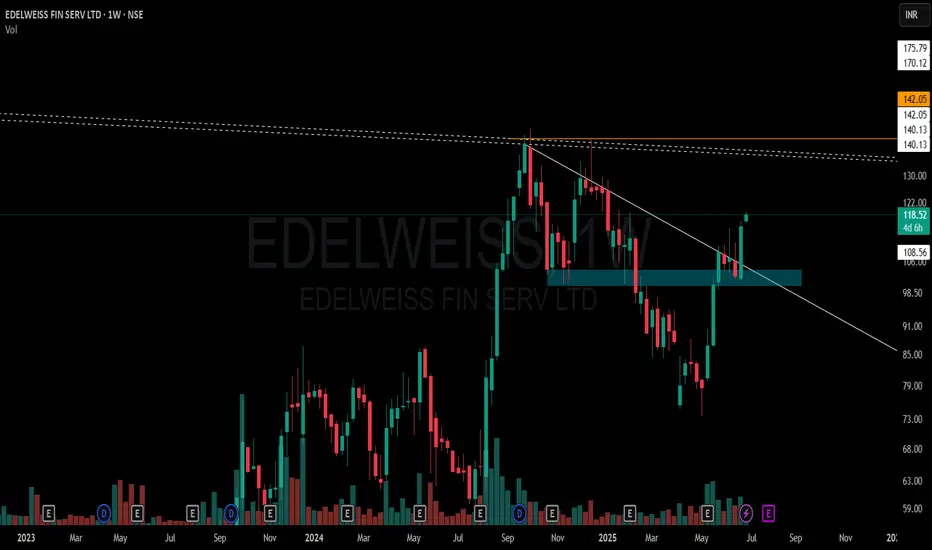
EDELWEISS FIN SERV LTD – Weekly Structure A few key observations on this weekly chart without any forecast bias:
🔹 White Solid Trendline – Marks the active CT (counter-trend) level which has now been decisively taken out.
🔹 Blue Zone – A previously tested supply and demand area has been regained and price is now sustaining above it.
🔹 White Dotted Lines – Multiple short-term weekly hindrances lie just above, acting as micro-resistances.
🔹 Orange Line – Reflects multi-timeframe level confluence and a known volume cluster region to watch ahead.
🔹 Volume has seen a healthy pickup during this breakout, suggesting participation.
📌 Not a recommendation. Just sharing chart structure and price behavior.
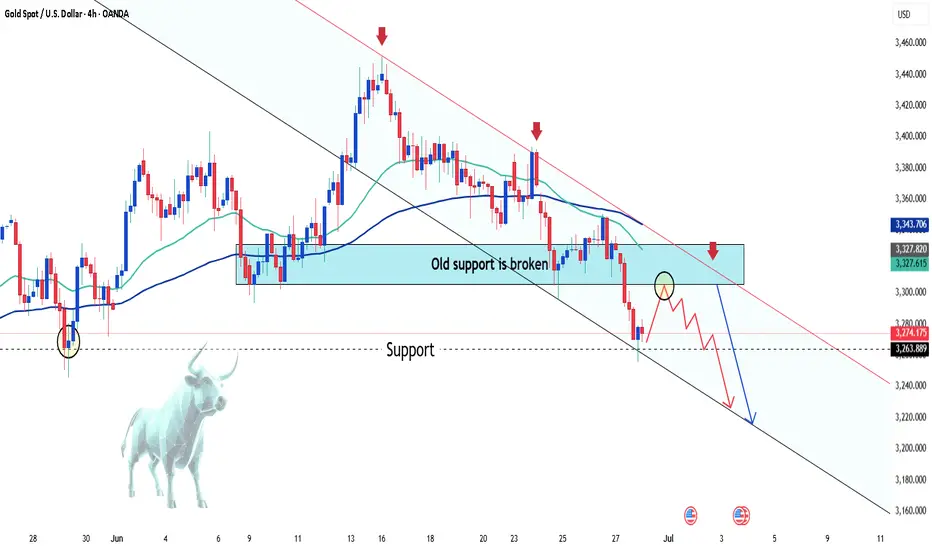
Gold in Free Fall – Is This Just the Beginning?Hey fellow traders!
Today, gold is taking a serious dive — price has crashed below the critical $3,300 support, and things aren't looking great for the bulls. The chart says it all: the old support zone has been wiped out, and the recent minor bounce? Just the calm before a deeper selloff.
💣 What’s dragging gold down?
-The reasons are crystal clear:
-US Treasury yields are spiking, pulling capital away from gold.
-The US dollar is rebounding strongly, boosted by hawkish Fed commentary.
Global markets are optimistic, with geopolitical tensions easing — which means gold is losing its safe-haven appeal.
In short: there's not much left to keep gold afloat right now.
📉 Technical outlook – Breaking down and breaking lower?
On the H4 chart, gold has officially lost the EMA 34 (~$3,322) — a key dynamic support that's held multiple times in the past. With that breach, sellers rushed in. Price is now sliding toward the bottom of the descending channel, targeting $3,240, and possibly $3,200 if bearish momentum continues.
And if gold pulls back to retest the broken zone? Don’t celebrate too soon — it could be the perfect trap for sellers to reload.
So, what’s your take?
HINDCOPPER | Supply-Demand Flip & Structure This chart shows a clean structural shift on the weekly timeframe for Hindustan Copper Ltd (NSE: HINDCOPPER):
🔷 Blue Zone: A key Supply-to-Demand Flip area. Price reacted strongly from this zone after multiple touches, showing its relevance.
📉 CT Line (Compression Trendline): Price was getting compressed under this trendline. It's now visibly breached.
➡️ Arrow Zone: Highlights a smaller supply-demand zone, formed after consolidation and breakout. Marked for structural clarity.
Volume also shows higher activity during this move, indicating strength behind the recent price action.

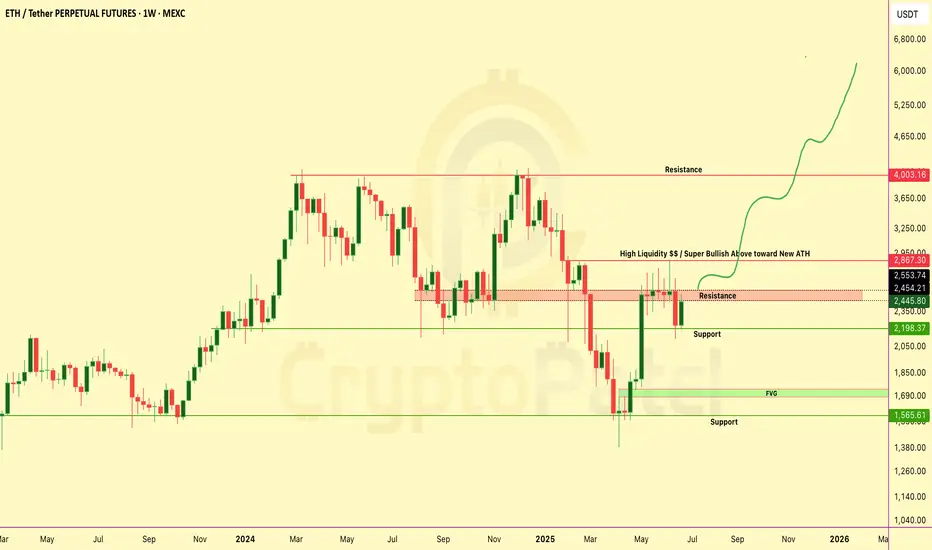
ETHEREUM Weekly Chart Breakdown – Massive Move Loading?ETHEREUM Weekly Chart Breakdown – Massive Move Loading?
ETH just pumped +9.9% this week... but it’s what comes next that really matters 👇
Key Resistance Wall → $2,867
🔹 This zone is packed with liquidity traps and past rejections.
🔹 Break this level = Unlocks ATH push toward $4K–$6K-$10k
Why This Chart Matters:
✅ Bullish structure reclaim
✅ Targeting “High Liquidity” zone above
✅ Possible parabolic rally if breakout confirms
Dips = Opportunities
If ETH dips from here... don’t panic.
→ Every dip = fresh accumulation zone
→ Below $2,000 = golden buy zone for long-term bulls
Liquidity Zone Break it = ATH rally incoming
Reject it = Buy the dip and ride the next wave
Comment & tag a friend who needs this alpha!
NFA & Dyor
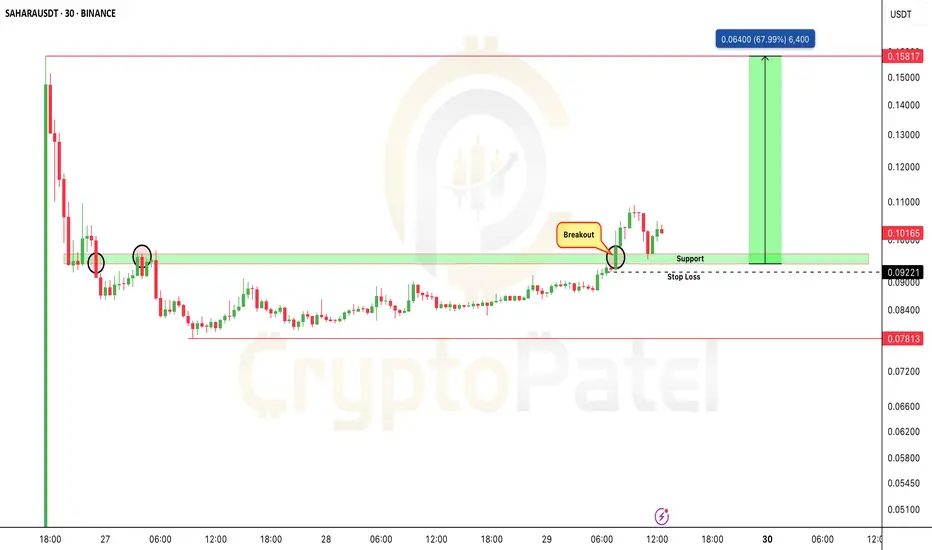
$SAHARA is at a critical level BSE:SAHARA is at a critical level
If the $0.09 support holds, a 60% upside is on the table.
But if it fails to hold $0.095… We could be looking at new lows.
This support zone decides the next big move.
Keep it on your radar
Retweet if you're watching
How I Read Price Action Like a Pro (Most Miss This Step)The REAL Way to Read Price Action — No Indicators, Just Logic
I make educational content videos for swing trading .

Laurus Labs Limited - Breakout Setup, Move is ON...#LAURUSLABS trading above Resistance of 553
Next Resistance is at 699
Support is at 420
Here are previous charts:
Chart is self explanatory. Levels of breakout, possible up-moves (where stock may find resistances) and support (close below which, setup will be invalidated) are clearly defined.
Disclaimer: This is for demonstration and educational purpose only. This is not buying or selling recommendations. I am not SEBI registered. Please consult your financial advisor before taking any trade.

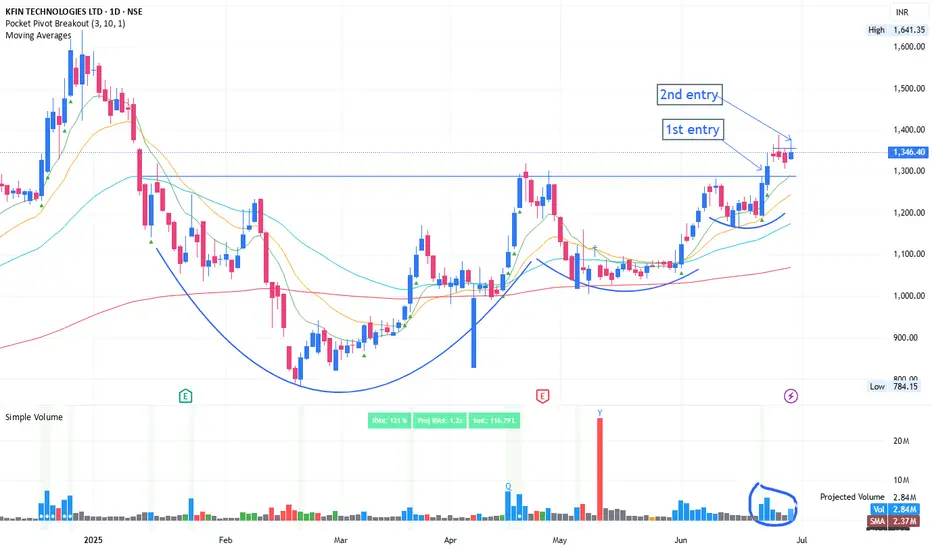
Volatility contraction, breakout and tightnessKFINTECH: Recent breakout which was marked as 1st entry. It is the safest entry, good thing is, post breakout it is forming tightness in price. This acts like spring. Once it bounce from this level, then there are high chance of blasted move.
2nd entry could be above the tightness breakout with 200-300x RVOL during early starting of trading session. This could give huge intraday returns and good topup over existing position
Stay connected for upcoming development and notes.
Disclaimer:
The information provided herein is for educational and informational purposes only and should not be construed as investment advice. The stock analysis and recommendations are based on publicly available information, data sources believed to be reliable, and our interpretation at the time of writing.
Investing in equities involves risks, including the risk of loss of capital. Past performance is not indicative of future results. Readers and investors are advised to conduct their own research or consult a qualified financial advisor before making any investment decisions.
The author(s), affiliates, or associated entities may hold positions in the stocks mentioned, and such positions are subject to change without notice.
We do not guarantee the accuracy, completeness, or timeliness of any information presented, and we disclaim any liability for financial losses or damages resulting from the use of this content.
EURUSD Bulls in Charge – Can They Push Higher?EURUSD continues to demonstrate strength, maintaining a clear uptrend on the H4 timeframe. After breaking above the former resistance zone near 1.1600, price surged and is now consolidating around 1.1706. This breakout confirms strong bullish momentum, especially following a long period of consolidation.
That said, the area around 1.1730–1.1740 is showing signs of minor rejection, with a potential double-top pattern emerging. However, this appears to be a healthy pullback within the broader bullish trend.
The most reliable support is currently found at 1.1620, which also aligns with the EMA 34 — a dynamic level that has acted as a pivot throughout this rally.
As long as price remains above 1.1620, the bullish trend remains firmly intact.
