Prestige Estate – Bullish Structure DevelopingPrestige Estate – Bullish Structure Developing After Prolonged Correction
📅 Date: April 16, 2025
📈 Chart Type: Daily | Exchange: NSE
💡 Purpose: Educational Analysis
🔍 Price Action Overview
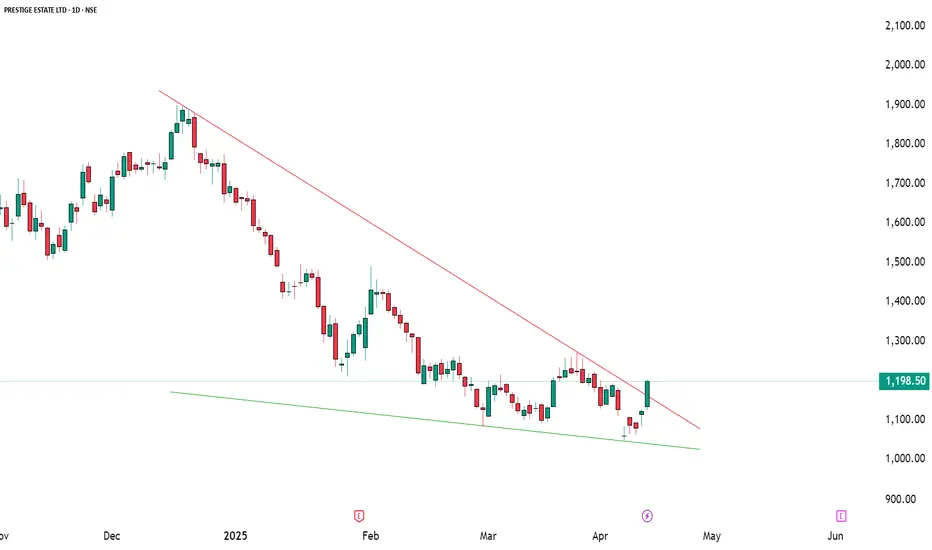
After an extended downtrend, Prestige Estate appears to be forming a potential trend reversal structure. A strong bullish candle has emerged from a key support zone, accompanied by multiple technical confirmations that indicate renewed buying interest.
📌 Key Technical Highlights
📉 Downtrend Line Break: The stock has convincingly broken above a descending trendline, indicating a potential shift in trend dynamics.
📊 Indicators Triggered:
✅ RSI Breakout: Momentum is turning positive.
✅ MACD Crossover: Bullish signal crossover observed.
✅ Bollinger Band Squeeze Off: Suggests upcoming volatility with a directional move.
📍 Volume Surge: A notable spike in volume supports the strength of the breakout candle.
🧱 Support and Resistance Zones
🟢 Support Levels:
S1: ₹1148
S2: ₹1098
S3: ₹1071
Broad Support Zone: ₹1000–1050 (marked as Weak Support)
🔴 Resistance Levels:
R1: ₹1272 (Pattern Entry Level)
R2: ₹1252
R3: ₹1302
Major Resistance: ₹1900–2000 (Long-term supply zone)
🔄 Entry Reference Levels (For Educational Illustration Only)
✳️ Early Entry Reference: Above ₹1203
A close above ₹1203 indicates sustained strength and potential continuation.
🧩 Pattern Breakout Entry Reference: Above ₹1272
A breakout above ₹1272 could confirm a larger reversal pattern with room to test higher resistance levels.
⚠️ Important Disclaimer
This analysis is strictly for educational purposes and aims to help readers understand price structure, support/resistance zones, and indicator alignment. It does not constitute investment advice or a buy/sell recommendation. Always consult a registered financial advisor before making any investment decisions. Market participation involves risk and capital protection should be a priority.
📘 Conclusion
Prestige Estate is currently at a critical juncture where momentum indicators, volume, and price action are aligning for a potential upside continuation. Close monitoring of key breakout levels and market conditions will be crucial for informed decision making.
🔔 Let us know your thoughts in the comments – Do you see strength sustaining above ₹1203?
📊 Poll: Will Prestige Estate reclaim ₹1300 in the coming weeks?
Breakout!
Nifty CMP at 24335 At this level according to waves it can be preparing for final wave (v) but only if it crosses 24550, till then we should be only observe it as wave 4 correction phase,
No short OR EVEN No long in this range ,

#MAZDOCK - VCP Break Out in Daily Time Frame📊 Script: MAZDOCK
Key highlights: 💡⚡
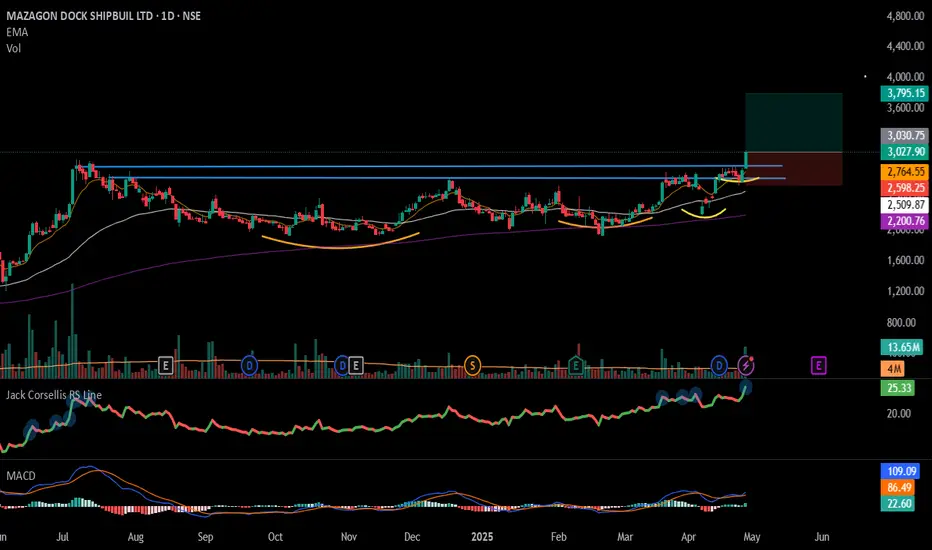
📈 VCP Break Out in Daily Time Frame.
📈 Price consolidated near Resistance.
📈 BO with Volume spike.
📈 MACD Bounce
📈 RS making 52WH
📈 One can go for Swing Trade.
BUY ONLY ABOVE 3030 DCB
⏱️ C.M.P 📑💰- 3027
🟢 Target 🎯🏆 – 25%
⚠️ Stoploss ☠️🚫 – 14%
️⚠️ Important: Market conditions are Okish, Position size 50% per Trade. Protect Capital Always
⚠️ Important: Always Exit the trade before any Event.
⚠️ Important: Always maintain your Risk:Reward Ratio as 1:2, with this RR, you only need a 33% win rate to Breakeven.
✅Like and follow to never miss a new idea!✅
Disclaimer: I am not SEBI Registered Advisor. My posts are purely for training and educational purposes.
Eat🍜 Sleep😴 TradingView📈 Repeat 🔁
Happy learning with MMT. Cheers!🥂
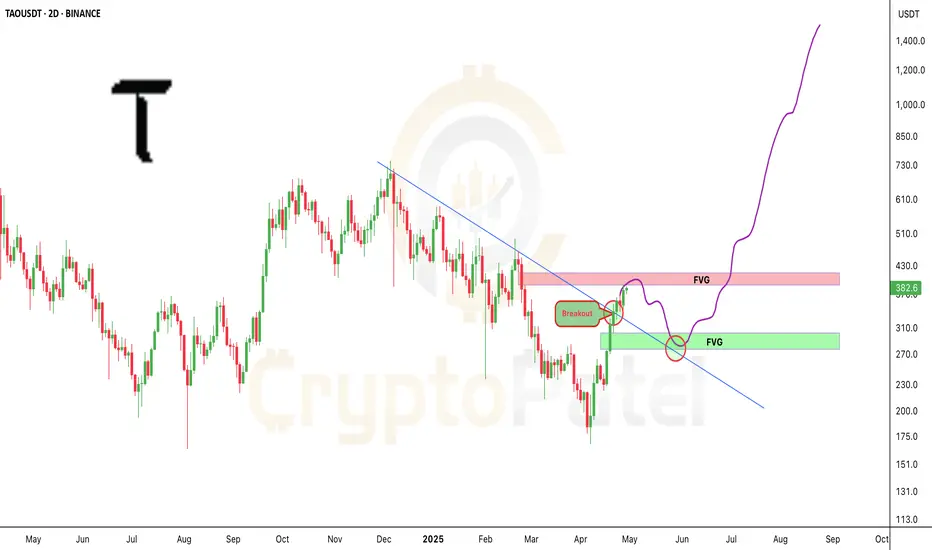
Risk-Managed $TAO Short Setup: Precision Entry Inside FVG ZoneRisk-Managed GETTEX:TAO Short Setup: Precision Entry Inside FVG Zone
▶️ Entry: $384–$395
▶️ Targets: $350 / $330 / $300
▶️ SL: $410
Reason: Bearish Divergence + FVG spotted on LTF.
Perfect for risk-managed apes. Don’t sleep on it.
$TAO/USDT – Breakout Alert & Bullish Setup$TAO/USDT – Breakout Alert & Bullish Setup
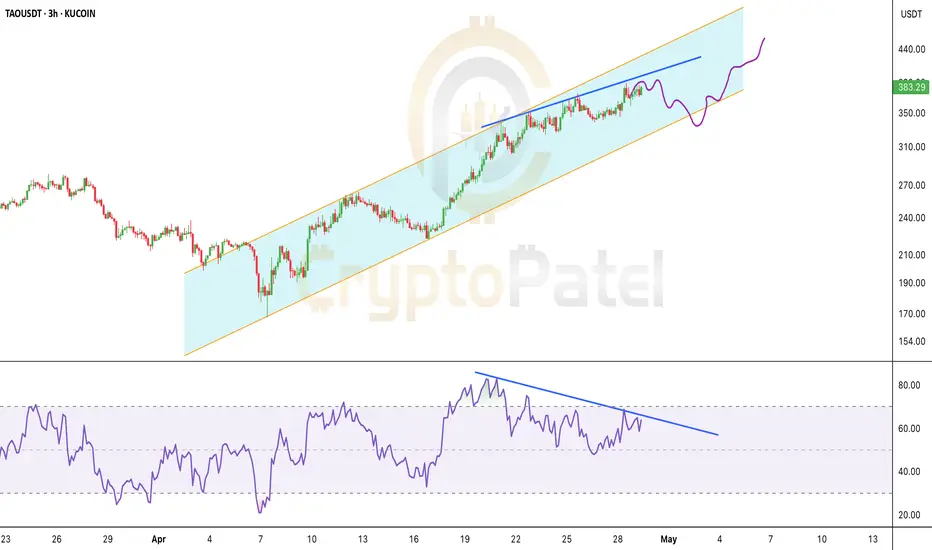
TAO has officially broken above the long-term descending trendline, signaling a strong structural shift!
Key Highlights:
▶️ Breakout confirmed near $350
▶️ Price Near to tapped the FVG resistance zone ($400–$430)
▶️ A potential pullback toward the green FVG demand zone ($270–$310) could offer a Golden entry
▶️ If TAO holds the FVG support and shows strength, we could see a massive rally towards $850+ in the coming weeks.
🟢 Bias remains bullish above $310
🛑 Risk management is key — wait for confirmation before entries
Clean Breakouts Don’t Lie — TFCILTDSupport Trendline holding beautifully from mid-2021.
CT (Counter Trendline) broken decisively this month with strong volume ✅.
Supply-Demand Zone (marked in green) retested and held.
Hidden Line (dotted pink) showing internal resistance structure — now taken out 🔥.
Current Structure:
A classic breakout with multiple confirmations — trend support, supply zone defense, CT break, hidden resistance breach — aligning well together.
🚀 As always, follow strict risk management. No trade is sure-shot — but structures like these offer probability edges.

Astral - Looks good to buy at bottomAstral Poly Technik Ltd was established in 1996, with the aim to manufacture pro-India plumbing and drainage systems in the country. It has also forayed into adhesive business over years.
Market Cap: ₹ 36,884 Cr.
Promoter holding: 54.1 %
FII holding: 20.2 %
DII holding:14.6 %
Public holding: 11.0 %
Fundamentals are good. Near breakout level and good to hold for the next 6 months.

Sunday Swings 27 April | Stocks and NiftyI make educational content videos for swing / positional trading
No calls, tips or future predications are done in this video .

Gold Under Pressure: Waiting for the Next Big MoveEarlier today, gold wrapped up the week around $3,320/ounce, falling about $53 from the previous night's peak at $3,373. This drop feels like a natural reaction as market flows begin to shift direction.
The main driver behind the pullback was a stronger U.S. dollar, fueled by easing concerns over the global economy. At the same time, rising U.S. bond yields made non-yielding assets like gold less attractive to investors.
Additionally, progress in U.S. trade talks with other nations further reduced the immediate demand for safe-haven assets like gold.
That said, I believe the market is now in a "holding pattern," awaiting key U.S. economic data — especially the upcoming inflation report from the Fed. If the numbers confirm economic stability, gold may face additional short-term selling pressure.
Bottom line: This is a time to trade cautiously. Focus on how gold reacts around major support zones and adjust strategies based on fresh economic data.
Wishing everyone safe and successful trading!

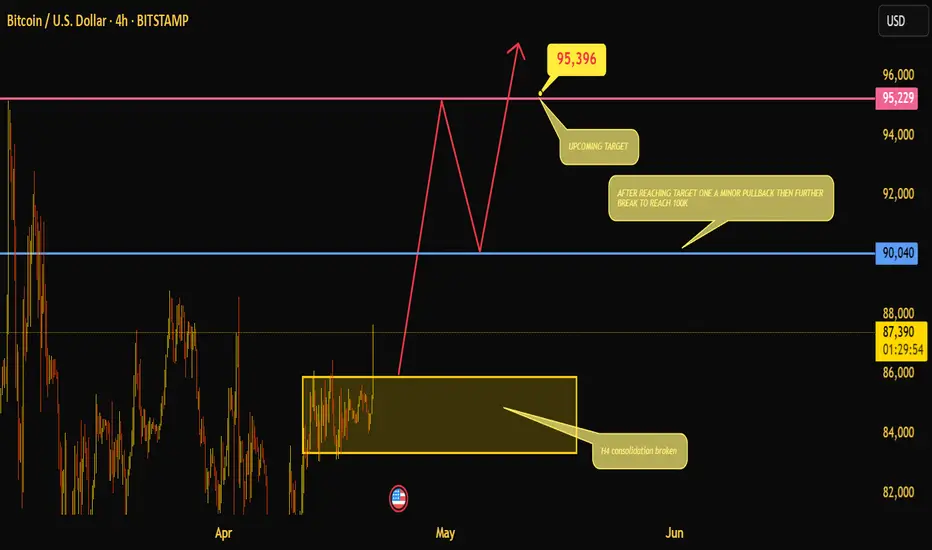
Bitcoin Breaks Out: Eyes Set on $95K, Path Open to $100KBitcoin has broken out of a well-defined H4 consolidation zone, signaling the end of a multi-week range and the beginning of a potential impulsive move. The breakout above the 87,000 region hints at bullish momentum building up, targeting the next key resistance around 95,396, which aligns closely with the marked horizontal resistance at 95,229. This level serves as the immediate upside target. If price hits this zone, a minor pullback could be expected before attempting a further leg up — possibly heading towards the psychological milestone of 100K. The level at 90,040 will act as an intermediate support, and holding above it could provide the foundation for this extended rally. Price structure suggests a rally–pullback–continuation setup, ideal for both breakout traders and swing players.
(NSE:SUNPHARMA) Inverted H&S Breakout Eyes New ATH Chart Analysis:
Sun Pharma has formed a textbook Inverted Head & Shoulders (H&S) pattern on the daily timeframe, signaling a strong bullish reversal. The pattern completed with a clean breakout above the neckline at ₹1,820 , accompanied by a surge in trading volume (highest in 2 weeks). This validates buyer conviction and sets the stage for a sustained upward move.
Key Levels:
Neckline: ₹1,820
Resistance Targets:
Target 1: ₹1,910
Target 2: ₹1,960 (All-Time High, ATH)
Support Zone:1,750
Trade Setup:
Entry Zone: ₹1,820–1,835 (post-breakout retest opportunity)
Stop Loss: ₹1,750 (below the right shoulder to avoid false breaks)
Why This Works?
✅ Pure Price Action Focus: The analysis relies solely on pattern structure, volume, and key levels—no indicators cluttering the chart.
✅ Volume Confirmation: Breakout supported by above average volume, reinforcing bullish momentum.
✅ Pattern Perfection: Classic Inverted H&S structure with well-defined neckline and symmetry.
✅ Breakout Conviction: Price closed decisively above ₹1,820, indicating strong follow-through.
For Indicator Users:
Traders who incorporate tools like RSI or Moving Averages can cross-verify this setup with their preferred strategies. For instance, the breakout aligns with bullish momentum on higher timeframes.
Risk Management:
Trail stops to lock profits as price approaches ₹1,910.
Partial profit booking at ₹1,910 (T1) recommended.
Conclusion:
Sun Pharma’s breakout above ₹1,820 opens the door for a rally toward its ATH. Pure price action traders can leverage the clean setup, while others may combine it with their preferred indicators. Focus on the neckline (₹1,820–1,835) for potential entries, and maintain strict risk management.
*This analysis is for educational purposes only and does not constitute financial advice, investment recommendation, or an offer to buy/sell securities. Trading involves substantial risk of loss, and past performance is not indicative of future results.

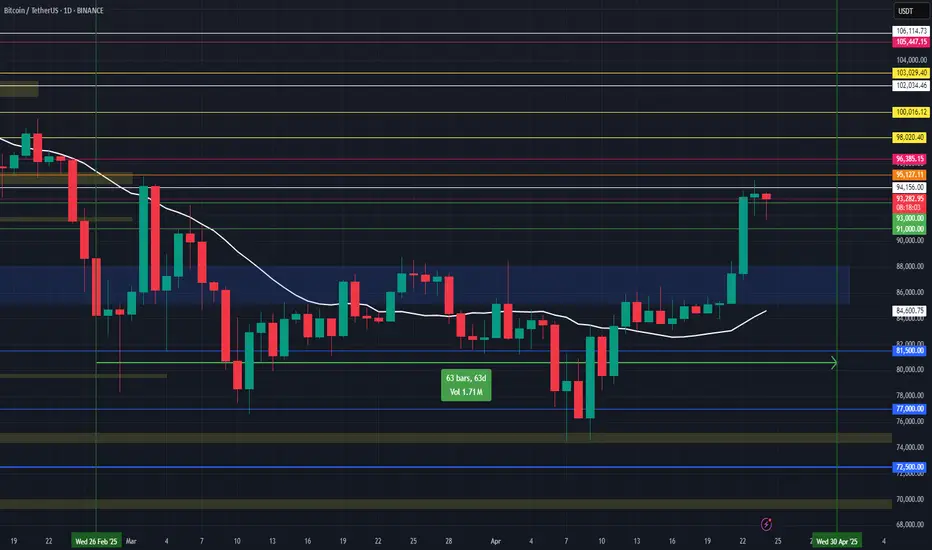
Bitcoin Breaks $88K — Eyes on Key Resistance ZoneSurging Momentum:
In the past few hours, Bitcoin has surged by 10%, breaking through the $88,000 resistance and reaching around $94,000. This marks a powerful continuation of bullish momentum.
Key Resistance Ahead:
The $92,000–$95,500 zone, which acted as strong support between November and February, is now expected to serve as major resistance. A rejection from this range could lead to a short-term retracement.
Retracement Zones:
If Bitcoin fails to break through $95,500:
First support: $91,000
Deeper pullback: $85,000–$87,500
Breakout Scenario:
If Bitcoin decisively breaks and holds above $95,500 on higher timeframes, we could see a continuation toward the next resistance between $102,000 and $108,000.
Conclusion:
Bitcoin is at a key inflection point. Whether it confirms a breakout or sees a short-term correction, this range will be crucial in shaping the next phase of the bull cycle. 📈🔥
#Bitcoin #BTC #Crypto #TechnicalAnalysis #Breakout #Resistance #Support #MarketUpdate #BullRun
Breakout Vinati Organics Ltd. (Daily Timeframe)Downtrend channel since August 2024.
Well-established descending channel broken decisively on the upside. Breakout from the downward parallel channel, signaling potential trend reversal.
Price closed above both the upper trendline and horizontal resistance (around ₹1,690–₹1,700).
Immediate Resistance 1,690–1,700 is Broken, Next Resistance can be 2,309.
Stock breakouts 1,690 resistance, now this resistance turned into support.
Breakout Entry: Around 1,700–1,729 (current levels suitable for momentum buyers)
Retest Entry: Ideal entry on pullback to 1,690 if price retests breakout zone SL: Below 1,650
Wait for a daily close above 1,730 for confirmation if entering late.

Gold Rebounds Sharply After Steep DropAfter plunging $91 to close at $3,288 in yesterday’s session, gold staged an impressive comeback this morning, surging over 700 pips to reach the $3,360 area.
This sharp price swing was largely driven by a mix of news catalysts. U.S. President Donald Trump stated he has no plans to remove Fed Chair Jerome Powell, but called for more aggressive rate cuts—boosting the U.S. dollar and putting short-term pressure on gold.
At the same time, the IMF released its latest global outlook, projecting elevated inflation through 2026. This raised expectations for prolonged monetary tightening from central banks, capping gold’s upside potential. Additionally, a wave of profit-taking after gold's recent rally added to the downward correction.

GBP/USD Rebounds as Tariff Fears EaseThe GBP/USD pair climbed to around 1.3270 on Thursday, snapping a two-day losing streak. The recent softening in concerns over potential tariff threats from U.S. President Donald Trump triggered some selling pressure on the U.S. dollar, offering a short-term lift for the pound. The move suggests a possible shift in sentiment as traders reassess the immediate risks in the global trade landscape.

Godfrey Phillips India Limited - 1D - Breakout
Pattern: A cup and handle formation is visible, suggesting a potential breakout.
• Trendlines: Two white downward trendlines indicate previous resistance levels, with the price recently breaking above them.
• Breakout: The latest price action shows a breakout above resistance around ₹7,107, which could indicate a bullish move.
• Volume: The volume bars at the bottom show increasing volume, confirming the breakout.
Indicators:
• RSI (Relative Strength Index) Indicator (Bottom Panel):
• The red line (72.00) represents the RSI value.
• The yellow-green line (60.61) likely represents a moving average or signal line.
• The RSI above 70 suggests the stock is gaining relative strength and could be in an overbought zone.
Resistance Levels:
1. ₹7,100 - ₹7,150 (Breakout Zone) → The stock has recently broken above this resistance. A successful retest and hold above this level could confirm further upside.
2. ₹7,600 - ₹7,700 → Next key resistance from previous highs (potential target if the breakout sustains).
3. ₹8,000+ (All-Time High Zone) → If momentum continues, this could be a longer-term target.
Support Levels:
1. ₹6,800 - ₹6,850 (Breakout Retest Level) → If the price pulls back, this level should act as strong support.
2. ₹6,400 - ₹6,500 (Psychological & Trendline Support) → Below this is the next strong support from past price action and trendline.
3. ₹6,000 (Major Support Zone) → A breakdown below this could invalidate the bullish trend.

EUR/USD Holding Key Support – Eyes Set on 1.1555?Today, EUR/USD remains steady around the 1.1280–1.1300 support zone after a mild pullback. This area aligns with the EMA89 and an ascending trendline, suggesting that the risk of a deeper decline is limited for now.
✅ Key news: The USD is under pressure as markets expect the Fed to keep rates unchanged or pivot toward a more dovish stance. This supports the euro and helps maintain the pair’s upward momentum.
As long as the price holds above this support, a move back toward 1.1420 – 1.1555 remains very much on the table.

Gold Slides on Trump Remarks — But Trading Opportunities RemainGold (XAU/USD) fell over 1% in early Asian trading on Wednesday, currently hovering around $3,333. The drop came after U.S. President Donald Trump clarified that he has no intention of firing Federal Reserve Chairman Jerome Powell.
Trump stated, "The media tends to exaggerate things. No, I’m not planning to fire him. I just want to see him take a more active stance in cutting interest rates." This comment signaled reduced pressure on the Fed, which weakened gold's safe-haven appeal for the short term.
Gold also showed signs of pullback due to developments around Russia-Ukraine peace talks and U.S.-China tariff negotiations. While the long-term bullish trend has paused, the current dip presents new trading setups worth considering.
💡 Suggested Trade Ideas:
SELL XAU/USD:
Zone: 3432–3435
🎯 Take Profit: 3405 / 50–300 pips
🛑 Stop Loss: 3440
BUY XAU/USD:
Zone: 3286–3283
🎯 Take Profit: 3323 / 50–400 pips
🛑 Stop Loss: 3278
Stay calm, read the price action, and make your move when the market enters key zones.
Happy trading and good luck out there! 💰

Gold May Be Entering a New Era — Are You Ready?Last week, gold extended its historic rally once again. As trade tensions between the U.S. and China escalated and the Fed signaled a possible policy shift, the yellow metal regained strong momentum, pushing to new highs around $3,380, gaining over 500 pips from the week’s opening.
What’s most notable is that despite these record levels, market sentiment remains clearly optimistic — and in my view, that optimism is well-founded.
We’re seeing capital flow into gold from all directions: speculators, institutional funds, and even central banks. In today’s uncertain climate, gold isn’t just an option — it’s the market’s natural reaction to instability.
This isn’t only about tariffs or geopolitics. What truly fuels the move is the Fed’s increasingly dovish tone. And every time monetary policy softens, gold steps back into the spotlight as a defensive anchor.
Unless we see a major surprise — such as a sudden trade resolution or a sharp policy pivot — there’s little reason to expect the uptrend to end here. In fact, any short-term correction could serve as a healthier entry point rather than a reversal signal.
So the real question right now isn’t “Has gold gone too far?”
It’s: “Are we ready for a much longer bullish cycle?”

Gold Holds Steady — Is Another Rally Brewing?Gold prices are holding firm above the key zone around $3,330/oz, showing resilience despite the market slowing down for the Easter holiday. While price action is currently sideways, the bullish momentum hasn't faded.
Ongoing geopolitical tensions, economic uncertainty, and U.S. trade policy shifts continue to fuel safe-haven demand for gold. For now, resistance stands near $3,353, with a solid support base forming around $3,300.
After a strong rally, gold may enter a brief phase of consolidation before building fresh momentum. The ideal approach? Watch for pullbacks to key areas like the EMA 34 or support zones — or wait for a clean breakout above resistance to jump in once the market regains full liquidity.
Stick with the trend, traders — and don’t forget to secure your trades with proper TP and SL. Stay sharp!

BAAZAR STYLE RETAIL LTD - Breakout Alert!📈 Chart Overview:
The stock has broken out of a long-term descending trendline with strong volume confirmation.
RSI is approaching the overbought zone, indicating strong momentum.
🔍 Key Levels:
Resistance: ₹320, ₹400
Support: ₹260, ₹200
📊 Observations:
A trendline breakout with a 20% price surge signals bullish strength.
RSI breakout suggests a potential continuation, but caution is needed for overbought conditions.
🚀 Trading View:
If the price sustains above ₹320, it could move toward ₹400.
A pullback to ₹260 could provide a good re-entry opportunity.
📌 Disclaimer: This is for educational purposes only. Do your research before making any trades.

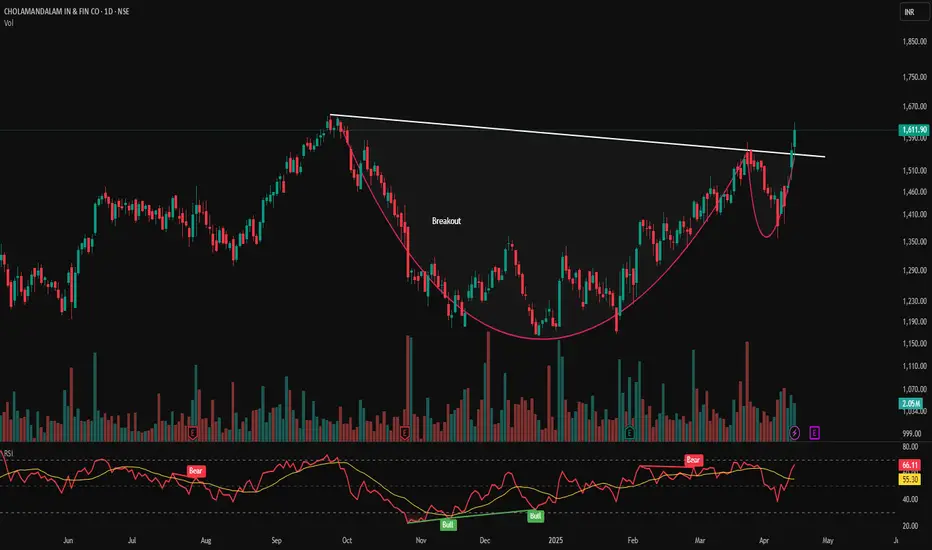
CHOLAFIN- Cup & Handle Breakout with Strong FundamentalsCHOLAFIN – Cup & Handle Breakout with Strong Fundamentals ☕📈
📅 Published on: April 17, 2025
📊 Technical Analysis:
CHOLAFIN has formed a classic Cup & Handle pattern on the daily chart, indicating a potential bullish continuation. The breakout above the neckline is accompanied by increased volume, suggesting strong buying interest.
Pattern: Cup & Handle
Neckline Breakout Level: ₹1,570
Current Price: ₹1,611.90 (+3.31%)
Volume: 2.05M—significant increase confirming breakout
Support & Resistance Levels:
Immediate Support: ₹1,570
Next Support: ₹1,500
Resistance Levels:
₹1,635
₹1,680
₹1,750
Indicators:
RSI: 66.11—approaching overbought territory, indicating strong momentum
MACD: Bullish crossover observed, supporting upward movement
🏢 Fundamental Analysis:
Cholamandalam Investment and Finance Company Ltd. is a leading NBFC in India, operating in vehicle finance, home loans, and corporate finance sectors.
Key Financial Metrics:
Market Cap: ₹1,20,302 Cr
PE Ratio: 29.60
PB Ratio: 5.62
ROE: 17.41%
ROCE: 11.23%
Dividend Yield: 0.14%
Recent Performance:
Net Profit Margin: 18.16%
Return on Assets: 2.18%
Asset Turnover Ratio: 0.14
The company has demonstrated consistent profit growth over the past five years, with a CAGR of 23.4%.
📌 Trade Strategy (For Educational Purposes):
Entry Point: ₹1,570–₹1,600 (on retest)
Stop Loss: ₹1,500
Target Levels:
₹1,635
₹1,680
₹1,750
📍 Visual Elements:
Cup & Handle pattern highlighted
Breakout point marked
Support and resistance levels indicated
Volume bars showing increased activity
RSI and MACD indicators displayed
🔔 Disclaimer: This analysis is for educational purposes only. Please conduct your own research or consult a financial advisor before making investment decisions.
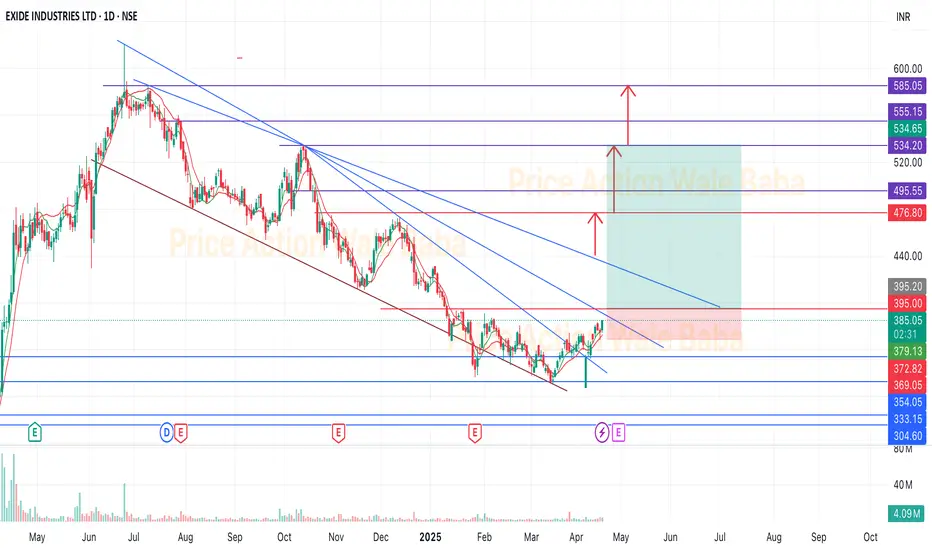
ExideExide near the breakout and looks. good for the up side.
This is bottom out stock and ready to go up.
It's time to buy and hold for the next 6-12 months to take ATH target.