XRP Technical Breakdown – 3 Key Gaps Identified!🚨 XRP Technical Breakdown – 3 Key Gaps Identified!
Hey fam! 👇
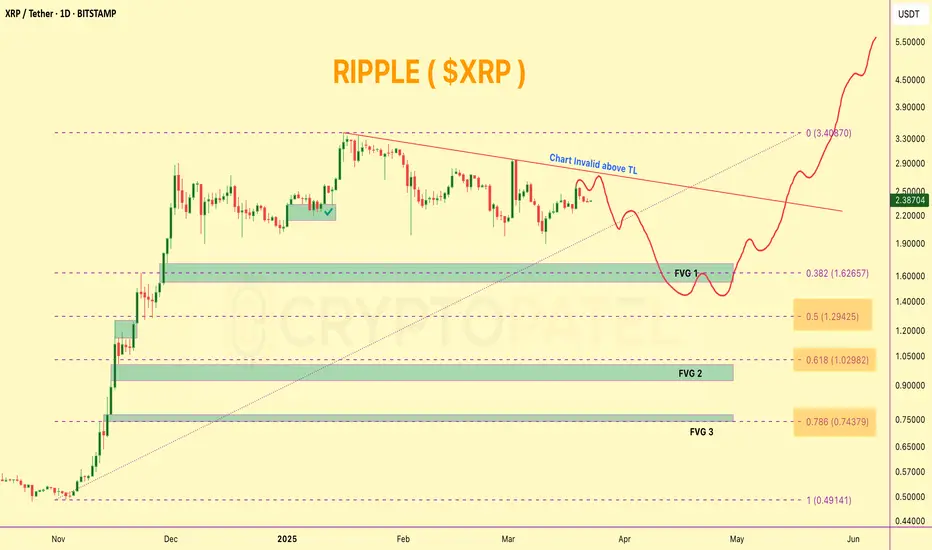
I just spotted 3 major GAPS on the CRYPTOCAP:XRP Daily Chart, and they could play a crucial role in XRP’s next big move!
Gap Zones to Watch:
1️⃣ GAP 1 – $1.712 to $1.546
2️⃣ GAP 2 – $1.00 to $0.9268
3️⃣ GAP 3 – $0.772 to $0.64
My Take (IMO):
✔️ In this current super bullish market, GAP 1 has a high probability of being filled before the next leg up toward $5+.
However, if we rely purely on Technical Analysis + Fibonacci levels, the chart indicates that GAP 2 & GAP 3 might need to be filled first before a sustainable upside.
Based on the Fib retracement, if CRYPTOCAP:XRP revisits the 0.618 - 0.786 zones, it could create a powerful reversal and bounce setup from there. That’s a key confluence level for long-term holders and swing traders.
High Liquidity Zones = Opportunity Zones!
All 3 GAPs align with areas of high liquidity – ideal for setting strategic buy orders if you're playing the safe accumulation game.
📢 What do you think?
Do you believe Ripple can drop below $1 again before a new ATH?
Let’s discuss – drop your TA in the comments 💬👇
Breakout!
Max Financial Services Ltd – Trend Reversal in Play?🚀 Technical Analysis Breakdown:
The yellow trendline shows a long-term support, which has held well despite recent corrections.
The red downtrend line indicates a recent bearish phase, which has now been broken with a strong bullish candle.
The stock has bounced from the trendline support, showing signs of strength.
Above all the strong Pinbar candle looks amazing for a candle close .
🔎 Your Take? Do you see further upside or a pullback? Comment below! 👇

L&T Finance Weekly Breakout Setup 🔹 Green Line – The weekly support held strong, giving a perfect WTF (Where's The Floor) bounce.
🔹 Supply Zone (Blue Box) – This crucial resistance has now been broken out convincingly.
🔹 Red Line – A CT (Counter-Trendline) breakout with solid volume confirmation.
🔹 Bright Blue Line (MTF Resistance @ 185.82) – The toughest resistance, but it's far from the breakout zone, making this a high-RR trade idea.
🔥 Unique setup with multiple confluences! Volume spike adds conviction. Can bulls sustain the momentum? 🤔
📈 What’s your take on this breakout? Comment below! 👇

Banknifty has given breakout, ready to give 5-6% in short term.Hello everyone, i hope you all will be doing good in your life and your trading as well. Today i have brought an analysis on Banknifty which has given breakout of falling resistance trendline and now it is ready to move 5-6% in short term, Banknifty has taken perfect support from important support zone, It's already taken two times support previously from same zone,. Now price has given successfully breakout with huge volume in recents trading sessions.
Disclaimer:- This analysis is for educational purposes only. Please trade responsibly and consult a financial advisor before making any decisions.
If you found this analysis helpful, don’t forget to like, follow, and share your thoughts in the comments below! Your support keeps me motivated to share more insights. Let’s grow and learn together—happy trading!

Manappuram Finance - Trade Setup📊 Trade Plan:
Entry: Above ₹215 if broken out with volume.
Stop Loss: ₹192.95 (Closing basis).
Target: Watch price action near ₹231 (ATH); safe traders wait for a daily close above it.
Position Sizing: Buy in small quantities and accumulate gradually.
📈 Why This Stock?
Technical Setup:
Trading above key DMAs (Daily Moving Averages).
Stock was in an uptrend (June-Aug 2022) but fell out of the channel and gapped down significantly (Oct 24, 2022).
Now recovering and trading near ATH (₹231), forming another channel.
Entry possible above ₹215 if broken with volume.
Watch for ₹231 breakout with volume (4-year trading range).
Finance index has broken out of base and is trading above key DMAs.
⚠️ Market Conditions & Risks:
We are trading against the trend (LL-LH structure).
The overall market is below the 50 & 200 DMA, indicating potential further dips.
Trades are more prone to failure unless the market structure changes.
Safe traders should wait for confirmation before entering.
📊 Fundamentals (Key Data)
Market Cap: ₹18,107 Cr
Current Price: ₹214
52-Week High/Low: ₹230 / ₹138
Stock P/E: 9.21
ROCE: 13.8%
ROE: 20.6%
🚨 Disclaimer:
⚠️ This is not financial advice. We are trading against the broader trend, meaning the risk of failure is high. Do your own analysis before taking any trade. Always manage risk and trade cautiously! 🚀

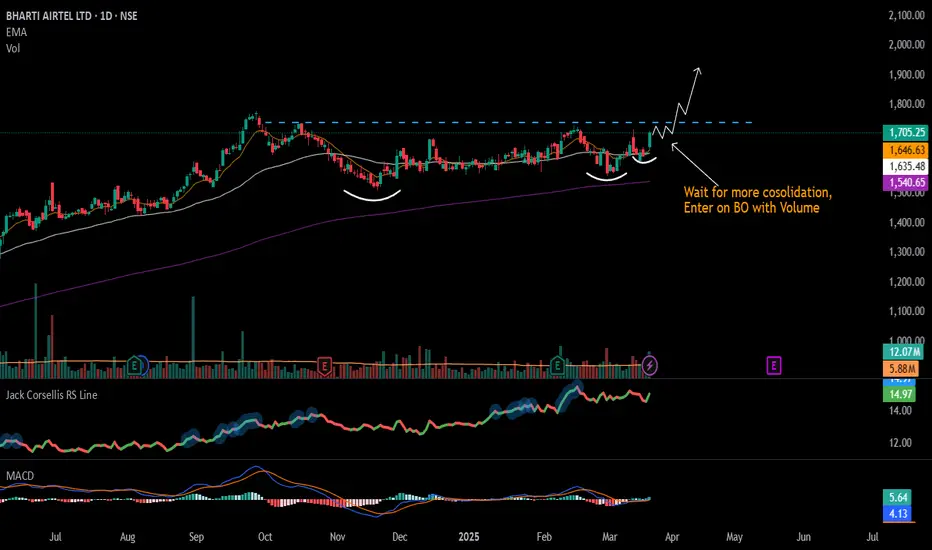
#BHARTIARTL - Potential Breakout Stock / Keep in WL 📊 Script: BHARTIARTL
Key highlights: 💡⚡
📈 VCP formation in Daily chart.
📈 Wait for consolidation
📈 Enter Breakout on Volume spike
📈 MACD Bounce
📈 RS is bullish
📈 One can go for Swing Trade.
BUY ONLY ABOVE 1772 DCB
⏱️ C.M.P 📑💰- 1705
🟢 Target 🎯🏆 – NA%
⚠️ Stoploss ☠️🚫 – NA%
️⚠️ Important: Market conditions are getting better, Position size 50% per Trade. Protect Capital Always
⚠️ Important: Always Exit the trade before any Event.
⚠️ Important: Always maintain your Risk:Reward Ratio as 1:2, with this RR, you only need a 33% win rate to Breakeven.
✅Like and follow to never miss a new idea!✅
Disclaimer: I am not SEBI Registered Advisor. My posts are purely for training and educational purposes.
Eat🍜 Sleep😴 TradingView📈 Repeat 🔁
Happy learning with MMT. Cheers!🥂
Breakout Alert: Tata Steel and Mazagon Dock Power Up for a Surge◉ Tata Steel NSE:TATASTEEL
● The stock price has recently broken out of a falling broadening wedge pattern, signaling a potential upward movement.
● With the government's plans to impose taxes on steel imports, the stock could experience a rally in the near future.
◉ Mazagon Dock NSE:MAZDOCK
● The price has formed a bullish Pole & Flag pattern on the chart.
● Following a fresh breakout, the stock is expected to continue its upward trajectory.

Narayana Hrudayalaya Ltd - Trade Setup📊 Trade Plan:
Ideal Entry: ₹1,455 (Breakout level)
Current Entry: Small position above ₹1,701, wait for a possible retest to ₹1,455
Stop Loss: ₹1,290 (Closing basis)
Risk Percentage (From ₹1,701 to ₹1,290): 24.15%
Target: To be assessed post-retest confirmation
📈 Why This Stock?
✅ Strong Volume Spike: Recent breakout was supported by 4x-5x volume surge
✅ Broke Out of Consolidation: Now sustaining above previous range
✅ Resilient to Market Correction: Held strong despite broader weakness
✅ Trading Above Key DMAs: Indicates bullish structure
✅ Trading Inside a Strong Uptrend Channel: Stock has been respecting the trendline consistently
✅ RSI in Healthy Zone: Indicating potential room for further upside
✅ Clear Higher Highs & Higher Lows: Confirms the bullish momentum
📊 Key Fundamentals:
Market Cap: ₹33,616 Cr
Current Price: ₹1,645
52-Week High/Low: ₹1,692 / ₹1,080
Stock P/E: 42.9 (Relatively Low vs Sector Peers)
Book Value: ₹157
Dividend Yield: 0.24%
ROCE: 26.5% (Strong Capital Efficiency)
ROE: 31.4% (Healthy Profitability)
⚠️ Risks Involved:
❌ Deep Stop Loss (24.15%) – Requires high conviction, not suitable for short-term traders
❌ Potential Retest of ₹1,455 – Need to watch for confirmation before aggressive entry
❌ Sector Sensitivity: Hospitals & healthcare stocks can be affected by regulatory changes
🚨 Disclaimer:
⚠️ This is not financial advice. The trade involves high risk (24.15% SL) and we are trading against the broader trend. Ensure you do your own analysis and manage risk appropriately before taking any position. Trade cautiously! 🚀

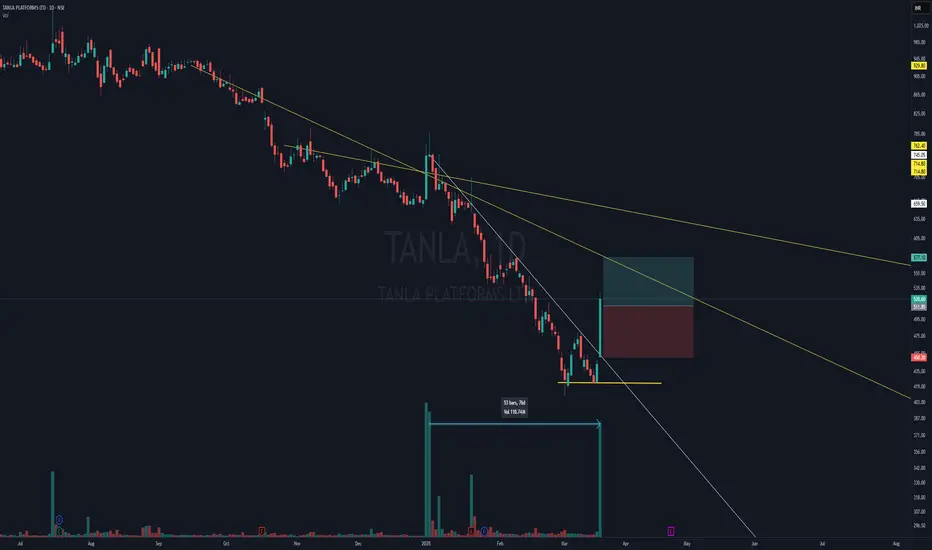
Tanla Platforms Swing -Double Bottom + CT Breakout with Volumes 📈 Technical Breakdown:
Double Bottom Formation at the base, signaling a potential reversal (though weak).
CT Breakout on the Daily Timeframe (DTF) (White Line).
Higher Timeframe (WTF) Resistance Zones marked by Yellow Lines, acting as hidden reactive resistances.
Massive Volume Spike Today – the highest in recent times, confirming strong breakout momentum.
🎯 Trade Idea:
A clean breakout from the CT with blasting volumes suggests a 1:1 trade opportunity at max for now.
Price might face resistance at higher levels, aligning with the yellow CT lines.
Need to watch if price sustains above the breakout zone for further continuation.
💬 Huge volumes—smart money stepping in or a trap? What’s your view? Let me know in the comments! 👇
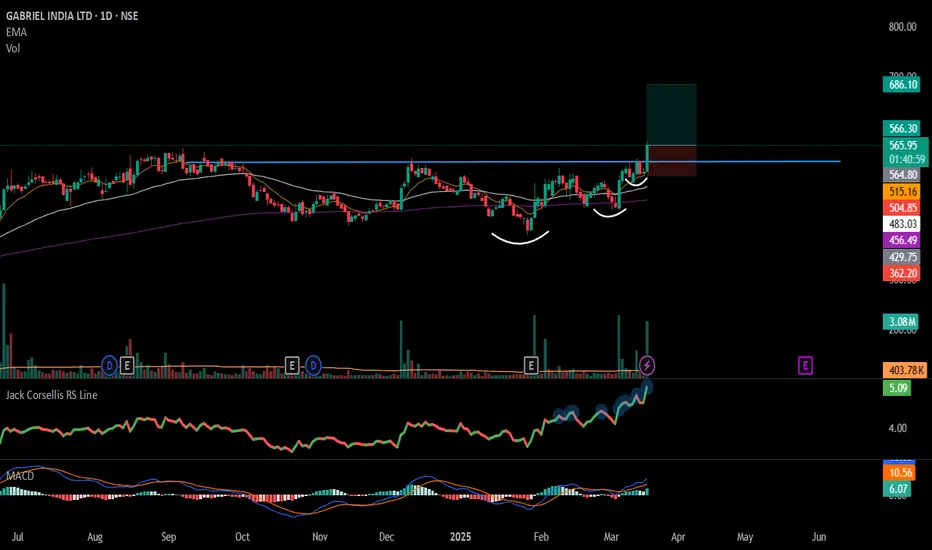
#GABRIEL - VCP Break Out in Daily chart with Volume Spike📊 Script: GABRIEL
Key highlights: 💡⚡
📈 VCP formation in Daily chart.
📈 Price gave a good up move and consolidated.
📈 Volume spike on Breakout
📈 MACD Bounce
📈 RS is making 52WH
📈 One can go for Swing Trade.
BUY ONLY ABOVE 565DCB
⏱️ C.M.P 📑💰- 561
🟢 Target 🎯🏆 – 21%
⚠️ Stoploss ☠️🚫 – 11%
️⚠️ Important: Market conditions are getting better, Position size 25% per Trade. Protect Capital Always
⚠️ Important: Always Exit the trade before any Event.
⚠️ Important: Always maintain your Risk:Reward Ratio as 1:2, with this RR, you only need a 33% win rate to Breakeven.
✅Like and follow to never miss a new idea!✅
Disclaimer: I am not SEBI Registered Advisor. My posts are purely for training and educational purposes.
Eat🍜 Sleep😴 TradingView📈 Repeat 🔁
Happy learning with MMT. Cheers!🥂
$XRP Technical Analysis – Bullish Breakout Ahead?CRYPTOCAP:XRP Technical Analysis – Bullish Breakout Ahead? 🚀
📊 Pattern: Bull Flag forming on HTF
🟢 Key Support: $2 (Must hold for continuation)
🔴 Major Resistance: $3 (Breakout level)
#XRP has already surged 7x from our entry zone, signaling strong momentum. If price holds above $2, we could see a major pump, targeting $7-$10 in this bull run. However, breaking $3 resistance is crucial for further upside.
⚠ Risk Advisory: Given the massive rally, upside potential exists but risk is high. If entering now, consider small position sizing and always manage risk wisely.
DYOR – This is not financial advice. Always trade responsibly!

SEI/USDT 20x Potential from Accumulation ZoneNYSE:SEI Accumulation Zone – High Potential Trade
🔹 -76% from recent high, making it a prime accumulation zone.
🔹 My Accumulation Zone: $0.20 – $0.15
🔹 Upside Potential: Chart indicates an easy move to $0.50—if it breaks, expect a major rally!
🔹 Long-Term Targets: $1/$3/$5/$10
🔹 Catalyst Alert: Even #TRUMP is accumulating #SEI adding strong bullish momentum!
Strategy: Accumulate on dips, take profits strategically, and hold a portion for long-term gains.
#Altcoins #NFA

Will BNB hit $5000 in future?Back in 2020, I said GETTEX:BNB will hit $500 when it was just $16… and y’all laughed. 🤡
But guess what? It didn’t just hit $500… it went all the way to $800—a 50x from my entry! 😎💰
And yeah, right after I entered, GETTEX:BNB dumped almost 62%! 💀😂 But diamond hands win in the end! 💎🙌
Now, it won’t even drop below $500! 😏
Just wait… GETTEX:BNB → $5000 is only a matter of time! ⏳🚀
Not financial advice, so don’t blame me later. DYOR! 😆

Hindustan Zinc Update – A Breakout on the Horizon?Hindustan Zinc is trading at 432 after pulling back from its all-time high of 807.
It’s approaching a critical zone— a potential trendline breakout could be in the cards! But first, we need a daily closing above 438 to confirm strength.
Key Levels to Watch:
Major Support – It has taken strong support, which can be validated on the monthly timeframe.
The Real Bullish Move? – A decisive closing above 481 could trigger a strong rally!
Plan Your Entry Wisely!
If you want to know my entry, stop-loss, and target, follow me for live updates! Let’s trade smart!

Polkadot (DOT) at Critical Support – What’s Next?Polkadot (DOT) at Critical Support – What’s Next?
📉 DOT is trading near strong support at $3.80–$3.60. If this level holds, we could see an upward move.
⚠️ Risk of liquidity grab: Price may dip below support to liquidate high-leverage positions before bouncing.
💡 Buy Strategy: Consider small entries now and place buy orders between $2.50–$2.00 for long-term gains.
📈 Altseason Target: If DOT follows the market uptrend, it could reach $40–$50 in the next cycle.
🔎 Key Levels:
✅ Above $3.60 – Bullish move likely
❌ Below $3.60 – Possible stop hunts before reversal
Are you buying DOT at these levels? Let’s discuss! 👇
#Polkadot #DOT #Crypto

#TRON to $1? Highly Possible! But Gold Entry is Key #TRON to $1? Highly Possible! But Gold Entry is Key 🚀
📉 Best Accumulation Zone for CRYPTOCAP:TRX : $0.140 - $0.10
🏆 Patience & Strategy Win the Game!
NFA. DYOR!
CRYPTOCAP:TRX #Altcoins

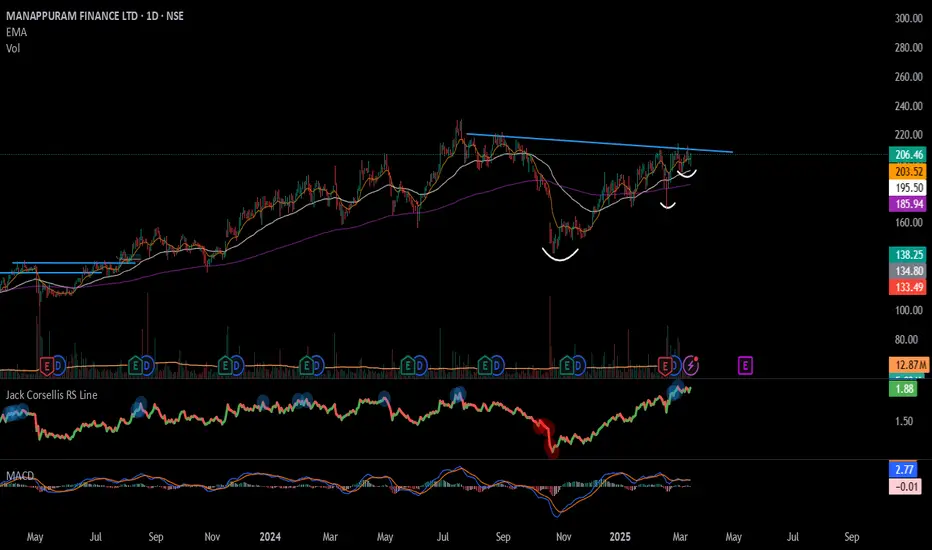
#MANAPPURAM - Potential BO / Keep in Radar/ March25📊 Script: MANAPPURAM
Key highlights: 💡⚡
📈 VCP formation in Daily chart.
📈 Price gave a good up move and went into consolidation.
📈 Wait for Volume spike on Breakout.
📈 Wait for BO with Volume
📈 One can go for Swing Trade.
BUY ONLY ABOVE 215 DCB
⏱️ C.M.P 📑💰- 206
🟢 Target 🎯🏆 – NA%
⚠️ Stoploss ☠️🚫 – NA%
️⚠️ Important: Market conditions are not great, Paper Trade Only. Protect Capital Always
⚠️ Important: Always Exit the trade before any Event.
⚠️ Important: Always maintain your Risk & Reward Ratio.
✅Like and follow to never miss a new idea!✅
Disclaimer: I am not SEBI Registered Advisor. My posts are purely for training and educational purposes.
Eat🍜 Sleep😴 TradingView📈 Repeat 🔁
Happy learning with MMT. Cheers!🥂
Simple weekly time frame swing trade idea I make educational content videos for swing / positional trading

KAMATHOTEL |Upcoming Trade set up|Hey Family, there is a one more stock Which is showing a great opportunity.
Key Points:-
* Formation of Range Bound Pattern in Daily TF.
* From Apr 2024 to Mar 2025 Tested & Moving Near Resistance Many times.
* It's Near resistance Zone and trying to Break Resistance Zone with good volume good closing required.
* Volume Accumulation (Volume is Rising).
* Got many DM about not uploading the idea those who want to trade and risk the capital they can take this risky trade. We have held off on publishing ideas on TradingView due to the bearish market trends observed over the past months.
What is your view please comment it down and also boost the idea this help to motivate us. We are Certified. All views shared on this channel are my personal opinion and is shared for educational purpose and should not be considered advise of any nature.

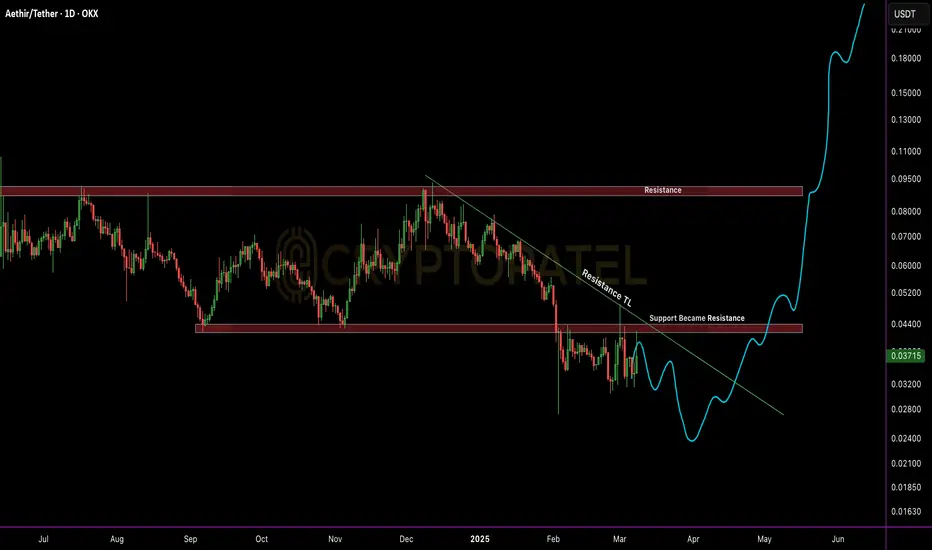
$ATH Technical Outlook: Accumulation Opportunity? TSX:ATH Technical Outlook: Accumulation Opportunity? 🚀
#ATH is trading at $0.037, below key resistance at $0.045 – bearish unless it breaks above. A breakout could push it to $0.09 and beyond.
🔹 Accumulation Zone: $0.037 – $0.020
🔹 Targets: $0.1 / $0.3 / $0.5 / $1
Solid project, good dip-buying opportunity. Watch key levels & manage risk!
Not Financial Advice – DYOR! 🚀
#aethir #Alts
Will $SUI hit $10 in Current Bull Market?Will CRYPTOCAP:SUI hit $10 in Current Bull Market?
Key support zone: $2.50-$2 – Holding this level is crucial for a potential breakout toward $10.
Price action suggests a strong bounce from this demand zone, making it a strategic re-accumulation area for high-R:R setups.
#SUI #Altcoins

Simple price action based swing trading idea for 10 March 2025I make educational content videos for swing / positional trading

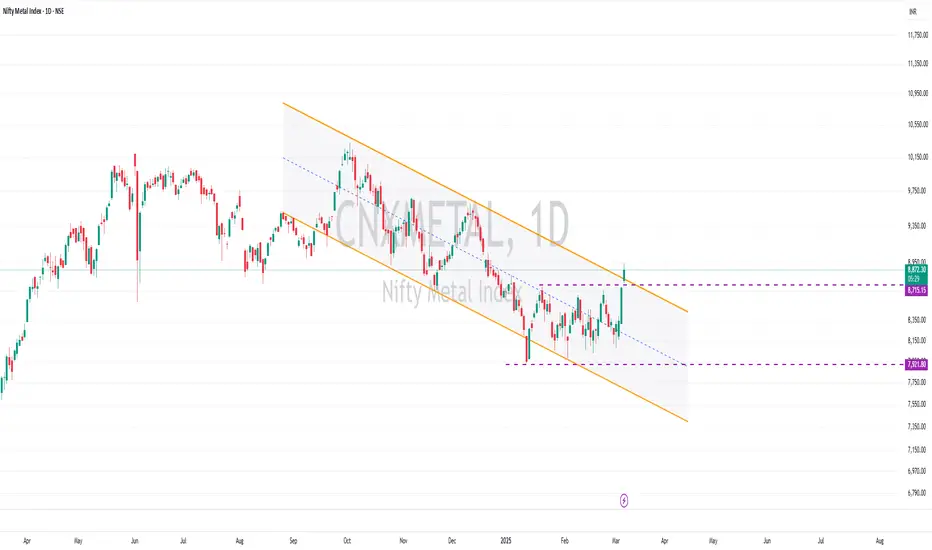
Nifty Metal Index - Trendline Breakout! 📊 Nifty Metal Index - Trendline Breakout! 🔥
✅ Ascending Channel Breakout – After months of base formation & consolidation (since March 2025), the index has broken out with strong momentum! 📈
✅ Wide-Range Candles – A sign of strength & institutional activity 🏦
✅ Sector Focus – If China will be doing well then in the upcoming quarters, metals could see strong upside opportunities 💡
📌 Key Levels to Watch:
🔹 8,715 – Previous resistance now potential support 📍
🔹 7,921 – Important demand zone if a retest happens
💡 Metals could be a key sector to track! Chart shared to spot potential trade setups. 🚀