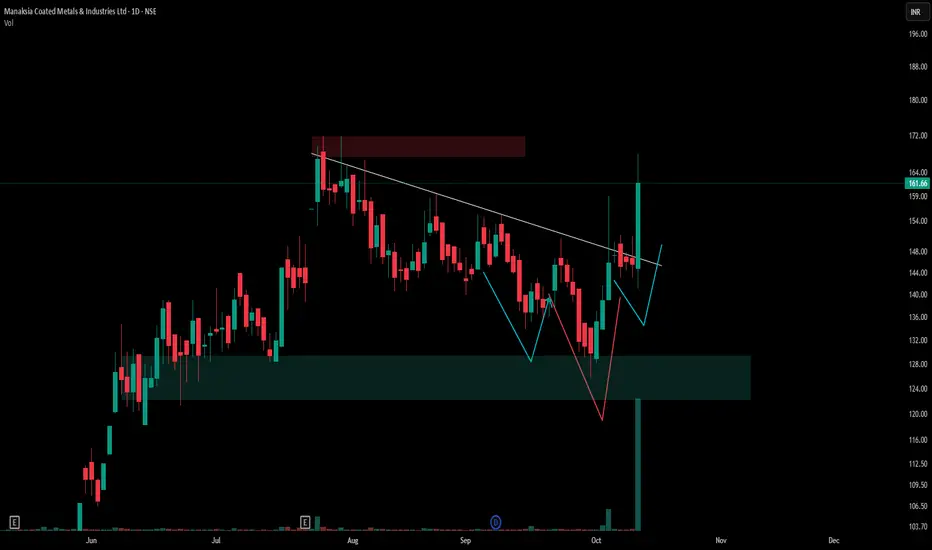
Observing Key Structural Patterns in Manaksia Coated MetalsThe daily chart of Manaksia Coated Metals & Industries Ltd (NSE) displays a confluence of notable technical formations. There is a clearly defined demand zone (highlighted in green) that has provided support for multiple sessions, as well as a supply area (marked at the upper region), signifying previous resistance.
A visually tight Volatility Contraction Pattern (VCP) is present, where price swings narrow progressively, indicating potential accumulation and increasing trader interest. The chart also reveals an inverted head and shoulders pattern, depicted using blue and red lines, which is often recognized as a classic reversal formation in technical analysis.
No attempt is made to forecast price movement; the Chart purely reflects observed market structure and patterns.
Disclaimer
This post is for educational and observational purposes only. It does not constitute financial advice or a trading recommendation. Always conduct your own research and consult a certified financial advisor before making investment decisions.
Breakout!
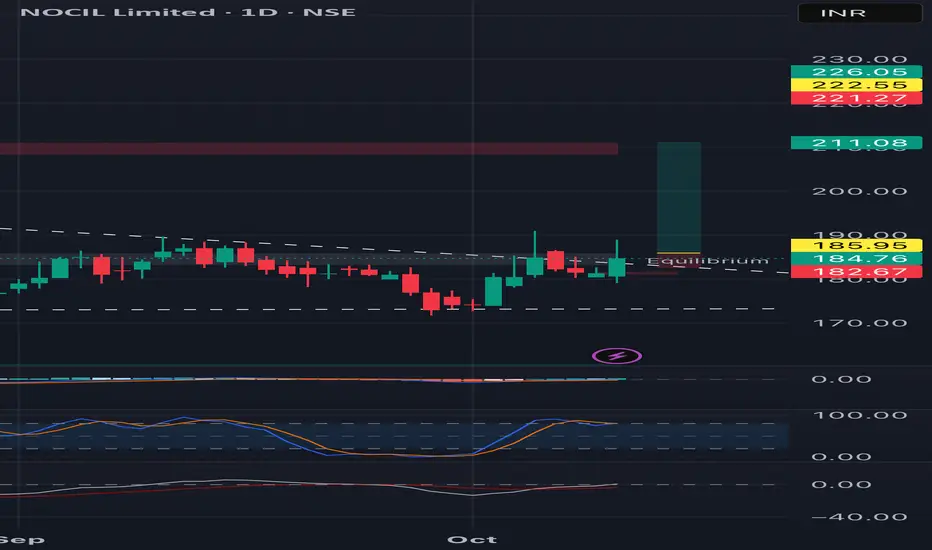
Breakout in NOCILPossibility of a strong breakout in NOCIL.
One can enter above 186 for a possible target of 210.
Note - I am not SEBI registered. This is only for educational purpose..
BUY TODAY SELL TOMORROW for 5%DON’T HAVE TIME TO MANAGE YOUR TRADES?
- Take BTST trades at 3:25 pm every day
- Try to exit by taking 4-7% profit of each trade
- SL can also be maintained as closing below the low of the breakout candle
Now, why do I prefer BTST over swing trades? The primary reason is that I have observed that 90% of the stocks give most of the movement in just 1-2 days and the rest of the time they either consolidate or fall
Round Bottom Breakout in SANSTAR
BUY TODAY SELL TOMORROW for 5%

BUY TODAY SELL TOMORROW for 5%DON’T HAVE TIME TO MANAGE YOUR TRADES?
- Take BTST trades at 3:25 pm every day
- Try to exit by taking 4-7% profit of each trade
- SL can also be maintained as closing below the low of the breakout candle
Now, why do I prefer BTST over swing trades? The primary reason is that I have observed that 90% of the stocks give most of the movement in just 1-2 days and the rest of the time they either consolidate or fall
Cup & Handle Breakout in SRM
BUY TODAY SELL TOMORROW for 5%

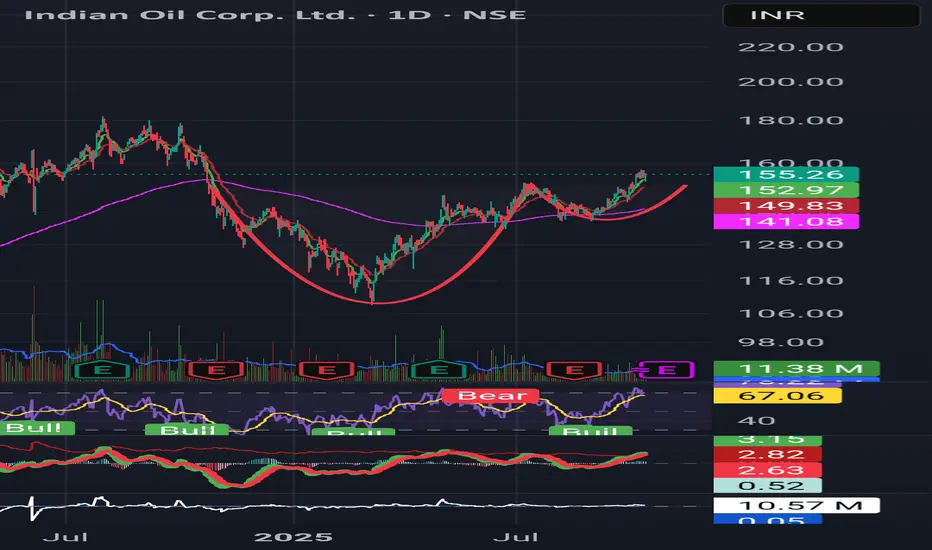
IOC forming a strong cup-and-handle breakout. IOC looks strong technically — cup-and-handle breakout on daily chart, trend intact across timeframes.
CMP 155-156;
stop 148.8;
target 180.
Trend supported by momentum & EMAs.
📈 RSI > 65
✅ MACD bullish
📊 Holding above ₹148.8 keeps the trend
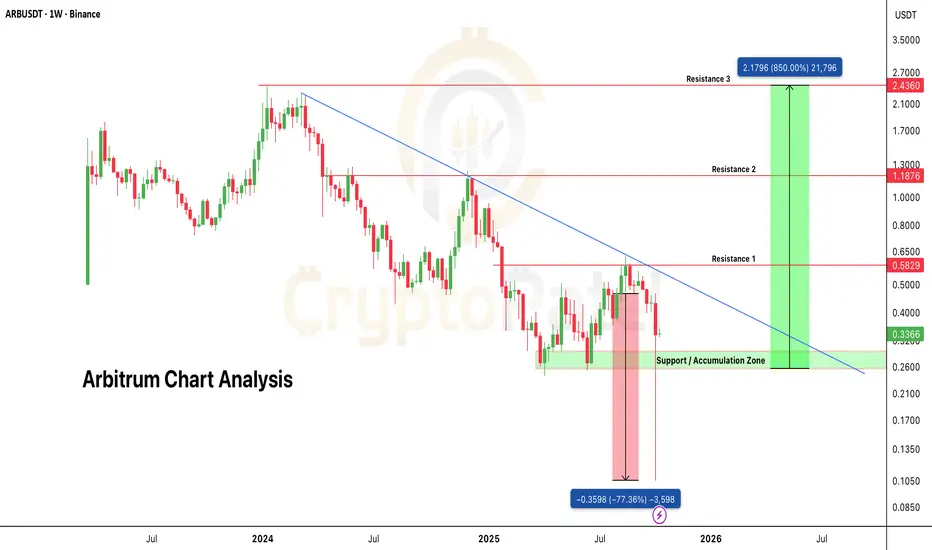
Whales loading $ARB – next 10x play in the makingWhales loading AMEX:ARB – next 10x play in the making
ARB/USDT faced a heavy sell-off during the recent crash, dropping over 77% within hours. But here’s the twist, it bounced back 238% from that low, showing strong market confidence.
What’s even more impressive: price never closed below the key support at $0.25, confirming this zone as a strong accumulation area for the long term.
Technical Overview:
Structure: Higher highs and higher lows forming after reclaiming demand zone
Support Held: $0.25 zone defended multiple times
Momentum: Bullish recovery with strong volume inflow
Bias: Long-term accumulation
Spot Accumulation Zone: $0.30 – $0.25
Targets: $0.58 / $1.18 / $2.43
Long-Term Potential: If the upcoming Altcoin Season kicks in, AMEX:ARB has the strength to deliver up to 10x returns from the current range.
NFA & DYOR
Beginner to Pro: Master Any Trade with This Step‑By‑Step PlanI make educational content videos for swing / positional trading .
Charts used in the video are 3 months old for explanation using Bar replay feature of Trading view.

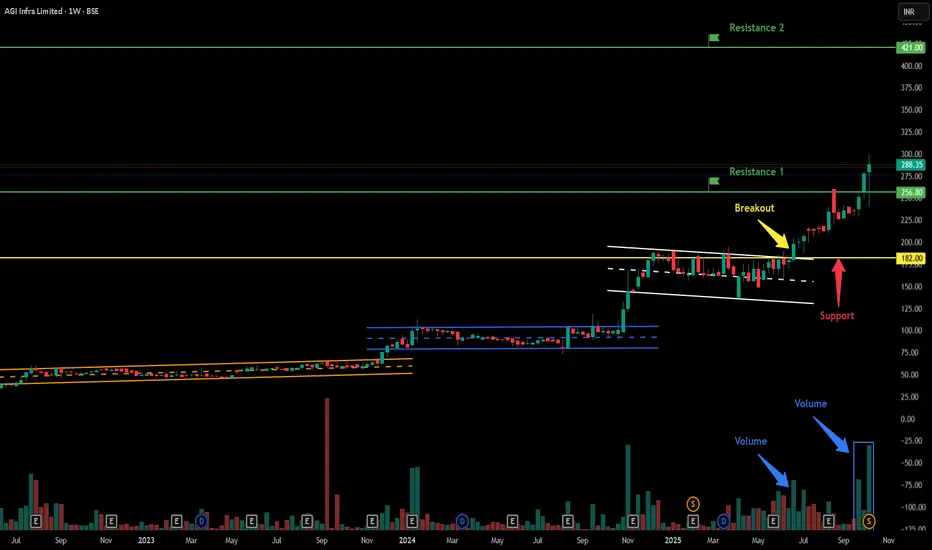
AGI Infra Ltd - Breakout Setup, Move is ON...#AGIIL trading above Resistance of 256.80
Next Resistance is at 421
Support is at 182
Here is previous chart:
Chart is self explanatory. Levels of breakout, possible up-moves (where stock may find resistances) and support (close below which, setup will be invalidated) are clearly defined.
Disclaimer: This is for demonstration and educational purpose only. This is not buying or selling recommendations. I am not SEBI registered. Please consult your financial advisor before taking any trade.
Bajaj Finance Limited- Breakout Setup, Move is ON...#BAJFINANCE trading above Resistance of 1004.50
Next Resistance is at 1182
Support is at 851
Here is previous chart:
Chart is self explanatory. Levels of breakout, possible up-moves (where stock may find resistances) and support (close below which, setup will be invalidated) are clearly defined.
Disclaimer: This is for demonstration and educational purpose only. This is not buying or selling recommendations. I am not SEBI registered. Please consult your financial advisor before taking any trade.

Indraprastha Medical Corporation Ltd- Breakout Setup, Move is ON#INDRAMEDCO trading above Resistance of 547
Next Resistance is at 789
Support is at 390
Here are previous charts:
Chart is self explanatory. Levels of breakout, possible up-moves (where stock may find resistances) and support (close below which, setup will be invalidated) are clearly defined.
Disclaimer: This is for demonstration and educational purpose only. This is not buying or selling recommendations. I am not SEBI registered. Please consult your financial advisor before taking any trade.

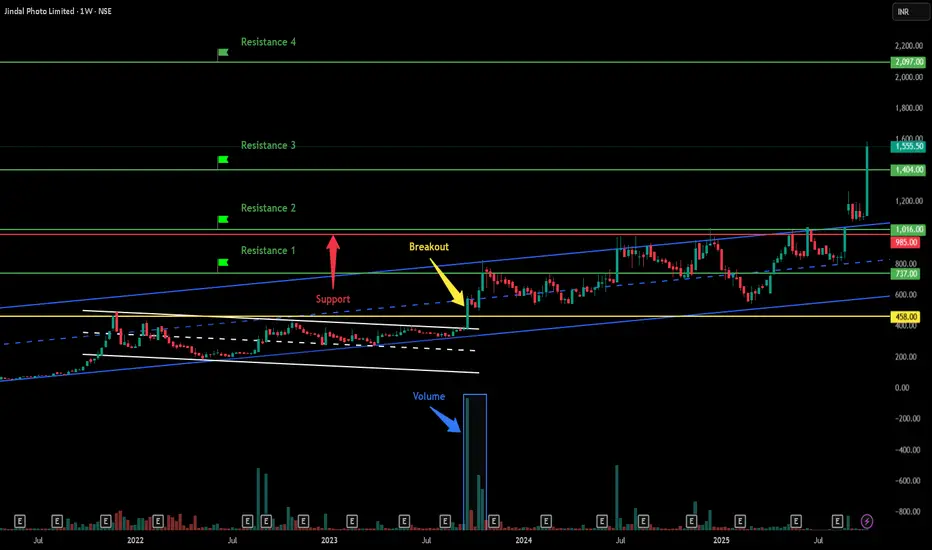
Jindal Photo Limited - Breakout Setup, Move is ON...#JINDALPHOT trading above Resistance of 1404
Next Resistance is at 2097
Support is at 985
Here are previous charts:
Chart is self explanatory. Levels of breakout, possible up-moves (where stock may find resistances) and support (close below which, setup will be invalidated) are clearly defined.
Disclaimer: This is for demonstration and educational purpose only. This is not buying or selling recommendations. I am not SEBI registered. Please consult your financial advisor before taking any trade.
BUY TODAY SELL TOMORROW for 5%DON’T HAVE TIME TO MANAGE YOUR TRADES?
- Take BTST trades at 3:25 pm every day
- Try to exit by taking 4-7% profit of each trade
- SL can also be maintained as closing below the low of the breakout candle
Now, why do I prefer BTST over swing trades? The primary reason is that I have observed that 90% of the stocks give most of the movement in just 1-2 days and the rest of the time they either consolidate or fall
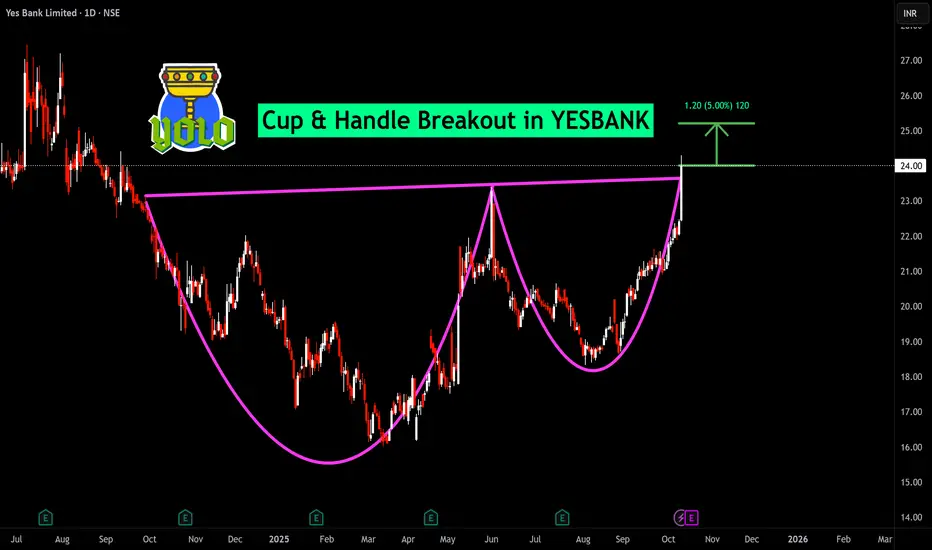
Cup & Handle Breakout in YESBANK
BUY TODAY SELL TOMORROW for 5%
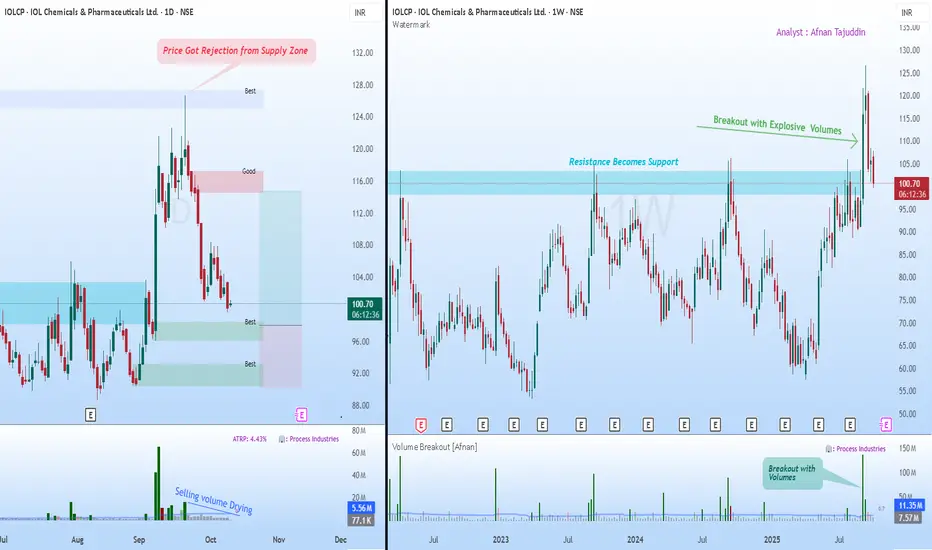
Supply & Demand Setup in IOLCP Could Signal Next Big Move📊 Supply & Demand View 📊
If you’ve been watching IOL Chemicals lately, you’ve probably noticed how cleanly it’s been respecting those key supply and demand structures. These zones aren’t random—they’re the visible fingerprints of institutions building or offloading positions in stages. When price revisits such levels, we often see sharp, almost surgical reactions.
Now, what’s catching my eye on the daily chart is the recent rejection from a supply zone. The pushback was clear, triggering a short-term decline. But here’s where it gets interesting: the selling volume has been steadily tapering off. That usually suggests the aggressive sellers are stepping aside, hinting that downside momentum could be losing steam.
Meanwhile, we’ve got multiple untested demand zones forming below—areas where buyers have shown conviction before. If price drifts into one of these regions again, I wouldn’t be surprised to see a fresh wave of institutional buying step in.
🚀 Breakout Retest View 🚀
Zooming out to the weekly chart tells a complementary story. After grinding under a major resistance for months, the stock finally broke through with explosive volume —the kind that only big money typically leaves behind. That breakout wasn’t just a blip; it reset the broader structure.
Now, the same resistance level has flipped into support—a textbook case of the law of polarity . As long as price continues to respect that zone, the larger trend remains firmly constructive.
What I find compelling is the combination of elements here: strong breakout volume, a healthy pullback, and structure alignment across timeframes. All signs point to this being a typical retest phase rather than a reversal.
✨ Final Takeaway ✨
Both charts are speaking the same language. The daily timeframe is hinting at exhaustion from sellers, while the weekly view reinforces the idea of a bullish continuation once demand reasserts itself. Should price stabilize around those lower demand zones, we could be looking at the next leg of the trend unfolding from there.
💡 Risk Management Reminder 💡
It’s easy to get carried away when the setup looks clean, but the market doesn’t owe certainty to anyone. Stick to your stop-loss, size your positions with care, and remember that discipline—more than any indicator—is what protects your capital.
“Charts reveal opportunities, but discipline secures profits.”
🔄 Stay patient, stay consistent — the market rewards preparation, not prediction. 🔄
This breakdown is shared purely for educational purposes and shouldn’t be taken as a trading or investment recommendation. I’m not a SEBI-registered analyst.
Waree Renewable Technologies Ltd: Chart ObservationThe daily chart for Waree Renewable Technologies Ltd (NSE) highlights a period of price consolidation over 59 trading sessions (86 days), during which approximately 55.75 million shares were traded. The stock has displayed movement within a defined range, bounded by a long-term trendline resistance and an ascending support line, forming a narrowing price channel.
Trendlines: A descending resistance line has guided price limitations, while an ascending support line maintained the base
Volatility: Periods of expansion and contraction in daily price bars reflect shifting volatility and trading sentiment
Volume Analysis: The consolidation phase saw steady volume with periodic surges
This setup provides a useful illustration of how price compressions and trends appear on technical charts, helping learners recognize phases of accumulation, resistance, and support.
Disclaimer: This post is intended for educational purposes only and does not constitute investment advice. Markets are subject to risk and unpredictable movements; investors should consult financial advisors and perform their own research before making any investing decisions.

BUY TODAY SELL TOMORROW for 5%DON’T HAVE TIME TO MANAGE YOUR TRADES?
- Take BTST trades at 3:25 pm every day
- Try to exit by taking 4-7% profit of each trade
- SL can also be maintained as closing below the low of the breakout candle
Now, why do I prefer BTST over swing trades? The primary reason is that I have observed that 90% of the stocks give most of the movement in just 1-2 days and the rest of the time they either consolidate or fall
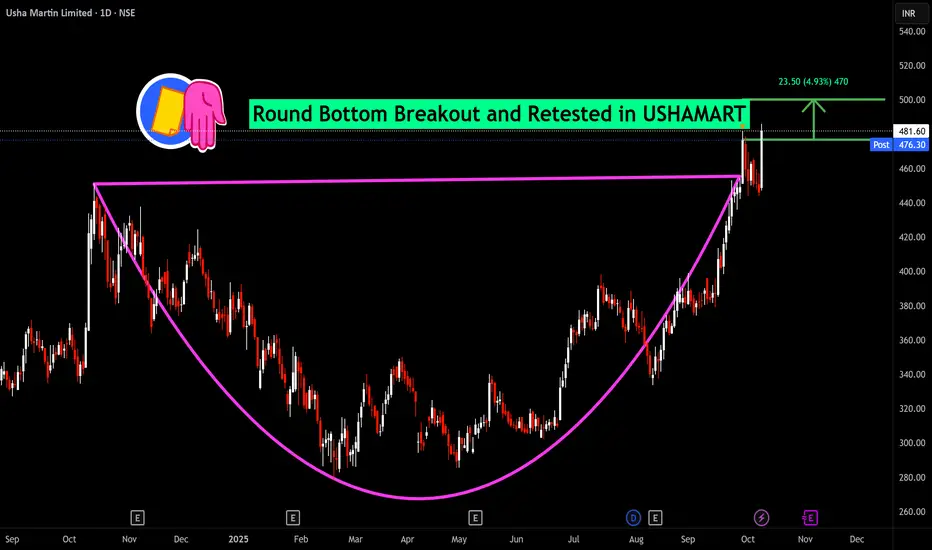
Round Bottom Breakout and Retested in USHAMART
BUY TODAY SELL TOMORROW for 5%
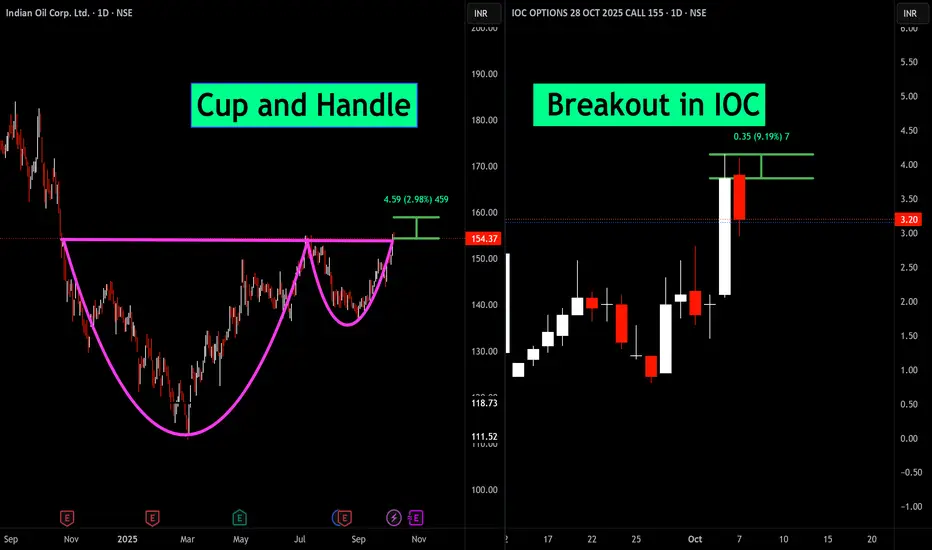
Cup and Handle breakout in IOCdian Oil Corporation (IOC) is exhibiting a classic cup and handle pattern on the daily chart, signaling bullish momentum. Recently, a breakout was observed, supported by strong volume, with a potential upside of nearly 3%. Options activity also confirms bullish sentiment. This setup offers a compelling risk-reward opportunity for traders.
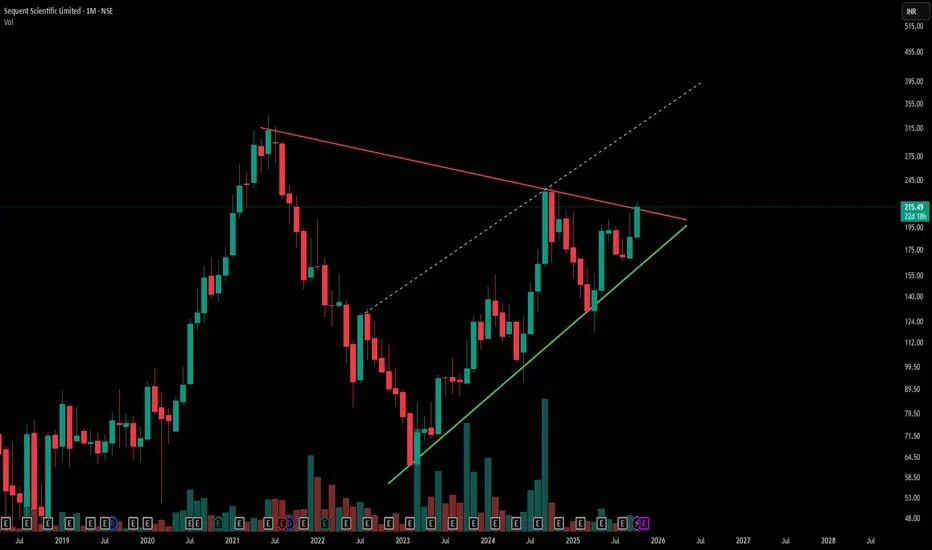
Symmetrical Triangle Breakout Watch | Sequent Scientific-Red line marks a key counter trendline (resistance) from previous swing highs, acting as a short-term ceiling.
-Green line indicates the primary trendline (support) from recent swing lows, showing steady price strength.
-Hidden dashed lines reveal underlying resistance zones, adding complexity to potential breakout levels.
-The overall chart displays a large symmetrical triangle pattern—a classic consolidation setup, Simple .
- Disclaimer: Trading involves significant risk and is not suitable for all investors. Past performance does not guarantee future results. Always conduct your own research, consider seeking advice from a qualified financial advisor, and trade only with capital you can afford to lose.
BUY TODAY SELL TOMORROW for 5%DON’T HAVE TIME TO MANAGE YOUR TRADES?
- Take BTST trades at 3:25 pm every day
- Try to exit by taking 4-7% profit of each trade
- SL can also be maintained as closing below the low of the breakout candle
Now, why do I prefer BTST over swing trades? The primary reason is that I have observed that 90% of the stocks give most of the movement in just 1-2 days and the rest of the time they either consolidate or fall
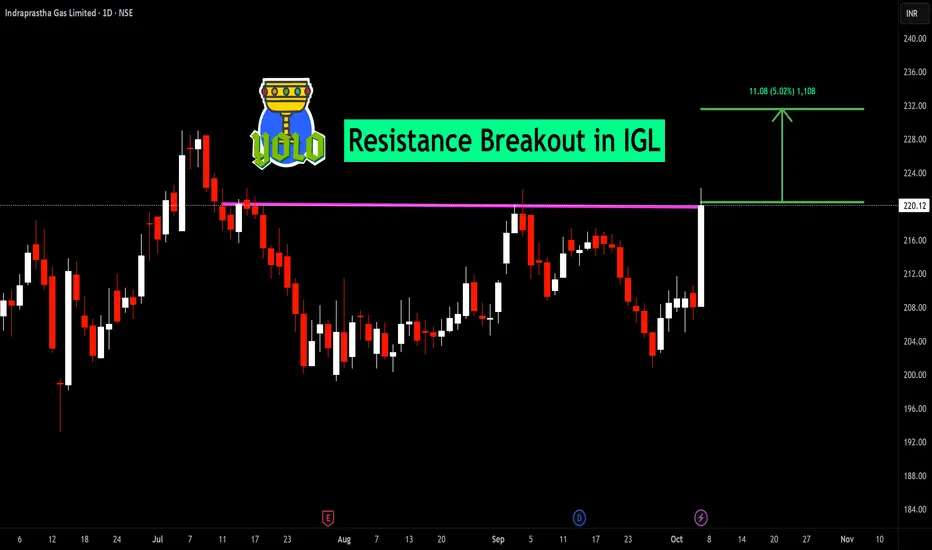
Resistance Breakout in IGL
BUY TODAY SELL TOMORROW for 5%
How to Identify Right Breakout Candle ? Stocks and Price actionI make educational content videos for swing / positional trading .
In this I am sharing some information out of the vast trading knowledge I have gained through my experience in the markets .
Charts used are older than 3 months

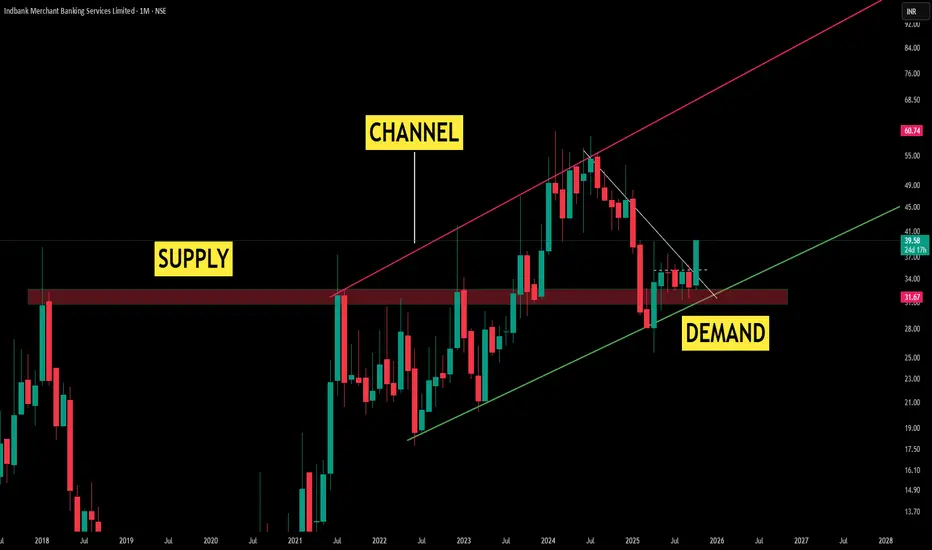
Monthly Market Regime: Supply-to-Demand Shift Framed by ParallelTheme 1: Regime Shift
A prior supply pocket has matured into a demand base as monthly closes repeatedly sustained above the zone
Theme 2: Channel Governance
A clean, supportive parallel channel has developed; price has been guided by its rails, offering objective context for expansion and contraction phases on the higher timeframe
Theme 3: Higher Highs, Higher Lows
Successive higher highs align with the channel’s upper boundary acting as dynamic headwinds, while higher lows respect the supportive green line, preserving trend health.
Theme 4: Counter Trendline (CT)
The white CT outlines the corrective path within the advance, visually separating pullback structure from primary momentum
Disclaimer: Technical analysis provides probability-based insights. Always implement proper risk management and consider multiple timeframe confirmations before executing trades.
XRP Breaks Above $3 – Bullish Momentum BuildsOverview:
XRP has officially closed the week above the $3 mark, a psychological resistance now turning into support. This is a major technical shift suggesting renewed bullish control.
🔑 Key Levels to Watch:
Support: $3.00
Short-Term Target: $3.20
Major Resistance / Magnet: $3.60 (All-Time High)
📊 Market Structure:
XRP appears to be breaking out of a consolidation zone between $2.70 and $3.00. This range held for several weeks, and a clean breakout could fuel a strong continuation toward previous highs.
🐂 Bullish Scenario:
Continued higher highs with volume could open the path to $3.20 and eventually $3.60.
A successful retest of the $3 level as support would further validate the breakout.
⚠️ Risk Note:
Watch for any fakeouts or low-volume rallies. A drop below $3 would negate the breakout and put the $2.70 support back in play.
📅 Outlook:
With Q4 2025 underway, a rally toward the ATH at $3.60 could be driven by both technical momentum and market sentiment.
💬 What’s your take? Are we heading for a new ATH this quarter?
📌 #XRP #Crypto #Altcoins #Breakout #TechnicalAnalysis #Q4Outlook

BUY TODAY SELL TOMORROW for 5%DON’T HAVE TIME TO MANAGE YOUR TRADES?
- Take BTST trades at 3:25 pm every day
- Try to exit by taking 4-7% profit of each trade
- SL can also be maintained as closing below the low of the breakout candle
Now, why do I prefer BTST over swing trades? The primary reason is that I have observed that 90% of the stocks give most of the movement in just 1-2 days and the rest of the time they either consolidate or fall
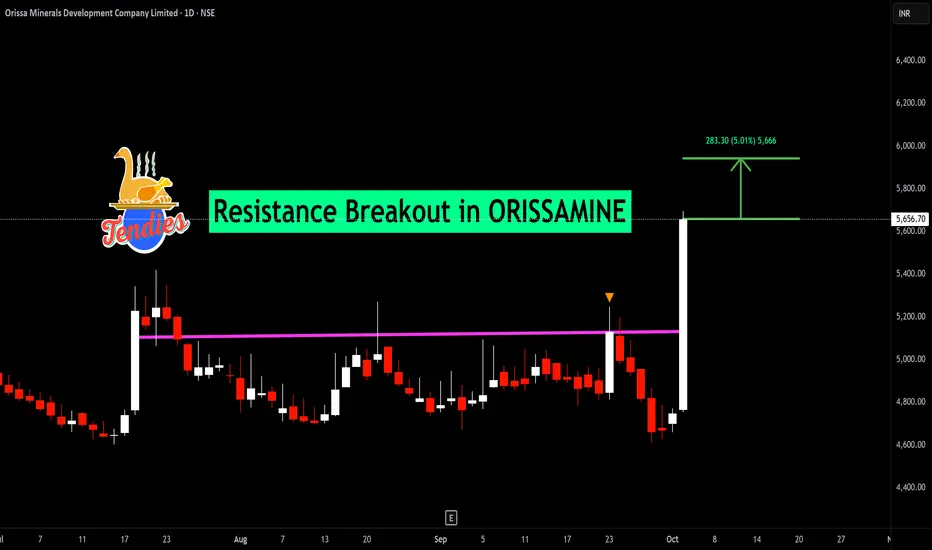
Resistance Breakout in ORISSAMINE
BUY TODAY SELL TOMORROW for 5%