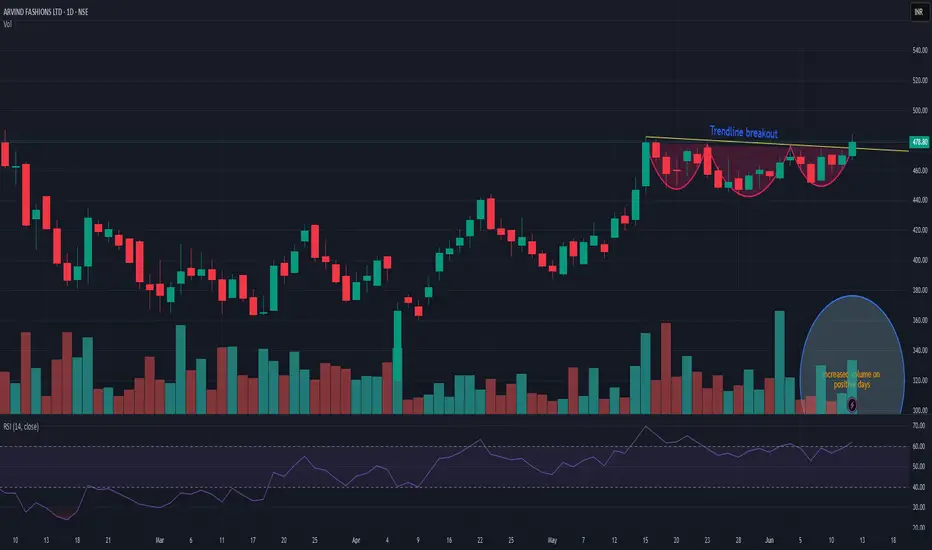
ARVINDFASNARVINDFASN showing very good strength on this negative days as well and currently trying to coming out of consolidation. As long as it is closing above 440 then dips are good to accumulate. Positive momentum may fetch the stock up to 600 in near term. And next trigger level can b above 485. Wait for the perfect entry point.
Breakout!
Pfizer: supply zone breakout-A simple supply zone breakout
-My entry is at 5800, with a stop loss of 5599
-there has been a volume uptick of late with some interesting developments in the cancer and other fields including expansion in China by the parent company
-Covid resurgence also increases the demand of the vaccine which may again improve the top and bottom line

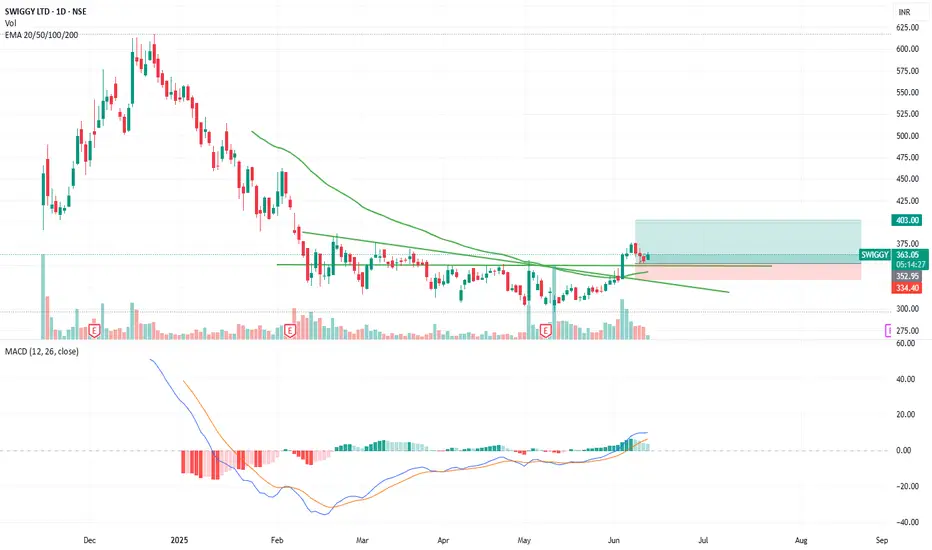
SWIGGY LTD – Breakout & Retest Confirmation on Daily Chart Note : This is only a chart analysis and for study purposes. Not a recommendation to buy or sell.
Chart Analysis Summary:
Breakout Zone:
The stock has clearly broken above a descending trendline that acted as resistance for several months. The breakout was supported by a strong bullish candle with notable volume, indicating genuine buying interest.
Volume:
The breakout candle shows a volume spike, validating the move. Volume continues to remain stable post-breakout, supporting the sustainability of the trend.
Retest Confirmation:
After the breakout, SWIGGY came back to retest the breakout zone (~345-350) and formed a bullish reversal, confirming the support zone.
Current Price Action:
Price is now moving higher again, suggesting the end of the retest phase and a potential beginning of a fresh uptrend.
EMA Analysis:
Price is trading above the 20/50/100/200 EMA cluster (currently near 339.25), which was earlier acting as a dynamic resistance and now may serve as support.
MACD:
MACD crossover above the signal line is visible and trending upward – a bullish momentum signal.
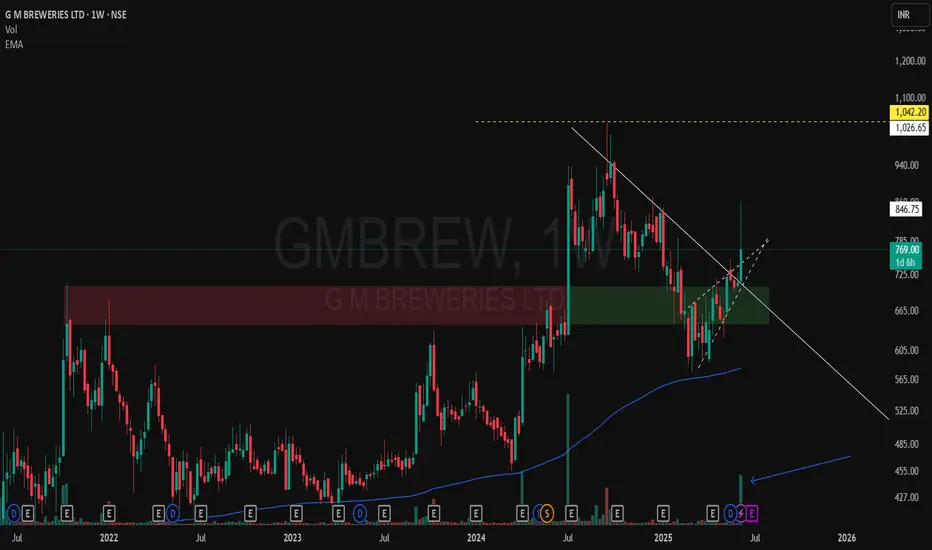
GM BREWERIES – A Classic CT Breakout with Strong Demand Flip🔍 A solid Weekly Time Frame (WTF) structure is visible here on GMBREW:
-The red-green zone highlights a classic supply turning into demand, supporting the structure.
-A clear Counter Trendline (CT) breakout (white line) is now visible, showing strength with increasing momentum.
-Notice the strong spike in volume – this breakout isn't silent. Participation has significantly picked up.
-Yellow line represents the MTF supply, which could act as the next area of interest.
-Price is currently showing a wick, so weekly closing behavior will be key from here.
-No predictions – just a technical snapshot. Structure, volume, and zones are aligning well here. Let’s see how it unfolds. 📊
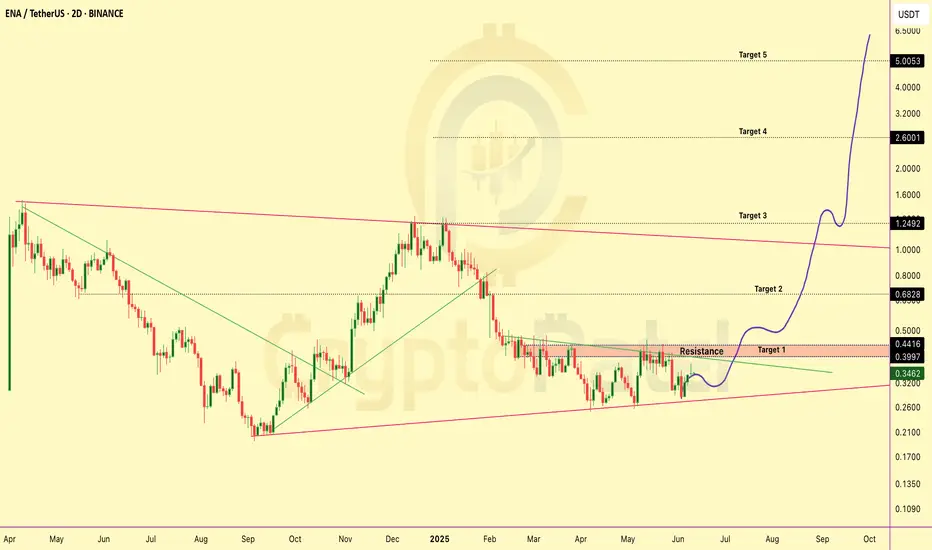
ENA/USDT Chart Analysis — Is It the Right Time To Accumulate?ENA/USDT Chart Analysis — Is It the Right Time To Accumulate?
MIL:ENA is still trading nearly -77% below its all-time high (ATH) of $1.52, currently hovering around $0.34.
Right now, the price is sitting above a strong support zone near $0.27, making the current range of $0.34–$0.30 an attractive accumulation zone — especially for long-term investors.
Short & Long-Term Targets:
Short-Term Targets: $0.44 → $0.68 → $1.25
Long-Term Potential: $2.60 → $5+
Key Levels To Watch:
Major Resistance: $0.45 — a breakout above this level could pave the way toward the $1 zone.
Strong Support: $0.27 — holding this level is critical to maintain bullish momentum.
Risk Note: As always, this is the crypto market — highly volatile and inherently risky. Please do your own research and manage risk wisely. This is NOT financial advice.
👉 Will ENA deliver another big leg up? Let us know your thoughts!
Note: NFA & DYOR
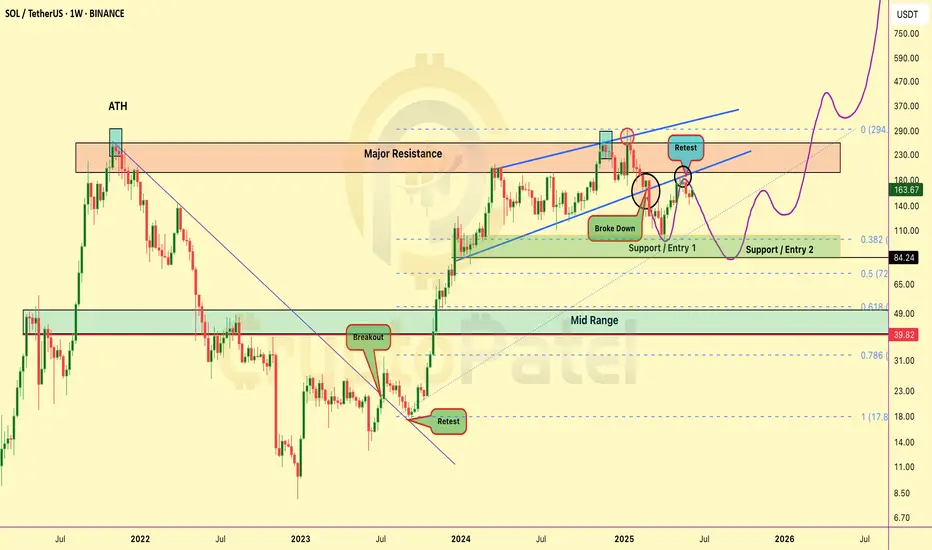
Is $SOL about to DUMP… or set up a MASSIVE BUY ZONE?Is CRYPTOCAP:SOL about to DUMP… or set up a MASSIVE BUY ZONE?
Solana is now at a critical level on the higher timeframe chart:
✅ After a breakdown, SOL is now retesting the bearish retest zone
✅ Strong resistance seen at $170–$180
✅ If rejected → price could dip toward the $100 range
But here’s the key: A dip to $100 would be a massive long-term buying opportunity for many investors (including me).
Long-term targets? I’m still eyeing $500 → $1000 if the macro trend plays out.
👉 Keep a close eye — the next few weeks could set up the next big move for $SOL.
Are you ready? Will you be buying the dip? Comment below! 👇
NFA & DYOR
This BTC Pullback Could Be The Last Dip Before $120K+ — Are You #Bitcoin has just delivered a textbook breakout — but what comes next might surprise you. Let’s break it down: 👇
🔸 Bearish Order Block @ $109K–$110K
Price tapped into this zone and is currently reacting. Expect short-term volatility here.
🔸 FVG (Fair Value Gap) Filled + Tapped
A clean move back up filled the previous FVG — this typically signals strength but also invites sellers at OB zones.
🔸 Key Bullish Order Block @ $106K
If BTC pulls back, this zone will be crucial. A strong defense here could ignite the next leg up.
🔸 Fib Levels Aligned:
0.382 Fib @ ~$104.5K
0.5 Fib @ ~$102.2K
0.618 Fib & Bullish OB cluster @ ~$100K ( Filled )
Possible Play Ahead:
A dip toward $106K–$104K is healthy → watch for buyer reaction.
If CRYPTOCAP:BTC holds the $106K OB and bounces, a move back toward $112K+ ATH retest is very likely.
Big Picture:
The breakout from the descending channel + OB retest gives BTC strong bullish structure — as long as the $106K zone holds.
Are you ready for the next BTC move?
📈 Comment below: BULLISH or BEARISH?
🔄 Retweet to keep others in the loop!
NFA & DYOR

KRISHANA PHOSCHEM LTD | Major Breakout Ahead? Hey Family, here’s another stock showing a strong technical setup! 🚀
Key Observations:
Pattern : Formation of a Rectangle Box Pattern on the Daily Timeframe (1D).
Range Period:
Stock moved within a horizontal range between June 2024 to April 2025.
Multiple tests near the upper resistance band during this period.
Resistance Behavior:
Price repeatedly tested the resistance zone around ₹278–₹285.
Now showing signs of a breakout attempt and trying to sustain above the range.
Volume Insight:
Noticeable volume accumulation over the past few sessions.
Volume spikes during breakout candles suggest strong buyer interest.
Candlestick Structure:
Strong bullish candles with minimal rejection indicate a genuine attempt to break out.
🚨 Disclaimer: What is your view please comment it down and also boost the idea this help to motivate us. We are Certified. All views shared on this channel are my personal opinion and is shared for educational purpose and should not be considered advise of any nature.
🚨 Note: Always manage risk and do your own research.

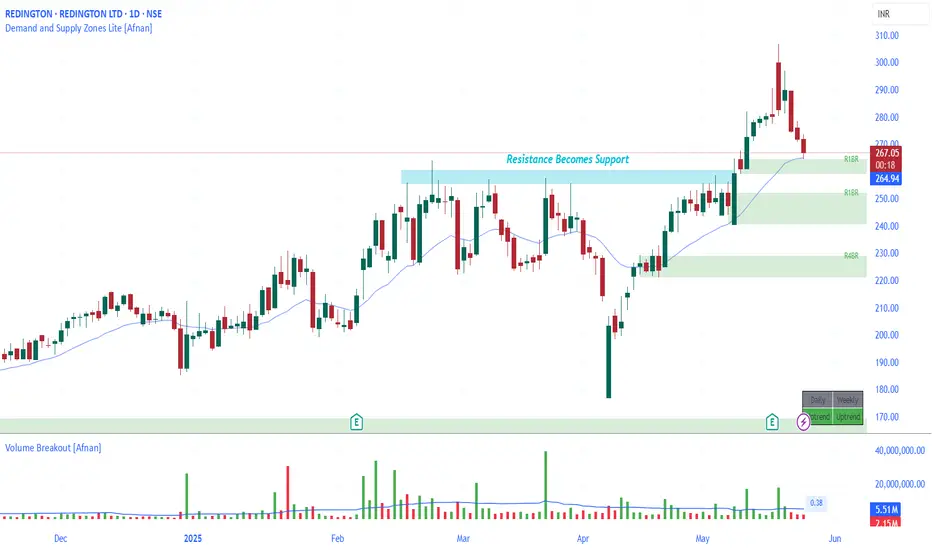
Strong Confluence Setup : REDINGTON at Crucial Demand Zone
REDINGTON is showing signs of a promising technical setup — something that can catch the attention of demand and supply zone traders. Let’s break down the analysis in simple words so that even a beginner can understand why this stock might be at an interesting level.
🔥 The Demand Zone Setup 🔥
The stock is currently hovering around a Rally-Base-Rally demand zone. This is a price area where big institutions may have left pending buy orders before pushing the price higher.
📉 Confluence of EMA and Support Flip
Here’s where the setup gets even more interesting. Apart from the demand zone:
REDINGTON is trading near its 20 EMA — a dynamic support level that often helps price bounce in uptrends.
There was a recent resistance breakout — price struggled to go above a certain level, broke through it with heavy volume, and is now returning to retest that same level.
Resistance turns into support : This classic law of polarity increases the odds of a bounce from here.
💡 Volume Analysis Matters
The breakout candle had heavy volume. Now, as the price pulls back to the demand zone, volume is dropping — this is a healthy sign. It suggests the sellers are weakening and the buyers might soon step in again.
👣 Smart Money Footprints & Pending Orders
Demand zones reflect unfilled institutional orders. If smart money had previously bought here, they may defend this zone to protect their positions. That could mean more buying at this level, pushing the price higher once again.
⚠️ But Wait — Risk Management is Key!
Even high-probability setups can fail — and that’s just the nature of trading. Always use a stop-loss. The goal isn’t to be right all the time — it’s to manage risk smartly and survive long enough to be consistently profitable.
📊 Setup Summary
Price near RBR demand zone Strong case for smart money entry
Confluence of 20 EMA support
Polarity principle : Resistance turned into support
Volume drop on pullback — bullish signal
Always place stop-loss — risk management matters
📌 "In trading, confidence comes from preparation — not prediction."
Lastly, Thank you for your support, your likes & comments. Feel free to ask if you have questions.
⚡ Stay focused, trade smart, and let the charts do the talking! ⚡
This analysis is for educational purposes only and is not intended as a trading or investment recommendation. I am not a SEBI registered analyst.
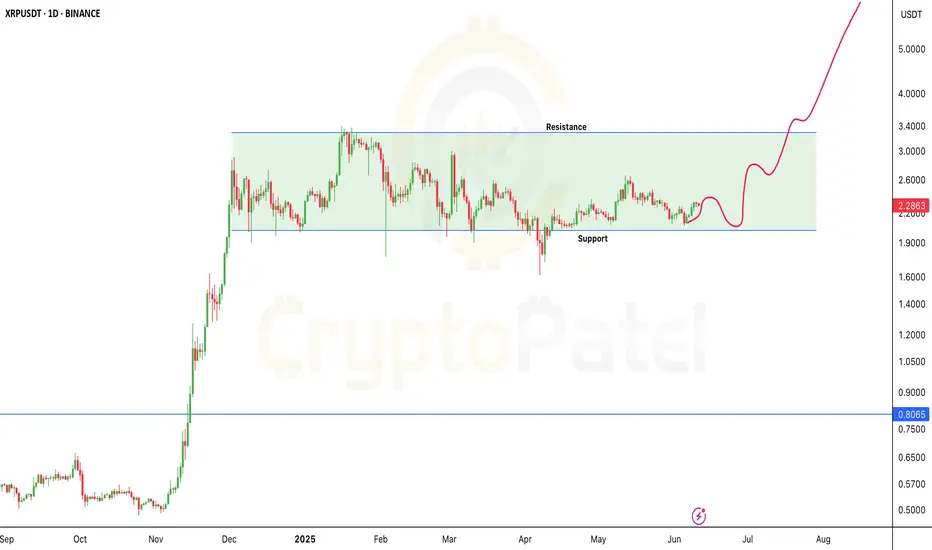
XRP Breakout Watch — Will June 16 Trigger a Bull Run?🚨 XRP Breakout Watch — Will June 16 Trigger a Bull Run? 🚨
CRYPTOCAP:XRP is holding above the key $2 support.
👉 A breakout above $2.65 → $3.00 is in play.
👉 Whale accumulation rising. Volume tightening.
👉 Ripple vs SEC ruling expected soon.
Targets if bullish: $3 → $8 → $13 🚀
Downside risk: Below $2 → $1.50 or lower.
Note: NFA & DYOR
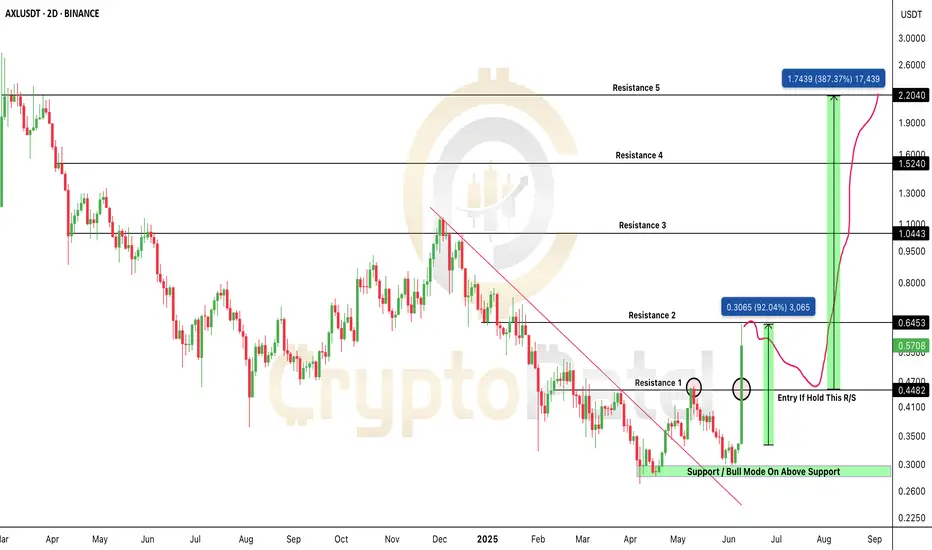
$AXL/USDT — Massive 90% Breakout, But Is It Time To Buy?$AXL/USDT — Massive 90% Breakout, But Is It Time To Buy?
NYSE:AXL has exploded +90% in just 2 days, breaking out of a long-term downtrend with huge volume.
The chart looks fire — but traders, beware:
High volatility = high risk at these levels.
Here’s the technical read:
✅ Downtrend broken
✅ $0.4482 resistance flipped → acting as strong support
✅ Structure is bullish — but a healthy correction is expected
My current view:
→ I do NOT suggest entering at this level.
→ If already holding → now is a good time to book partial profits.
👉 I expect a ~30% pullback from here.
👉 A 2-day close above $0.4482 will confirm strength and create a good accumulation zone.
👉 If not → deeper pullback toward $0.44–$0.34 zone likely.
Best Accumulation Zone:
$0.44–$0.34 — patience required — don’t chase tops.
Targets after correction: $1 → $2 → $3 → $5
Stop Loss: below $0.31
Bottom line:
The trend shift is real — but after a parabolic +90% move, entering now is chasing risk.
NFA & DYOR
Multi time frame charting explained in GEPILI make educational content videos for swing / positional trading

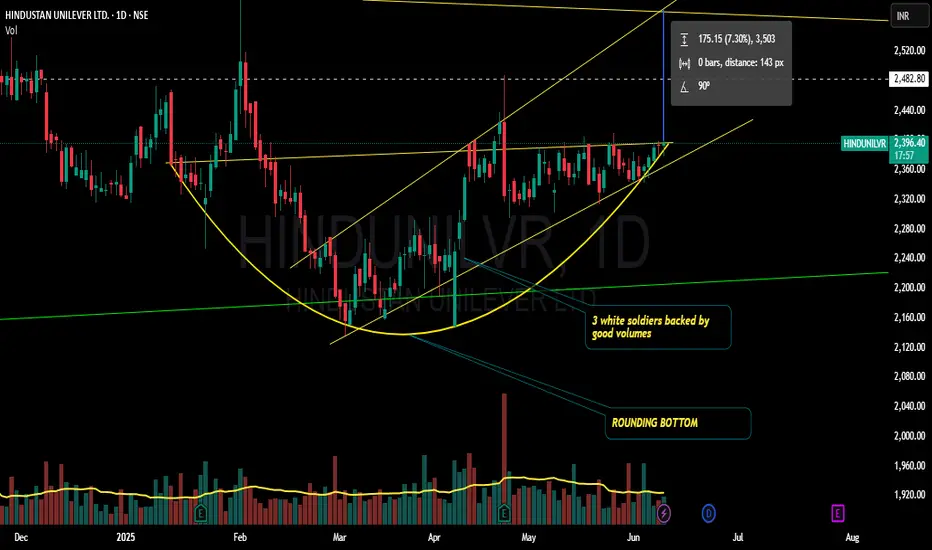
Hindunilvr longing for a breakout??!!Chart patterns inflict me the above titled opinion
Breakout can be expected as it has not breached the low made on 25th april 2025 and has been consistently making higher highs and higher lows(seen clearly on hourly charts)
Entry after the breakout.. ...
Godrejcp also seen for a up move!!!!
will update once it breaks out!!!!
Thank you.
This is just my opinion...not a advice!!!!
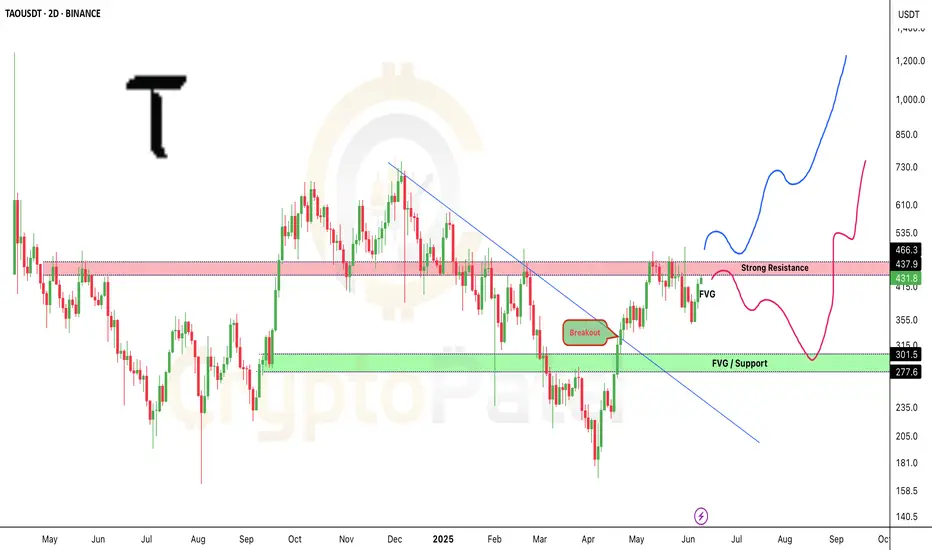
$TAO at a Critical Make-or-Break Zone!LSE:TAO at a Critical Make-or-Break Zone!
LSE:TAO just delivered a clean trendline breakout, with price now approaching a major decision area:
🔹 Currently testing the FVG zone
🔹 Strong Resistance overhead is the next key level to watch
Scenarios:
✅ A breakout & hold above resistance → Targets open toward $730–$1,200+
❌ A rejection → Potential retest of the $301–$277 support zone (FVG)
I’m personally watching this setup VERY closely — high volatility expected ahead. Are you prepared for the next move?
Note: NFA & DYOR
ADANIGREENADANIGREEN has given resistance breakout with decent volume. Resistance on upper side is around 1250 and support is nr 980-90. Today traction in ADANI group has been observed and this may push fresh momentum in upcoming days. Keep it on radar

TechM - Flag Breakout A good Flag Breakout on Daily Chart.
Indicators is also showing strength.
Breakout above 1610
Flag height - 425 points
Target - 2000
#ShortTerm Trade.

ETHOSLTDETHOSLTD has given breakout after so long and after many attempt. It may face bit resistance near 3050 level but once it crosses it may take a new ride. It has a potential to go up to 3500 and above that it may enter in to uncharted area. If I talk about fundamental event then on 12 june it will be split by 1:1. So after split we may see volume bounce as well which may lead to start a momentum rally. Now if I talk about long term chart ie weekly/monthly then on both format it is showing very good strength. I won't be surprised even if it trades above 4400 levels. My view will be changed if it goes below 2650.

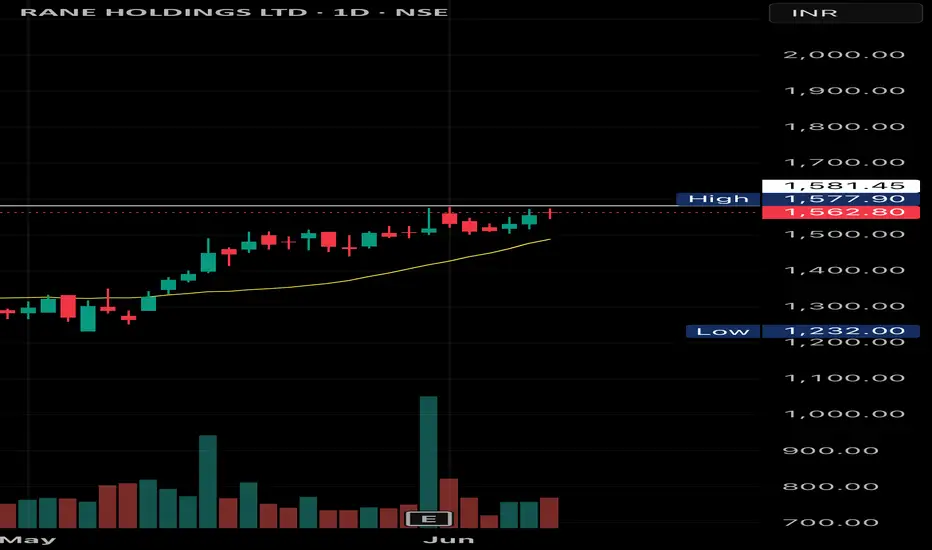
RANE HOLDING SWING TRADE SETUPRane holding swing trade setup. Breakout soon possible, can be a good breakout above 1581 and stop loss Below 1544. Analyse yourself before entry
Share your view on this
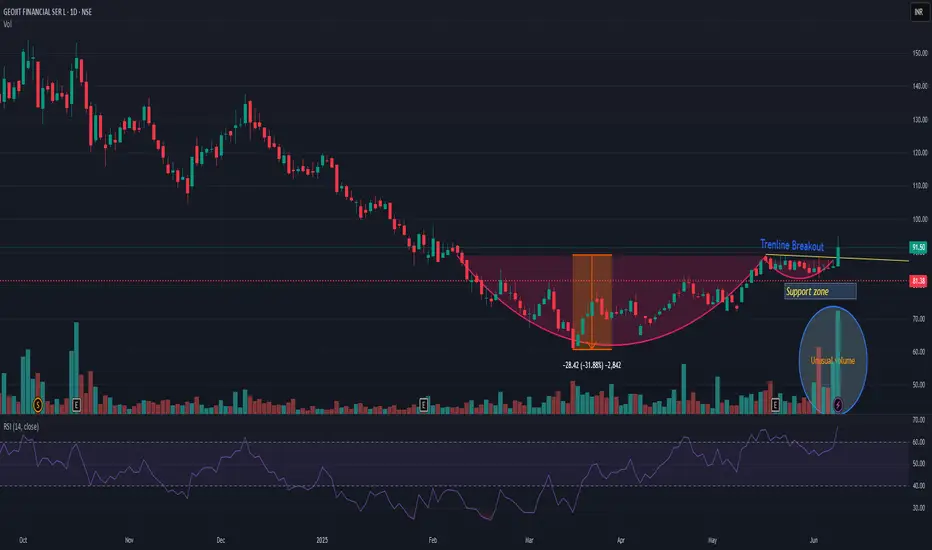
GEOJITFSLGEOJITFSL showing strength and has given short term breakout. Cup and handle pattern has also been observed. Now if I see pattern target then 25-30% up side is possible. Since September highest volume also observed today. My view will be changed if it closes below 81. Risk reward is quite in favor.
Amber Enterprise - Symmetrical Triangle Breakout from a Symmetrical triangle on a weekly chart
Triangle Height : 2100 points
Breakout above 6650 (breakout done)
Target : 8740 (Return 31-32%)
#Medium Term Trade.
Indicators are also showing strength for upside.

Inside 2 Weekly Timeframe CT Breakouts With Strong VolumesPurely chart-based view. No bias. No advice. Just how I interpret these right now
I make educational content videos on Swing trading .

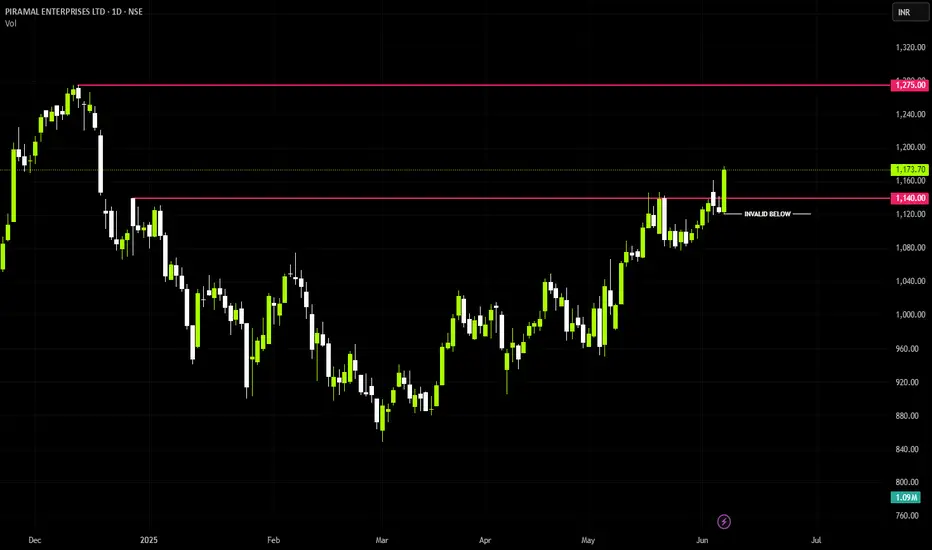
PEL (LONG)Price broke out above key resistance level of 1140 rs
Points Co-Relating
- Break Of Resistance
- Ema-21,50,200 Lined Up Bullish
- Big Bar Breakout
Next Level = 1275
Till Then, Stay Focused
STOCK - PFC (POSSIBLITY OF LONG HAPPENDING)Price seen breaking out a downward trendline
Retest is pending
Near Support -400 Rs
Resistance - 444
Resistance - 474
Resistance - 523
Till Then Stay Focused,
