UltraTech Cement | Pullback Opportunity after Breakout?Description:
- After breaking out of a consolidation zone, UltraTech Cement is showing a controlled throwback towards prior resistance, now acting as support.
- Weekly structure remains intact with sloping EMAs and positive momentum.
- Daily & Hourly charts show minor weakness but no structural breakdown.
- EFI suggests lower TF selling pressure, while weekly remains stable.
📌 Entry Zone: ₹12,037
📉 Stoploss: ₹11,850 (ATR-based)
🎯 Targets: ₹12,937 → ₹13,139 → ₹13,427
Cement sector is gaining strength in the broader infra rally — watching for confirmation on bounce from support.
Breakout

Gold Surges on Weak NFPHello everyone, what’s your take on XAUUSD?
Gold prices soared at the end of the last session and are now trading around $3,380. This sharp rise followed a weaker-than-expected U.S. Non-Farm Payrolls (NFP) report, which shifted market sentiment toward expectations that the Fed may delay interest rate cuts. As a result, the U.S. dollar weakened and demand for gold as a safe haven surged.
Technically, gold appears to be forming a cup and handle pattern, with the first resistance target at $3,400, followed by $3,435.
What do you think? Could this rally continue? Let us know in the comments!

Godfrey Phillips India - Breakout Setup, Move is ON...#GODFRYPHLP trading above Resistance of 6771
Next Resistance is at 9804
Support is at 4339
Here are previous charts:
Chart is self explanatory. Levels of breakout, possible up-moves (where stock may find resistances) and support (close below which, setup will be invalidated) are clearly defined.
Disclaimer: This is for demonstration and educational purpose only. This is not buying or selling recommendations. I am not SEBI registered. Please consult your financial advisor before taking any trade.

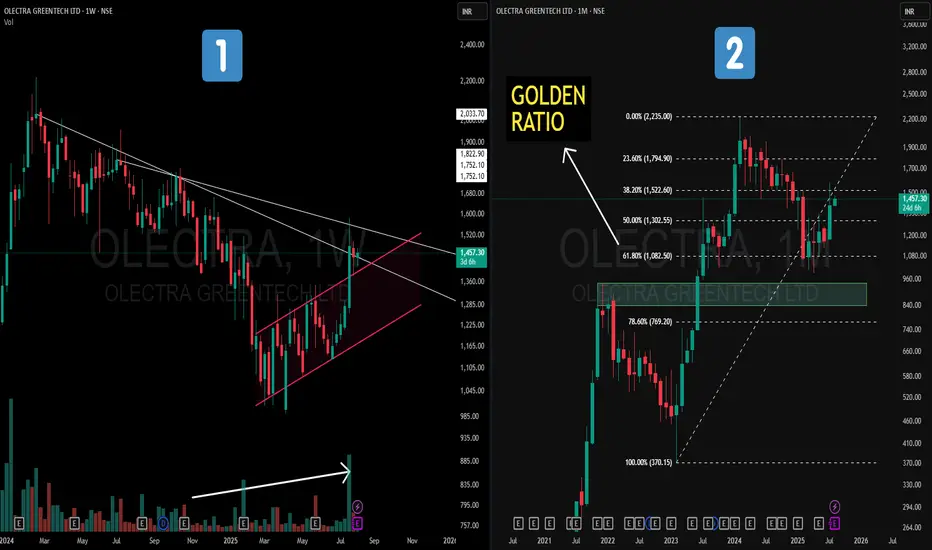
Olectra Greentech – Golden Ratio on MTF + Hidden channel on WTF📝 Description
📌On the Weekly Chart (Left) – Price action has formed a strong counter-trend (CT) breakout from a prolonged downtrend. Hidden within the structure is a parallel channel (highlighted in pink), with volume gradually increasing in the recent rally — a positive sign of accumulation.
📌On the Monthly Chart (Right) – A Fibonacci retracement drawn from the Feb 2023 low to the Feb 2024 high (a one-year strong uptrend) shows price taking support exactly at the 61.8% Golden Ratio. This reaction from a key retracement zone is aligned with historical technical behavior.
This is not a forecast, but rather a technical observation of structure, retracement behavior, and volume dynamics.
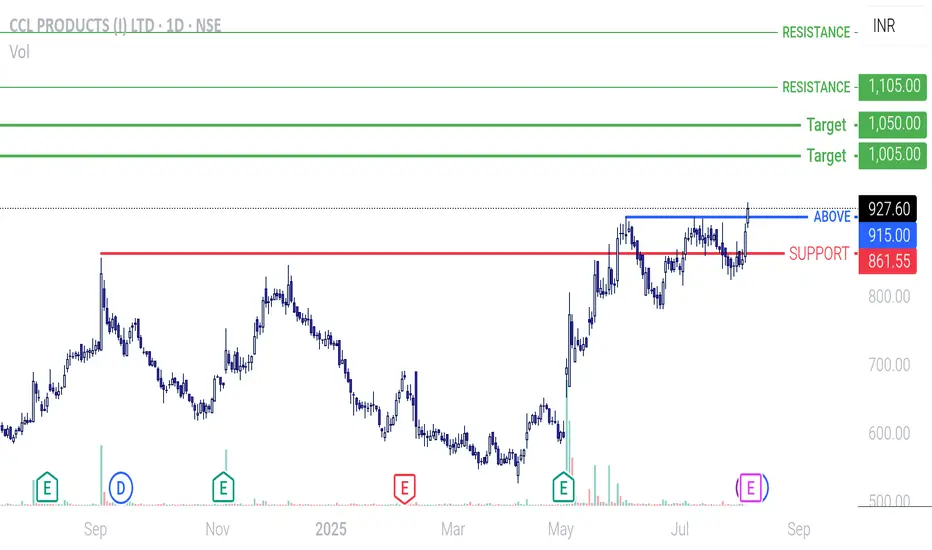
CCL ProductsCCL Products is a global leader in private-label coffee manufacturing. It has a diversified client base across 90+ countries, strong R&D, and efficient operations. For FY24, revenue grew 10% YoY , and PAT rose 21% . The company maintains healthy EBITDA margins (20%) and a strong ROE (18%). Expansion into premium segments and freeze-dried coffee, plus capacity additions in Vietnam and India, support long-term growth. The balance sheet has moderate debt and steady cash flows.
Breakout was witnessed today above a consolidation zone, indicating potential for further upside.
Strong fundamentals backed by technical bullishness make CCL Products a good long-term and swing-trade candidate.
Supply & Demand + Patterns: A Simple Yet Powerful Swing StrategyExplore how supply-demand zones interact with patterns to create high-probability setups. This session breaks down rallies, pullbacks, and a simple process to start building a reliable swing trading strategy . Clear, structured, and beginner-friendly.

Gold regains shine after Fed shiftHey traders! Let’s break down what’s been happening with XAUUSD recently.
Last week, gold made a stunning comeback — tumbling first, then surging nearly 800 pips within just a few sessions. This rapid shift was fueled by dovish signals from the Fed and soft US jobs data, which sparked growing expectations of early monetary easing.
At the same time, a global financial survey shows analyst sentiment toward gold at its highest in months. With ongoing global uncertainty, gold is once again in the spotlight as a go-to safe haven.
Despite the rally, volatility remains elevated. The next move will likely depend on upcoming economic data and fresh comments from Fed officials. Meanwhile, holiday trading could mean slower market activity in the short term.
From a technical perspective, gold has broken out of its previous downtrend channel and is moving rapidly. According to Dow Theory, a short pullback may occur — but if price holds above key support, the bullish wave could extend toward the $3,416 level, marked by the 1.618 Fibonacci extension.
This breakout might just be the beginning of a new bullish phase after weeks of sideways action.
What’s your take — is gold gearing up for something bigger?

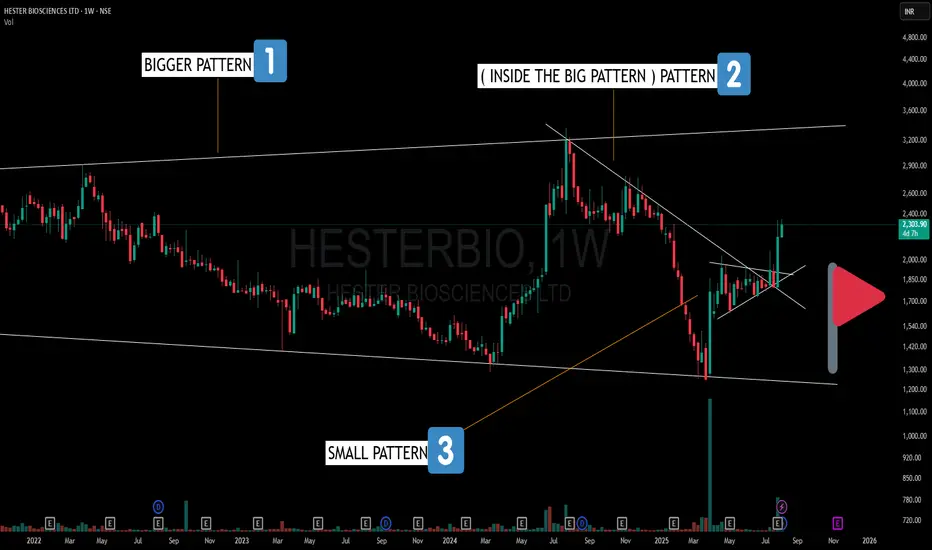
HESTERBIO – A Pattern Inside a Pattern Inside a Pattern!🔍 Here’s what stands out on the Weekly Chart:
1️⃣ Broadening Pattern – Larger structure with higher highs and lower lows, indicating expanding volatility.
2️⃣ Counter Trendline Break – A smaller, random pattern within the broadening formation showing V-shape recoveries and trend shifts.
3️⃣ Bullish Pennant – A compact consolidation pattern just before a strong breakout leg.
This is a great example of how multiple time-frame structures and nested patterns can co-exist—each adding another layer to market behavior.
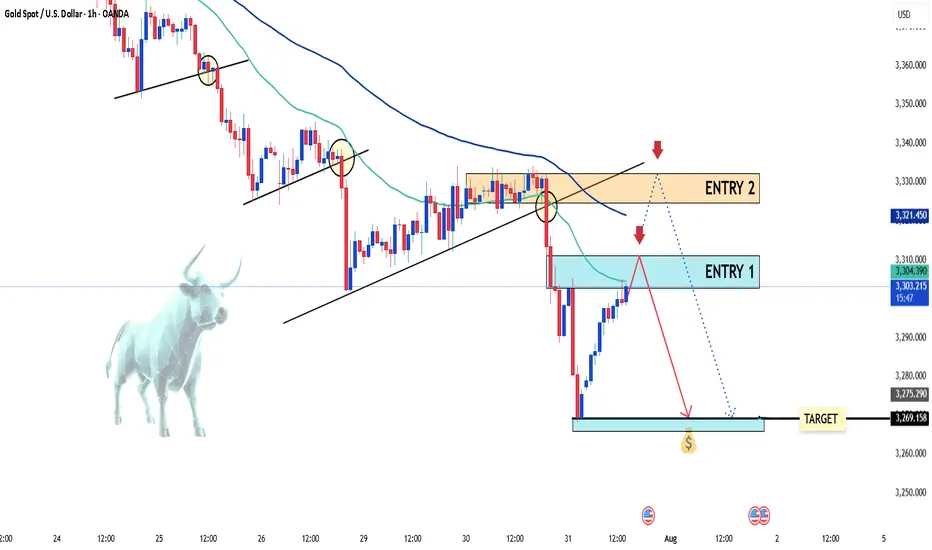
Gold dips again – is the bounce just a trap?Hello traders!
After a quiet start to the day, gold has turned lower and is now hovering around the $3,300 mark. The decline in OANDA:XAUUSD came as U.S. Treasury yields rose in response to strong U.S. economic data. The Fed is widely expected to maintain its current monetary policy stance during today’s session.
From a technical perspective, XAUUSD continues to form bearish structures and breakdowns. While a short-term bullish correction is currently underway, the bears still hold the upper hand — and selling opportunities remain the preferred strategy.
I’ll be focusing on two key entry zones marked on the chart, with a short-term bias favoring sell setups.
Do you agree with this approach?
⚠️ Please remember: This is just a trading idea — make sure to manage your risk properly with defined TP and SL levels.
Good luck and happy trading!
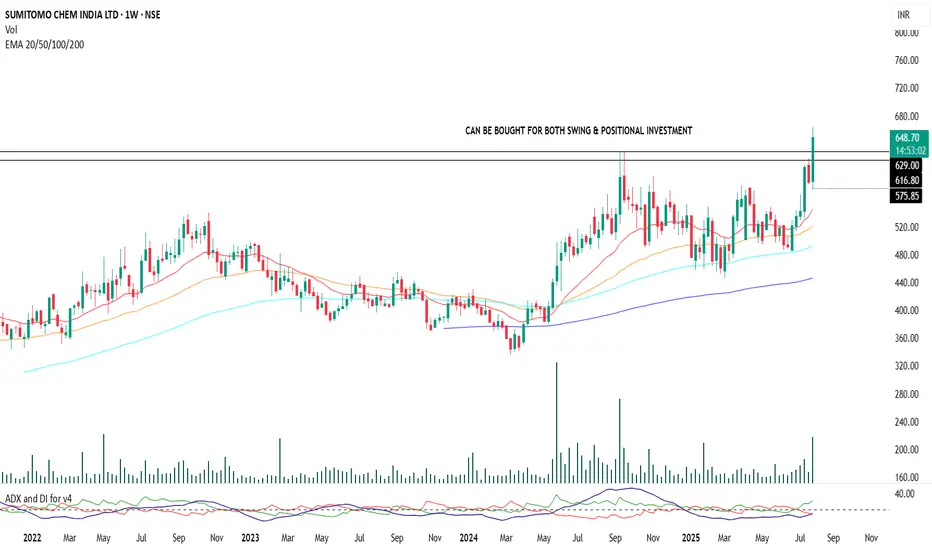
Sumitomo Chemical | Positional Swing Setup with Dynamic SLA strong setup is forming in Sumitomo Chemical with bullish c price action and trend indicators. Entry can be been initiated at current levels with small quantity with a stop-loss placed at ₹570 on a weekly closing basis.
No fixed targets. This is a trailing stop-loss-based position aimed at capturing a sustained trend move.
Add-on Zone: If the price retests the support near the ₹630 level (previous structure/support), more quantity will be added as part of a pyramiding strategy, provided broader market structure remains bullish.
Indicators Used for Trailing SL & Confirmation:
ADX & DI , RSI Levels
Exit Criteria:
Weekly close below ₹570 (hard stop)
Note: This is a disciplined, structure-based swing trade with optional pyramiding. Avoid impulsive exits; trail stop-losses logically based on trend indicators.
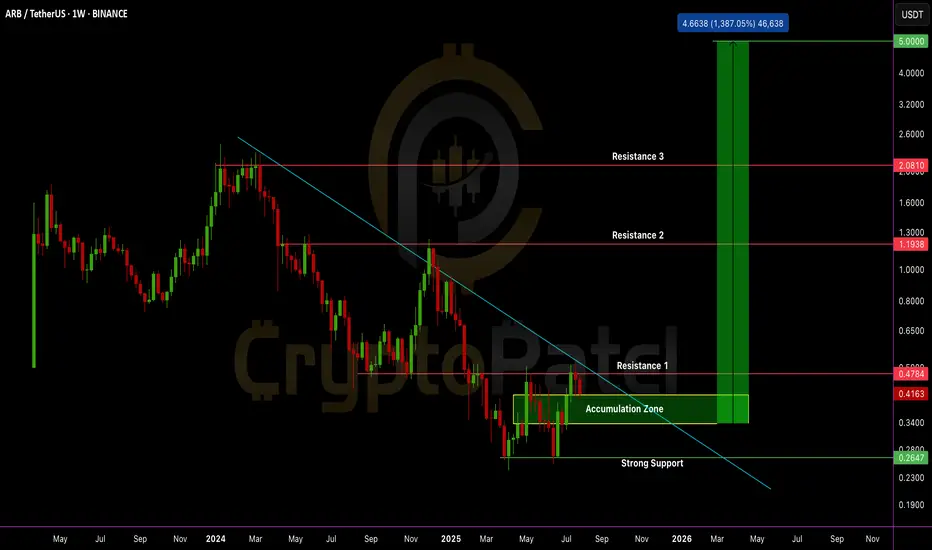
$ARB Ranging in High R:R Zone – Breakout Targets at $1/$2/$5AMEX:ARB Ranging in High R:R Zone – Breakout Targets at $1/$2/$5
🔹 Trend: Macro downtrend intact, price rejected from descending trendline multiple times.
🔹 Current Drawdown: ~84% from ATH – indicating deep retracement and potential reaccumulation phase.
🔹 Structure: Price consolidating within a defined accumulation range between $0.30–$0.40. Demand is stepping in near range lows with wicks indicating buyer absorption.
Breakout Condition:
→ HTF (weekly) close above $0.48 with strong volume = structural breakout
→ Confirmed breakout above range high + trendline = bullish market structure shift
Upside Targets: $1.00 → $2.00 → $5.00
Invalidation Zone:
→ Clean HTF close below $0.24 = invalidation of accumulation thesis
→ Until then, dips into demand remain buy zones; invalidation only triggered on structural breakdown
R/R Outlook:
→ Wide stop, but multi-x reward setup
→ Favorable for long-term positional entries with defined HTF structure
Accumulation evident in key weekly demand zone. Break above $0.48 = trigger for bullish continuation structure. Until then, watch for HTF sweep + reclaim setups and volume confirmation.
Note: NFA & DYOR
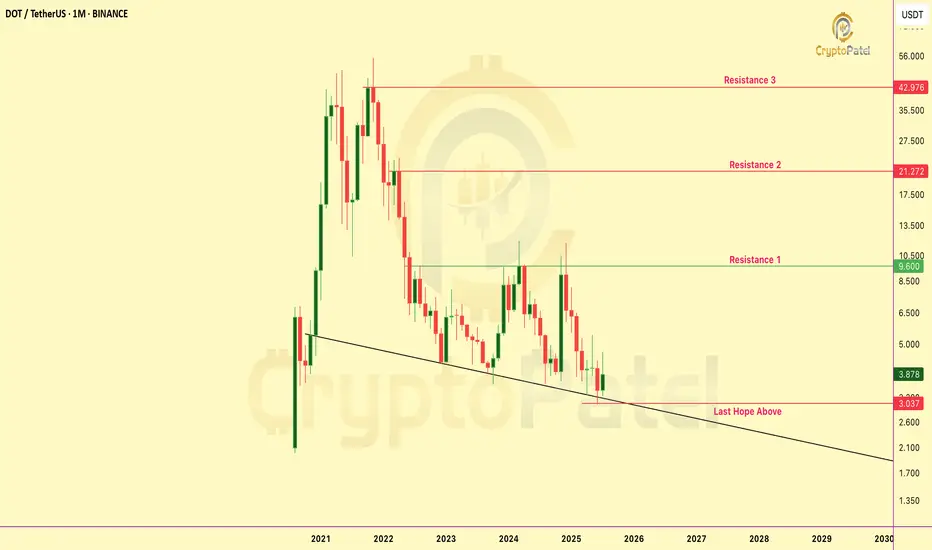
Is Polkadot (DOT) Dead or Ready for a Comeback? Full Update 2025Polkadot was one of the strongest performers of the last cycle. After launching near 2.70 dollars in August 2020, it rallied to an all-time high of $55 in November 2021. That marked a nearly 1,900% gain in just over a year.
However, fast forward to mid-2025, and CRYPTOCAP:DOT is now trading back around its launch price, down approximately 94% from its peak. This has raised a major question among long-term holders and new investors alike: is DOT finished, or is it setting up for a new cycle?
Technical Analysis: Price Structure and Key Levels
DOT’s current price action is best described as a full macro retracement.
Support zone: $2.50 to $3.00: A historically important area acting as both launch base and now long-term demand zone.
Resistance zone: $4.60 to $5.50: Former breakdown levels and local range tops.
Market structure: Still bearish on the macro timeframe, with lower highs and lower lows intact since the 2021 top.
From a risk-reward perspective, #DOT is trading at long-term support levels. If price holds this range, the setup offers asymmetric upside into the next bull phase.
However, a clean break below $2.50 would invalidate this zone and could lead to a deeper correction.
Fundamental Analysis: What Polkadot Is Building
Despite the heavy price drop, #Polkadot continues to execute on its long-term roadmap. Its core value lies in building a scalable, interoperable multichain network powered by parachains and the Substrate framework.
Key Developments in 2025:
Polkadot 2.0 and Elastic Scaling
A major upgrade that introduces Asynchronous Backing, Agile Coretime, and Elastic Scaling to drastically improve block production, scalability, and efficiency.
Polkadot Pay App
Launching in August 2025, this mobile application aims to make DOT more usable for real-world payments and onboarding new users.
DOT Tokenomics Overhaul and ETF Anticipation
A restructured economic model is expected in Q4 2025, potentially adjusting inflation, staking rewards, and circulation dynamics. An ETF approval is also being discussed, which could bring in new institutional liquidity.
Polkadot Hub and Developer Tooling
A unified portal for developer onboarding, launching in October 2025. Polkadot currently maintains over 2,400 monthly active developers and more than 285 parachains.
Asset Hub and Solidity Support
With PVM (Polkadot Virtual Machine), Polkadot now allows Solidity and Ethereum-native applications to deploy directly within its ecosystem- improving dApp compatibility and reducing migration friction.
Sentiment and Investor Psychology
Many retail investors are skeptical due to the prolonged drawdown and loss of momentum. In crypto, narrative plays a crucial role in price recovery. While Polkadot still has strong fundamentals, it currently lacks the hype and retail traction that drove its 2021 rally.
If DOT can regain attention through real-world utility, DeFi growth, or ecosystem traction, its market value could catch up with its underlying development.
Strategy Outlook
From a technical standpoint, this is a make-or-break level. Holding the $2.50 to $3.00 zone is essential for a bullish setup. Failure to defend this base could lead to prolonged accumulation or deeper downside.
From a fundamental view, Polkadot is still among the few L1s delivering real upgrades in 2025. The question is whether the market will reward it.
Conclusion
Polkadot is not dead. It is rebuilding and evolving. The upcoming launch of Polkadot 2.0, tokenomics improvements, developer ecosystem expansion, and cross-chain architecture all position DOT for a potential recovery, if market conditions align.
While the price action has been discouraging, strong fundamentals combined with strategic patience could present an opportunity for long-term holders.
Always manage risk, define your invalidation levels, and evaluate both narrative and execution before making investment decisions & NFA always DYOR.
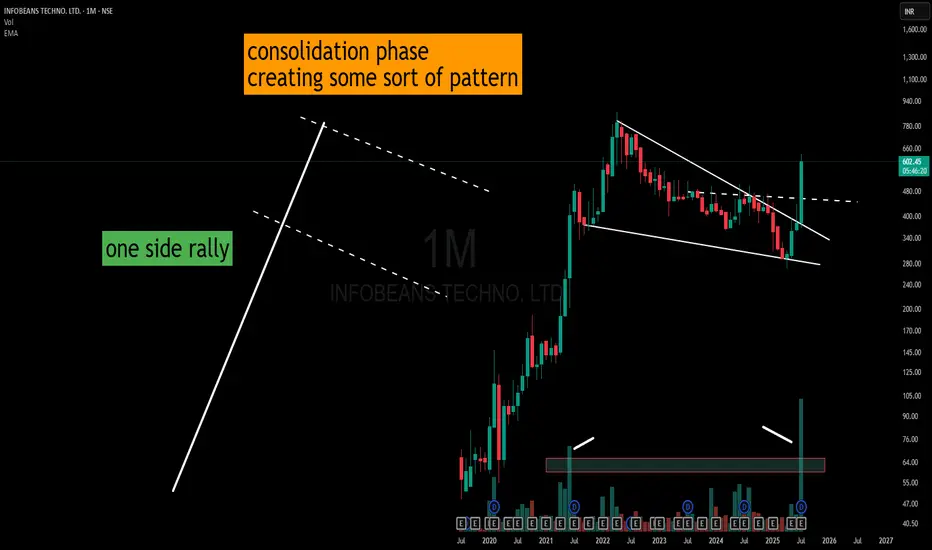
Infobean – Triangle Consolidation with Volume SpikeAfter a sharp one-sided rally, the price entered a prolonged consolidation phase.
Instead of the usual parallel-channel flag formation, the structure has evolved into a descending triangle with slightly lower highs and marginally lower lows.
What stands out is the recent significant volume expansion—often called a “volume buster.” While the shape resembles a pole-then-consolidation setup, the breakout structure and volume shift highlight an important phase change in market activity.
I have only created how I would Draw it and try to get some information out of it.
(This is a structural observation, not a buy/sell recommendation.)
EURUSD at risk of reversal: will sellers take control?Hello everyone! What are your thoughts on EURUSD?
Lately, the euro has been under pressure due to growing weakness in the Eurozone economy. The European Central Bank (ECB) has sent out more cautious signals in response to rising recession risks and cooling inflation. This increases the likelihood that the ECB may wrap up its tightening cycle earlier than the Fed – a shift that could weigh heavily on EURUSD.
From a technical standpoint, EURUSD recently hit a peak around 1.1766 after several attempts, and a CHOCH (Change of Character) reversal pattern may be forming. If the pair fails to reclaim the 1.1766 zone, a deeper downside scenario is likely to unfold.
As for me, I’m currently favoring short setups, especially around supply zones or after failed retests. Discipline and solid risk management remain my top priorities.
How about you? What’s your take on this pair?

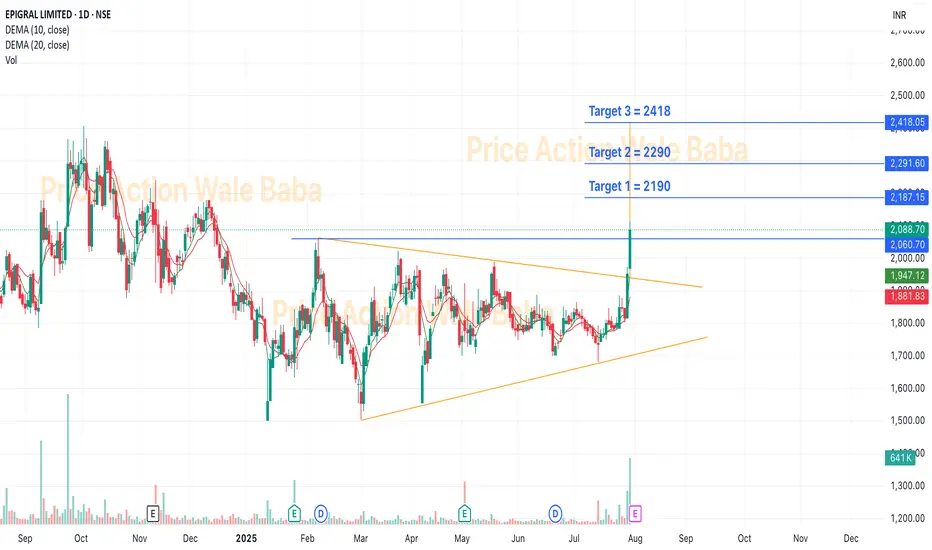
EPIGRAL - BreakoutEpigral Limited, formerly known as Meghmani Finechem Ltd, incorporated in 2007, is a leading integrated manufacturer of chemicals in India. Epigral’s Dahej facility is a backward and forward integrated and automated complex with a well-planned infrastructure.
In India, Epigral is the first to set up an Epichlorohydrin plant and largest capacity plant of CPVC Resin. Epigral is also a leading manufacturer of Caustic Soda, Caustic Potash, Chloromethanes, Hydrogen Peroxide, Chlorine and Hydrogen.
Breakout from the Triangle pattern
Market Cap: ₹ 8,996 Cr.
Promoter holding: 68.8 %
FII holding: 3.06 %
DII holding: 4.78 %
Public holding: 23.3 %
Debt: ₹ 593 Cr.
Debt 3Years back: ₹ 993 Cr.
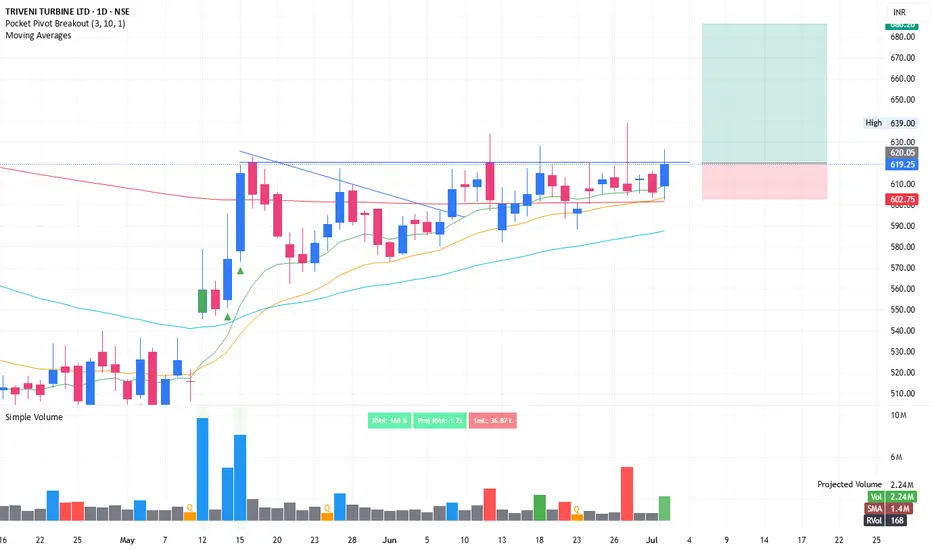
Range break, 1:3 Risk reward, Expecting 10% move in few daysTRITURBINE: Again coming up with swing trade idea. tight consolidation in range of 3% within last 5-6 days. Price is hovering around 10 and 20 EMA. Rejection on 27th Jun shows weak hands going away. Breaking above the pivot line could lead to significant push when crossing with good volume.
SL is somewhere around 3% (Refer the long position drawn over the chart).
One can invest 10% portfolio size as per following calculations
Position sizing and managing risk is the key.
Portfolio is: 1,00,000
Position size: 10,000
Risk 3%: 300. Which means only 0.3% of overall portfolio value is under risk.
Stay connected for commentary for coming days
Disclaimer:
The information provided herein is for educational and informational purposes only and should not be construed as investment advice. The stock analysis and recommendations are based on publicly available information, data sources believed to be reliable, and our interpretation at the time of writing.
Investing in equities involves risks, including the risk of loss of capital. Past performance is not indicative of future results. Readers and investors are advised to conduct their own research or consult a qualified financial advisor before making any investment decisions.
The author(s), affiliates, or associated entities may hold positions in the stocks mentioned, and such positions are subject to change without notice.
We do not guarantee the accuracy, completeness, or timeliness of any information presented, and we disclaim any liability for financial losses or damages resulting from the use of this content.
POL Could 3x After Breakout: Are You Buying the Right Zone?Price is consolidating above the accumulation zone ($0.19–$0.21) after multiple rejections off demand.
Now trading above this base, if price retests the zone, it could offer a high-probability entry.
Key Resistance = Targets: $0.28 → $0.41 → $0.52 → $0.70 → $1–$2
Structure remains valid above $0.150 (HTF close below = invalidation)
Break + Retest of $0.28 = Bullish continuation confirmed
Setup: Accumulation → Expansion
NFA & DYOR

LPT/USDT could 10x soon — If it breaks $8.50, it may fly to $64+LPT/USDT could 10x soon — If it breaks $8.50, it may fly to $64+
🔹 Structure: Accumulation within defined range
🔹 Volume: Gradually increasing near base – sign of quiet accumulation
🟩 Accumulation Zone: $5.00 – $7.50
Price has respected this zone for weeks, with multiple wicks and strong recoveries- suggesting buyer interest and absorption of supply.
🔻 Strong Support: $3.70
Only bullish bias is valid above this zone. A weekly close below it invalidates the bullish setup.
Key Resistances: $8.50/$22.14/$64.67
Structure Bias:
Forming a macro rounded bottom- a Bullish reversal base. Breakout above $8.50 could trigger trend expansion toward higher timeframe targets.
Observation: Breakout + Retest of Resistance 1 = Momentum confirmation. Hold bias only above weekly closes above R1.
Note: NFA & DYOR Before any Investments.

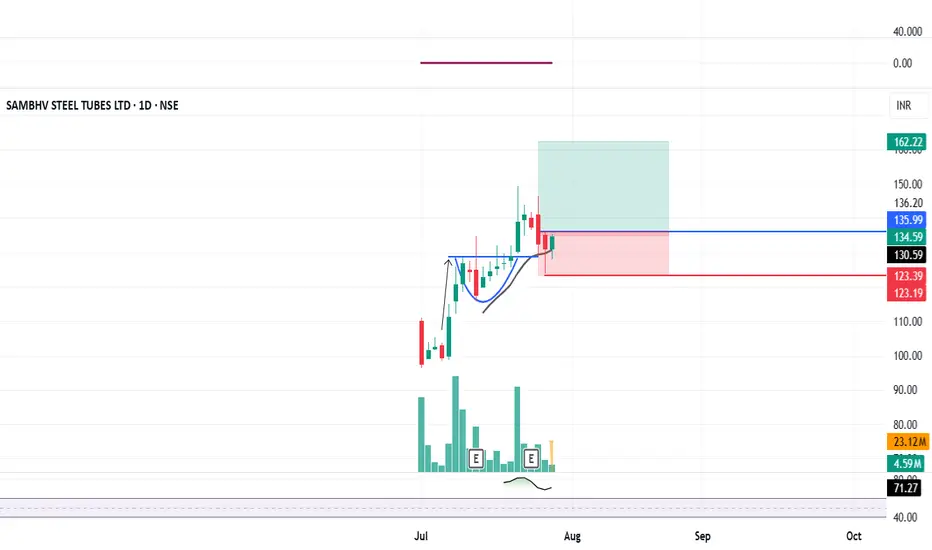
SAMBHV: IPO Base Breakout + Retest done#SAMBHV #ipostock #breakoutstock #trendingstock #swingtrading
SAMBHV : Swing Trading
>> Breakout & Retest done
>> Trending stock
>> Good Strength & Volumes
>> Low Risk High Reward Trade
Swing Traders can lock profits at 10% & Keep Trailing
Pls Comment , Boost and Follow for more such Analysis
Disc : Charts shared are for Learning Purpose and not a Trade recommendation, Consult your Financial advisor or a SEBI Registered Advisor before taking position in it.
PAYTM, BIG BULLISH BREAKOUT HAPPENINGPaytm, one9 communication 1065, has given highest weekly closing in last 30 months. Stock ready for 1250/1320/1450/1600.
Good horizontal trendline resistance taken out at 1020 levels. Volumes are supportive
Trade negates if closed below 940 levels on weekly closing basis. Bigger Stop at 860 levels.

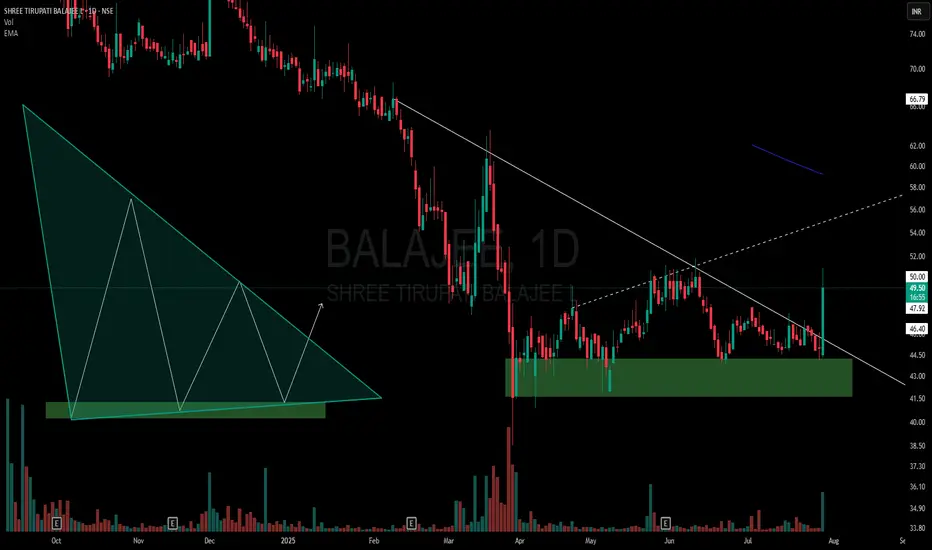
BALAJEE - Descending Triangle Meets Multi-Pattern ConfluenceOn the daily chart of Balajee, price action has formed a descending triangle right at the lower end of the trend:
🔻 Lower highs consistently pressuring horizontal support.
🟩 Price sitting within a clear demand zone, adding significance to the structure.
📊 Volume tapering off through consolidation, a classic triangle trait.
📐 Presence of a hidden counter-trend line (dotted) hinting at a potential broadening formation — showing a rare multi-pattern overlap.
Such setups are important not for predicting price, but for understanding how multiple structures can interact.
⚠️ Purely educational observation — no buy/sell advice.
Gold dives toward 3,320 as Fed decision loomsHello everyone, what are your thoughts on gold prices?
Gold's decline is accelerating, dragging the precious metal down toward the 3,320 USD mark. A stronger U.S. dollar and further developments on the trade front following the U.S.-EU agreement have significantly impacted demand for safe-haven assets.
From a technical perspective, the break below the rising price channel could mark the beginning of a deeper correction. Oscillators on the chart have just started turning negative, suggesting that the path of least resistance for gold is now downward.
Looking ahead, Wednesday’s key FOMC decision—along with the accompanying policy statement and Powell’s press conference—will be closely scrutinized for clues on the Fed’s interest rate cut roadmap.
Additionally, investors will face several important U.S. macroeconomic data releases this week, which will play a vital role in shaping the USD’s trajectory and provide new momentum for XAUUSD.
What do you think about the precious metal? Share your thoughts below!

EUR/USD Under Pressure : Sell or Buy ? The EUR/USD pair remains under mild bearish pressure, hovering around the 1.1700 mark and extending its Thursday downtrend. Meanwhile, the US Dollar (USD) stays firm despite growing optimism over improving US-China relations. However, the ongoing tension between Trump and Powell continues to capture market attention.
In response to these developments, EUR/USD has stalled its previous rally. On the chart, the pair is forming a series of lower highs, moving within a narrowing wedge pattern. The 1.1600 level now emerges as the critical battleground between bulls and bears.
Do you think EUR/USD can successfully defend this support zone? Let us know your thoughts!
