BAAZAR STYLE RETAIL LTD - Breakout Alert!📈 Chart Overview:
The stock has broken out of a long-term descending trendline with strong volume confirmation.
RSI is approaching the overbought zone, indicating strong momentum.
🔍 Key Levels:
Resistance: ₹320, ₹400
Support: ₹260, ₹200
📊 Observations:
A trendline breakout with a 20% price surge signals bullish strength.
RSI breakout suggests a potential continuation, but caution is needed for overbought conditions.
🚀 Trading View:
If the price sustains above ₹320, it could move toward ₹400.
A pullback to ₹260 could provide a good re-entry opportunity.
📌 Disclaimer: This is for educational purposes only. Do your research before making any trades.
Breakout

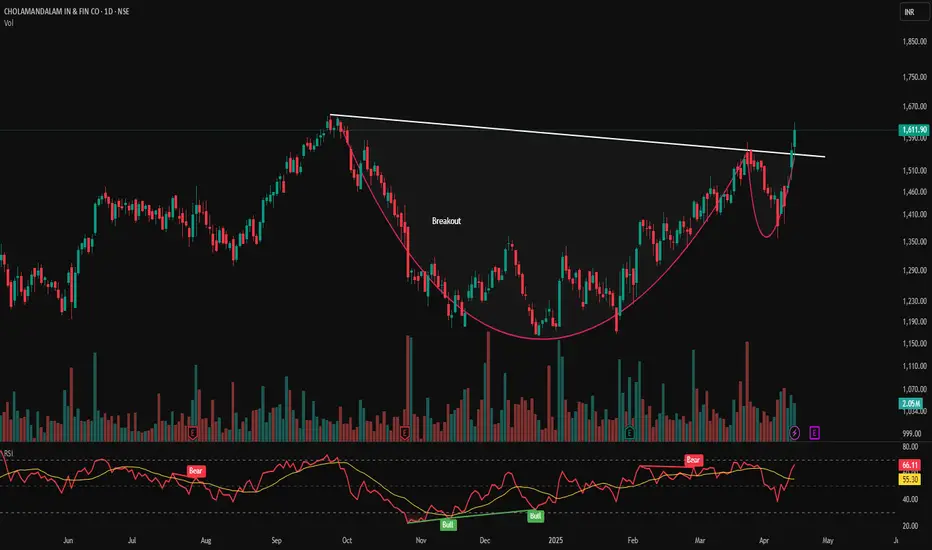
CHOLAFIN- Cup & Handle Breakout with Strong FundamentalsCHOLAFIN – Cup & Handle Breakout with Strong Fundamentals ☕📈
📅 Published on: April 17, 2025
📊 Technical Analysis:
CHOLAFIN has formed a classic Cup & Handle pattern on the daily chart, indicating a potential bullish continuation. The breakout above the neckline is accompanied by increased volume, suggesting strong buying interest.
Pattern: Cup & Handle
Neckline Breakout Level: ₹1,570
Current Price: ₹1,611.90 (+3.31%)
Volume: 2.05M—significant increase confirming breakout
Support & Resistance Levels:
Immediate Support: ₹1,570
Next Support: ₹1,500
Resistance Levels:
₹1,635
₹1,680
₹1,750
Indicators:
RSI: 66.11—approaching overbought territory, indicating strong momentum
MACD: Bullish crossover observed, supporting upward movement
🏢 Fundamental Analysis:
Cholamandalam Investment and Finance Company Ltd. is a leading NBFC in India, operating in vehicle finance, home loans, and corporate finance sectors.
Key Financial Metrics:
Market Cap: ₹1,20,302 Cr
PE Ratio: 29.60
PB Ratio: 5.62
ROE: 17.41%
ROCE: 11.23%
Dividend Yield: 0.14%
Recent Performance:
Net Profit Margin: 18.16%
Return on Assets: 2.18%
Asset Turnover Ratio: 0.14
The company has demonstrated consistent profit growth over the past five years, with a CAGR of 23.4%.
📌 Trade Strategy (For Educational Purposes):
Entry Point: ₹1,570–₹1,600 (on retest)
Stop Loss: ₹1,500
Target Levels:
₹1,635
₹1,680
₹1,750
📍 Visual Elements:
Cup & Handle pattern highlighted
Breakout point marked
Support and resistance levels indicated
Volume bars showing increased activity
RSI and MACD indicators displayed
🔔 Disclaimer: This analysis is for educational purposes only. Please conduct your own research or consult a financial advisor before making investment decisions.
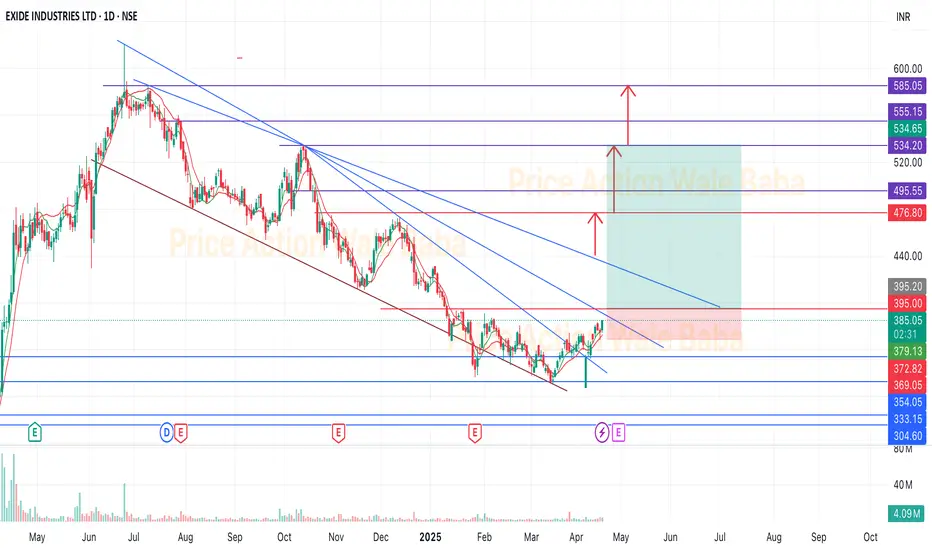
ExideExide near the breakout and looks. good for the up side.
This is bottom out stock and ready to go up.
It's time to buy and hold for the next 6-12 months to take ATH target.
EUR/USD Breaks 1.1500 — Bulls in Full ControlEUR/USD surged over 1% today as relentless U.S. dollar selling helped push the pair above the 1.1500 mark for the first time since November 2021. Growing concerns over a potential U.S. recession and questions around the Federal Reserve's independence continue to weigh heavily on the greenback, providing strong tailwinds for euro strength.
From a technical standpoint, key resistance and the previous consolidation range have been broken. EMA 34 and 89 continue to flash bullish reversal signals — favoring buy-side strategies moving forward.
The focus now is on buying the dips: look for entries when price breaks new highs and pulls back to key levels such as the previous breakout zone, solid
Wishing you a profitable and exciting trading week ahead! 💶📈

Breakout Momentum: GBP/USD Eyes 1.3500+Hey traders! Let’s break down the setup on GBP/USD for this week.
Today, the pair successfully broke above the 1.3290 resistance, completing a classic cup and handle pattern on the H4 chart. Now, price is approaching the key 1.3415 daily high — a historically strong resistance zone.
📌 Technical view: EMA34 and EMA89 are trending upward, clearly supporting the bullish momentum. If a pullback occurs, the 1.3290–1.3210 zone could offer a solid BUY opportunity.
📰 News to watch: All eyes are on Fed Chair Jerome Powell’s speech tonight. The market anticipates a dovish tone, especially with U.S. jobless claims data also being released. Signs of economic softness could strengthen the case for rate cuts — and that’s GBPUSD-friendly.
🎯 Suggested strategy: Wait for a reaction at the support zone before entering long. If 1.3415 breaks, we could see a push towards 1.3500+ in the midterm.
Let’s see how it plays out — trade safe and stay sharp!

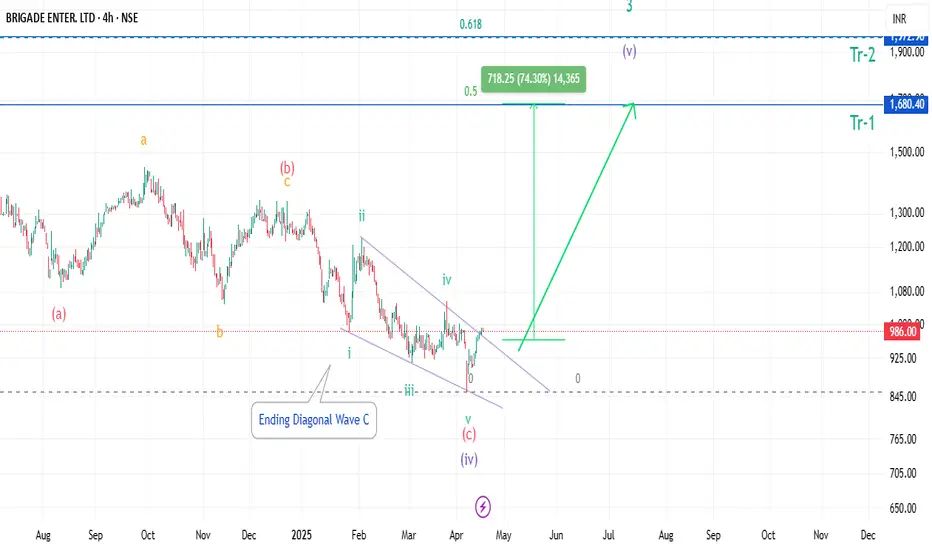
Brigade Ent falling wedge Breakout.Brigade Enterprises has made a falling wedge or ending Diagonal pattern, its near breakout. As per Elliott wave the Correction looks Complete, good for short-term Buy,
This Idea is shared purely on Technical basis,
Fundamental parameters are not considered,
take entry on your own risk.
Gold Is Back in the SpotlightGold has been drawing renewed attention lately, fueled by the weakening U.S. dollar — a consequence of increasingly erratic U.S. trade policies. While the dollar remains the world’s dominant reserve currency, more and more signs suggest that gold is quietly reclaiming its role as a reliable hedge in an uncertain global environment.
One of the biggest catalysts is China’s recent move allowing insurance companies to increase their allocation into gold. That decision alone could generate hundreds of tons in new annual demand — a game-changer in a market where global supply remains tight.
At the same time, major institutions like Citi, UBS, Goldman Sachs, and Bank of America have all raised their gold forecasts for 2025–2026. Some now see gold reaching as high as $3,500/ounce, signaling growing confidence that we’re entering a long-term bullish cycle — not just a short-term surge.
From my perspective, this isn’t just a reaction to news headlines. It feels like a deep, structural shift in how institutions are approaching gold. Last Wednesday’s $100 spike wasn’t random — it marked a clear surge in momentum and sentiment.
Looking ahead, we might see short-term pullbacks, but the overall trend remains unmistakably bullish. If gold does break into new territory in the coming quarters, this could be a crucial phase for planning, observing, and positioning smart Buy entries.

HIKAL LTD - Long-Term Cup & Handle Breakout | Weekly ChartHIKAL LTD - Long-Term Cup & Handle Breakout | Weekly Chart
🕒 Timeframe: 1W | NSE: HIKAL
📅 Date: April 18, 2025
💰 CMP: ₹431.60
📈 Volume: 4.57M
🔍 Chart Highlights
☕ Cup & Handle pattern forming over a multi-year base, suggesting a potential long-term breakout.
📏 Breakout Zone (Resistance):
🟪 ₹440–₹460 (purple zone) – Multiple rejections in the past. Price is now testing this major supply zone.
📉 Downtrend Resistance Line:
Price has broken above the falling trendline, confirming bullish strength.
🟩 Support Levels:
₹400 (recent breakout retest zone)
₹360 (previous structure low)
📈 Resistance Ahead:
₹470 (long wick area)
₹510 (supply zone)
🧠 Technical Indicators
📊 RSI (Relative Strength Index)
RSI at 61.63, approaching the bullish zone
RSI breakout above previous bearish structure
“Bull” and “Bear” labels show previous sentiment shifts
🔔 Conclusion
✅ A classic Cup & Handle breakout on weekly timeframe with strong volume surge
✅ Above key resistance with bullish RSI — suggests potential continuation
⚠️ Watch for sustained close above ₹460 for confirmation
🔍 Chart by: PriceAction_Pulse
📬 For more detailed insights, follow on TradingView
✅ Educational purpose only — DYOR before any investment decision.

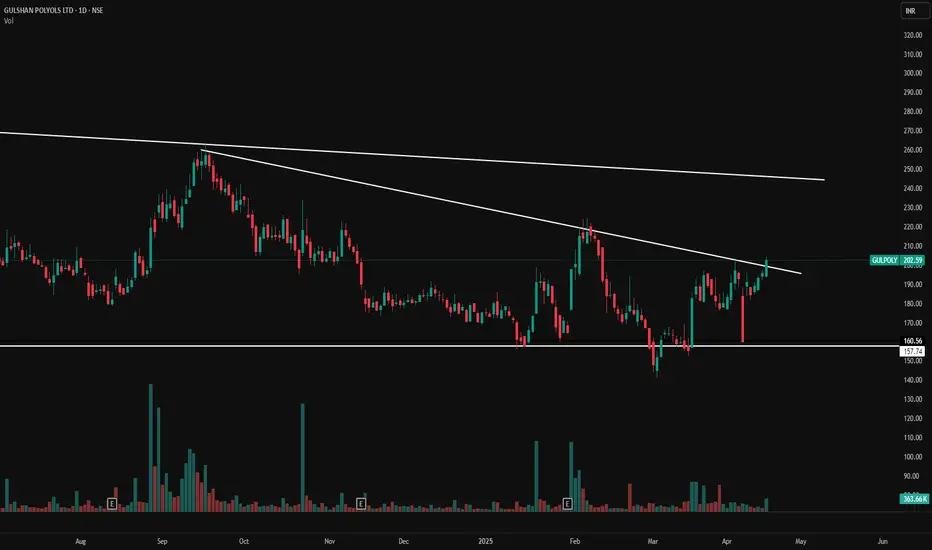
Gulshan Polyols Ltd - Downtrend Breakout Attempt!Want more such charts?
📬 Join our community — message us via profile bio link!
(Gulshan Polyols Ltd)
🗓️ Date: April 18, 2025
🔍 Technical Breakdown:
✅ Breakout in Progress
Stock has been respecting a descending trendline since August 2024.
Price is currently testing the trendline resistance, with today's candle showing a potential breakout.
Closing above this trendline will confirm breakout with short-term bullish bias.
🔄 Support & Resistance Levels
🧱 Support Zone: ₹157.74 – ₹160.56
📉 Resistance Trendline: Around ₹200 – ₹205 zone
📈 Next Resistance: ₹225, followed by ₹250
📊 Volume Analysis
A volume spike of 363.66K supports today’s breakout candle
Indicates strong interest and buying pressure building up near resistance
🧠 Interpretation:
This chart represents a classic trendline breakout structure:
Price forming higher lows
Buyers gradually absorbing selling pressure at resistance
Volume confirming strength
A daily close above ₹205 can be considered as breakout confirmation.
Targets post-breakout could range between ₹225 – ₹250 in coming sessions.
📌 Key Levels to Watch:
Support Zone: ₹157 – ₹160
Breakout Confirmation: Above ₹205
Upside Targets: ₹225 and ₹250
🏢 Company Fundamentals (Snapshot):
Sector: Chemicals & Ethanol
Specialty: Manufacturer of industrial chemicals, ethanol, and food-grade products
Growth Drivers:
Rising demand for ethanol blending in fuel
Diversified product portfolio
Government policy tailwinds on ethanol
⚠️ Disclaimer:
This analysis is for educational and informational purposes only. Please consult your financial advisor before making any trading decisions.
BTC: Quiet... but Ready to Explode?Bitcoin’s sideways grind has tested everyone’s patience — but don’t let the silence fool you. Tight consolidation like this often leads to powerful breakouts. And right now, BTC looks like it’s charging up.
📊 Technical Outlook:
BTC is sitting on strong support at 81K–83K, a level that’s sparked multiple rebounds before.
Price action has broken out of the downtrend channel and is now forming a classic accumulation box — textbook setup for an upside move.
EMAs (34 & 89) are tightening, signaling incoming volatility.
Breakout above resistance could open the door to 94K, a key untested zone.
🌐 Macro & Sentiment:
Big money is on standby after the recent crypto shakeout.
Spot Bitcoin ETFs are seeing renewed inflows after weeks of outflows.
With global interest rates cooling off, risk-on assets like BTC are back on the radar.
Trade Plan to Consider:
Look for long setups around 81K–83K support if strong bullish candles confirm
🎯 Targets: 87K → 94K
❌ Stop loss below 79K to protect your position
The breakout may not be loud — but it’s coming. The only question is… will you catch it?

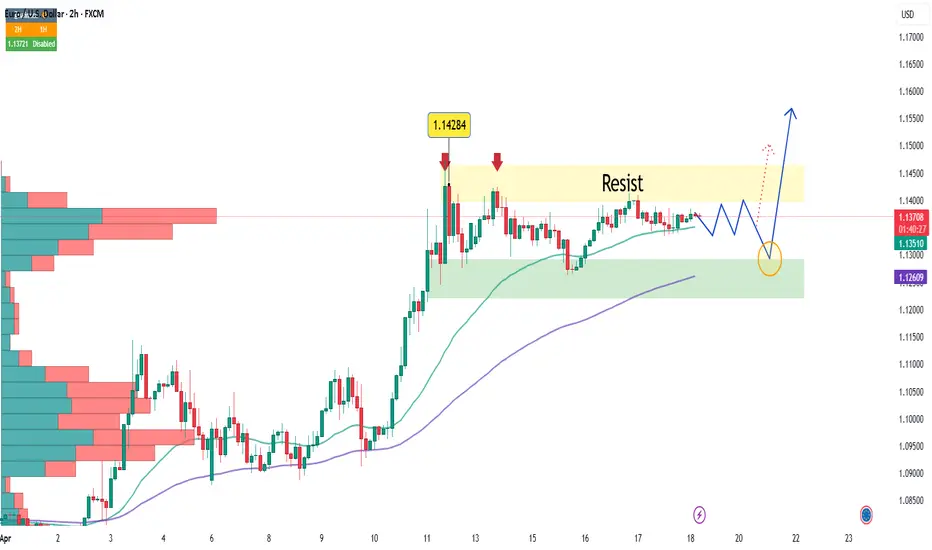
EUR/USD: Calm Before the Breakout?The EUR/USD pair is starting to attract buying interest as it edges closer to the 1.1370 level in early trading today. Ongoing concerns about the economic impact of trade tariffs continue to weigh on the U.S. dollar, giving the euro room to push higher and fueling bullish momentum for the pair.
While the uptrend remains intact, price action may stay muted today as the pair consolidates around the 34 EMA—a zone thatholiday-driven market slowdown.
The next key target lies near the 1.142 resistance zone, which could be tested early next week. A successful breakout above that level may pave the way for a fresh move toward new highs.
What’s your take? Is EUR/USD gearing up for a breakout or just catching its breath?
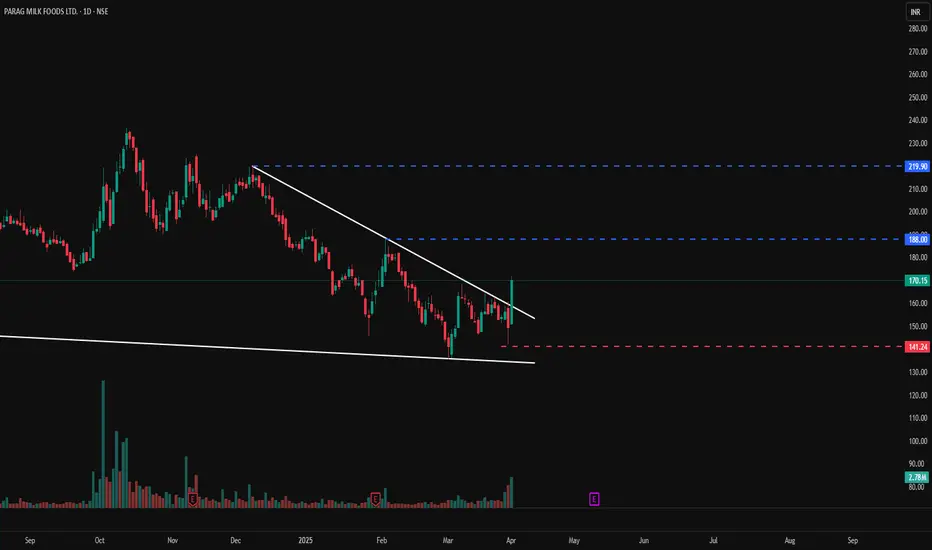
Parag Milk – Breakout**PARAGMILK:**
A one-day breakout has occurred, accompanied by a significant spike in volume.
Key Levels:
• Resistance: Trendline around ₹188.20 , ₹211.75
• Support: Horizontal support at ₹140
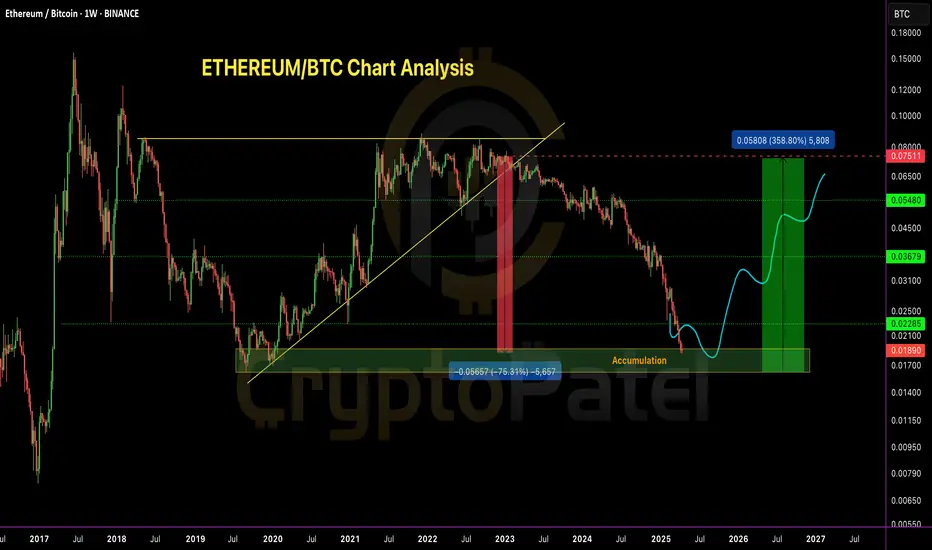
ETH/BTC Profit Update – As Predicted! ( 75% Down From Level )ETH/BTC Profit Update – As Predicted!
Many was Laughing But ETH/BTC is now down 75% from my previous exit call at 0.075 BTC — hope you enjoyed the ride and took profits when it mattered ✅
Current Price: ~0.019 BTC
We are now entering a strong accumulation zone between 0.019–0.015 BTC.
What to do now?
Start accumulating ETH slowly — build a position by buying dips to get a solid average entry for the next cycle.
Bull Market Targets: 0.05 BTC/0.07 BTC/0.09 BTC
Pro tip : Keep these Targets in mind not just for ETH/BTC… but also to plan exits on ETH/USDT during altseason!
This zone could be a game-changer. Act smart. Accumulate patiently.
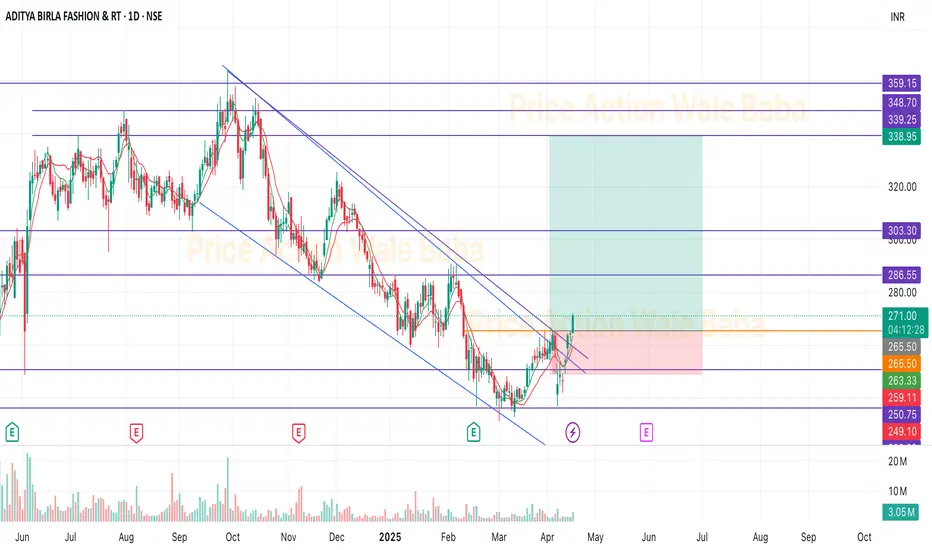
ABFRL - BreakoutABFRL have breakout and ready to move up.
Stock was trading in the bullish flag and it has given the breakout.
Initial target is 285, once sustain above this we can see 340-360+++.
Good to hold for the long term.
Prepping for a Breakout: April 17 Trading OpportunityIn this video, I break down a potential breakout setup forming through a classic VCP (Volatility Contraction Pattern) on the Daily Timeframe (DTF). Watch as I highlight key contraction points, volume behavior, and breakout zones to keep an eye on for April 17. Ideal for swing traders looking to catch early moves with strong risk-reward setups!

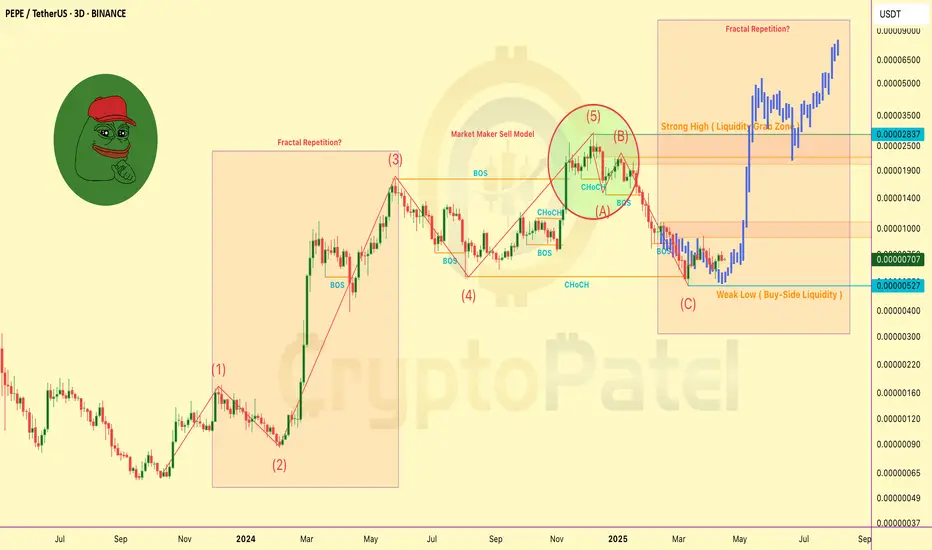
PEPE/USDT – 3D Chart Technical Breakdown (April 2025)PEPE/USDT – 3D Chart Technical Breakdown (April 2025)
Based on SMC, ICT, Elliott Wave, and Fractal Analysis
Major Structure Insights:
▪️ PEPE completed a 5-wave Elliott impulsive rally followed by an ABC corrective wave.
▪️ Wave C swept the buy-side liquidity near 0.00000527, triggering potential reversal.
▪️ Recent CHoCH and BOS suggest a trend shift back to bullish.
Fractal Repetition Detected!
▪️ Previous bullish pattern is repeating – similar structure and accumulation signs.
▪️ Market Maker Sell Model played out perfectly at the top before correction began.
Key Liquidity Zones:
🔵 Weak Low: 0.00000527 (swept)
🟠 Strong High: 0.00002837 (targeted)
▪️ Intermediate Levels: 0.00001000, 0.00001900, 0.00002837
▪️ Final Expansion Projection: 0.000065–0.000090
Smart Money Concepts Confirmed:
▪️ Liquidity engineered and swept at lows
▪️ Institutional entry signs after BOS
▪️ Fractal structure supports a bullish continuation phase
Outlook:
If structure holds and price continues above 0.00000600, next leg toward 0.000019–0.00002837 could be explosive.
Below 0.00000500 = Invalidation zone.
Note: This is a technical viewpoint for educational purposes.
DYOR – Not Financial Advice.
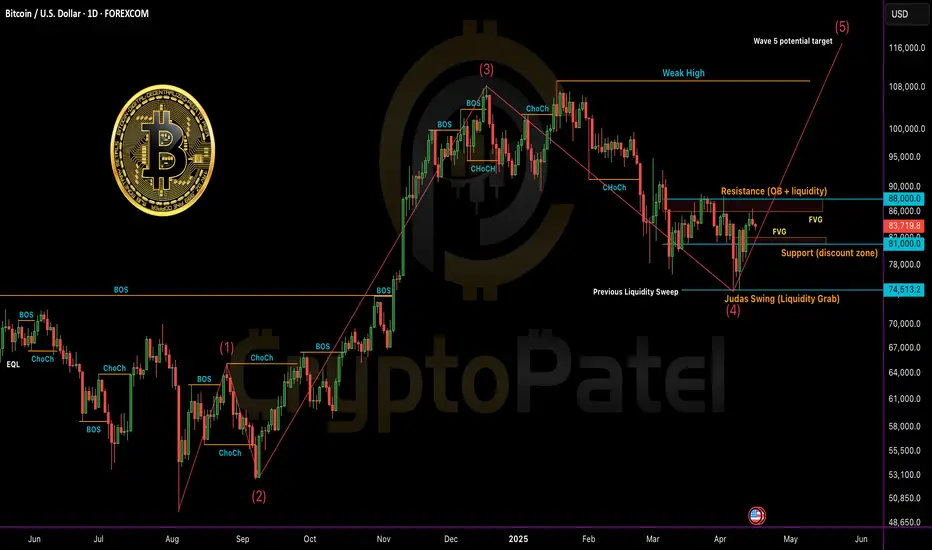
Bitcoin (BTC/USDT) – Full Technical Breakdown - Timeframe: 1DBitcoin (BTC/USDT) – Full Technical Breakdown - Timeframe: 1D
Market Structure & SMC (Smart Money Concepts)
✅ CHoCH (Change of Character) confirmed from $105K top → current lower high around FWB:88K zone.
📉 Break of Structure (BOS) to the downside occurred at $91K.
🟠 Bearish Order Block (OB): $86K– FWB:88K (price currently reacting here).
Liquidity Levels:
Sell-side: Swept at $76K
Buy-side: Sitting above FWB:88K
Fair Value Gap (FVG): Unfilled zone between $81K– GETTEX:82K may act as magnet for price.
ICT Model Alignment
Judas Swing: Sharp liquidity grab below $76K → followed by rebound — classic manipulation before real move.
PD Array Setup:
Resistance: FWB:88K (bearish OB + buy-side liquidity)
Support: $81K (discount zone + FVG)
Elliott Wave Outlook
Wave 1: July–Sept 2024
Wave 3: Nov–Feb rally to $105K (extended wave)
Wave 4: Correction to $76K likely complete
Wave 5 Target: Potential $115K+ if structure holds
Fractal Observation
🔹 Current price structure is mimicking Nov 2023–Jan 2024 pattern
🔹 If history rhymes: consolidation → breakout → retest → parabolic rally
Key Levels to Watch
🔼 Bullish Confirmation: Daily close above FWB:88K → targeting GETTEX:92K –$100K
🔽 Bearish Rejection: Drop below $81K → next support at $74K–$76K
Strategy Summary
🔹 Short-Term Bias: Cautiously Bullish
🔹 Entry Zone: Retest near GETTEX:82K (FVG + OB)
🔹 SL: Below $79.5K
🔹 TP Zones: FWB:88K → GETTEX:92K → GETTEX:98K
📈 R:R = Minimum 1:5 (High confluence)
Keep your eyes on HTF closures and manage risk. Liquidity traps are in play.
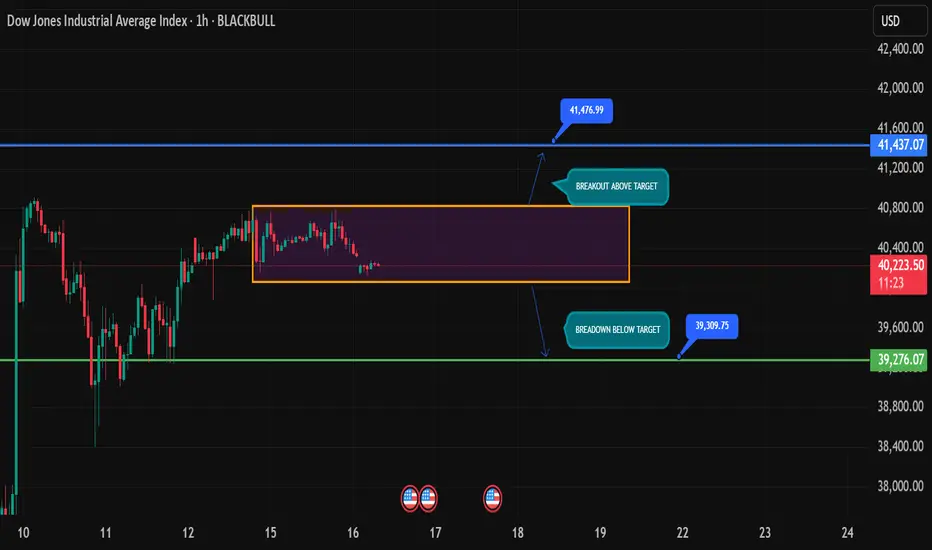
US30 Locked in Tight Range — Breakout ImminentDow Jones (US30) is currently trapped inside a tight consolidation box between ~40,400 and ~40,200. Price action has been flat for hours with no strong directional bias, hinting at an upcoming breakout move. Traders should stay alert for volatility spikes.
🔼 Breakout above the range opens up targets toward 41,437 and 41,476
🔽 Breakdown below the support could push price down to 39,309 or even test the key zone near 39,276
With key U.S. data around the corner (noted on the chart), the move could be news-driven. Stay reactive and don’t pre-empt the breakout. Let price lead.
Plan the breakout. Don’t get trapped in the chop. ✅
Will Bitcoin Test $65000 level soon ?🚨 #BTC/USDT SMC Update and Fresh Analysis 🚨
Our previous short setup played out perfectly with a solid -21% move from the $94,000 region, catching the local top and dumping all the way to $75,000.
What’s next?
From a Smart Money Concepts (SMC) perspective, current PA suggests another local top might be in.
🔹 Bearish Order Block just got tapped
🔹 Strong Resistance seen near the $86,000 level
🔹 Price forming LL (Lower Low) and LH (Lower High) structure
If this setup plays again, we may see a new low below $75,000.
Key Level to Watch:
If a HTF candle closes above $88,200, the short thesis is invalidated — and in that case, we may be looking at a bullish continuation toward the $100,000 zone.
Reminder:
Don’t enter blindly. Wait for confirmations and respect risk management—protect your capital at all costs.

HCG: supply zone breakout➡️Volatility contraction pattern
➡️supply zone #breakout
➡️SL below breakout candle
➡️Increasing cash from operations
➡️capital expansion
➡️reducing retail shareholding
Cons:
➡️Receivables beyond 6 months
➡️profits are down despite increased sales

#HCG - VCP Break Out in Daily Time Frame📊 Script: HCG
Key highlights: 💡⚡
📈 VCP Break Out in Daily Time Frame.
📈 Okish Price consolidation near Resistance.
📈 BO with Volume spike.
📈 MACD Bounce
📈 RS making 52WH
📈 One can go for Swing Trade.
BUY ONLY ABOVE 570 DCB
⏱️ C.M.P 📑💰- 574
🟢 Target 🎯🏆 – NA%
⚠️ Stoploss ☠️🚫 – NA%
️⚠️ Important: Market conditions are bad, Position size 20% per Trade. Protect Capital Always
⚠️ Important: Always Exit the trade before any Event.
⚠️ Important: Always maintain your Risk:Reward Ratio as 1:2, with this RR, you only need a 33% win rate to Breakeven.
✅Like and follow to never miss a new idea!✅
Disclaimer: I am not SEBI Registered Advisor. My posts are purely for training and educational purposes.
Eat🍜 Sleep😴 TradingView📈 Repeat 🔁
Happy learning with MMT. Cheers!🥂

GMR AIRPORTS LTD - Cup & Handle Breakout! 📈 Chart Overview:
The stock has formed a Cup & Handle pattern, confirming a bullish breakout.
A downtrend resistance has been breached, signaling strong buying interest.
🔍 Key Levels:
Resistance Levels: ₹87.19, ₹90.78, ₹90.86
Support Levels: ₹79.05, ₹75.10, ₹74.96
📊 Observations:
Volume spike supports the breakout, increasing reliability.
RSI at 74.40 indicates overbought conditions, so a slight pullback before further upside is possible.
The risk-reward ratio is favorable, with defined stop-loss and targets.
🚀 Trading View:
If the price sustains above ₹79.05, it can move towards ₹87-₹91 levels.
A retest of the breakout level (₹79) could provide a buying opportunity.
📌 Disclaimer: This is for educational purposes only. Always do your research before making investment decisions.

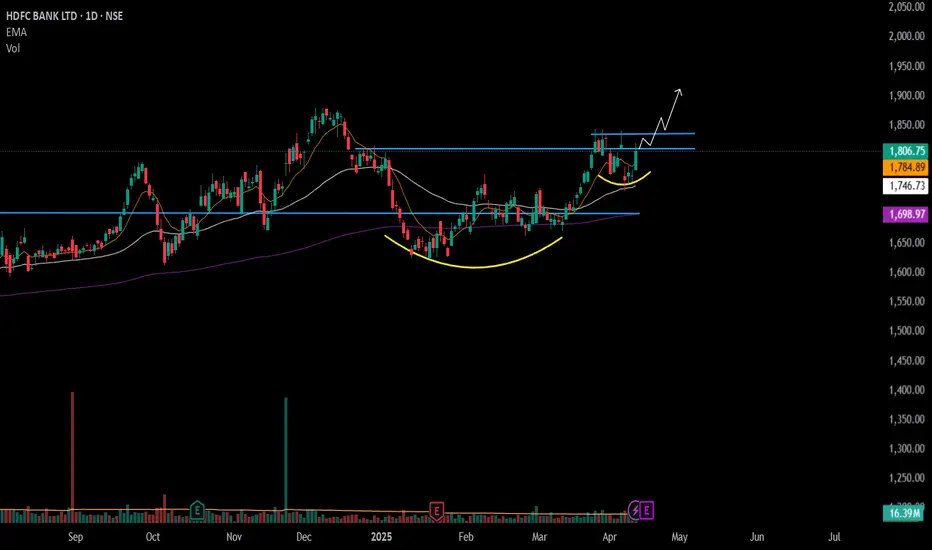
#HDFCBANK - Potential Breakout / Keep in WL 📊 Script: HDFCBANK
Key highlights: 💡⚡
📈 Cup & Handel Break Out in Daily Time Frame.
📈 Price consolidation near Resistance
📈 Enter only if Volume spike is seen.
📈 One can go for Swing Trade.
BUY ONLY ABOVE 1838 DCB
⏱️ C.M.P 📑💰- 1806
🟢 Target 🎯🏆 – NA%
⚠️ Stoploss ☠️🚫 – NA%
️⚠️ Important: Market conditions are bad, Position size 20% per Trade. Protect Capital Always
⚠️ Important: Always Exit the trade before any Event.
⚠️ Important: Always maintain your Risk:Reward Ratio as 1:2, with this RR, you only need a 33% win rate to Breakeven.
✅Like and follow to never miss a new idea!✅
Disclaimer: I am not SEBI Registered Advisor. My posts are purely for training and educational purposes.
Eat🍜 Sleep😴 TradingView📈 Repeat 🔁
Happy learning with MMT. Cheers!🥂