Graphite India - Triangle PatternGraphite India looks good above 645 to buy and hold for the long time.
Targets are 715-815-940.
Buy and accumulate for long time, buy on every dips.
Company doing good work and giving better profit.
Breakout

Piramal Enterprises – Swing Trade Idea🟢 Trade Setup (Swing)
Buy Zone:
➡️ Near ₹1640 (support + demand area)
Targets:
🎯 T1: ₹1783
🎯 T2: ₹1840
Stop Loss:
⛔ ₹1600
🔍 Technical Reasons
Price respecting 20 & 50 EMA
Recent pullback with low selling volume
RSI holding above 50 → strength intact
Previous resistance now acting as support
Risk–Reward ≈ 1:4

Gold (XAUUSD) – 4H Chart Update | Breakout → Pullback Phase!Hello Everyone,, i hope you all will be doing good, let's check the updates of Gold as it has already done the hard part, the breakout above the previous resistance is in place. After the breakout, price pushed higher and is now doing what strong markets usually do: a pullback.
This pullback is not a sign of weakness yet. In fact, it is a healthy reaction, where the market is testing whether the old resistance can act as new support. This phase decides continuation or failure.
As long as Gold holds above the marked support zone, the structure remains positive, and continuation toward higher levels stays open. What we want to see here is price stabilizing, not panic selling.
If support fails and price starts accepting below it, then the breakout thesis weakens. Until that happens, this move should be treated as a normal post-breakout retest.
Key Levels to Watch
Breakout Level / New Support: Around 4330–4340
Immediate Support Zone: Pullback base area
Upside Continuation: Possible if support holds
Bias: Neutral-to-Bullish above support
Well Guys Most traders get confused during pullbacks. Strong moves rarely go straight up, continuation usually comes after patience, not after chasing candles.
Disclaimer: This analysis is for educational purposes only and should not be taken as financial advice. Please do your own research or consult your financial advisor before investing.
Give likes and comment your thought on my analysis, thankyou everyone!

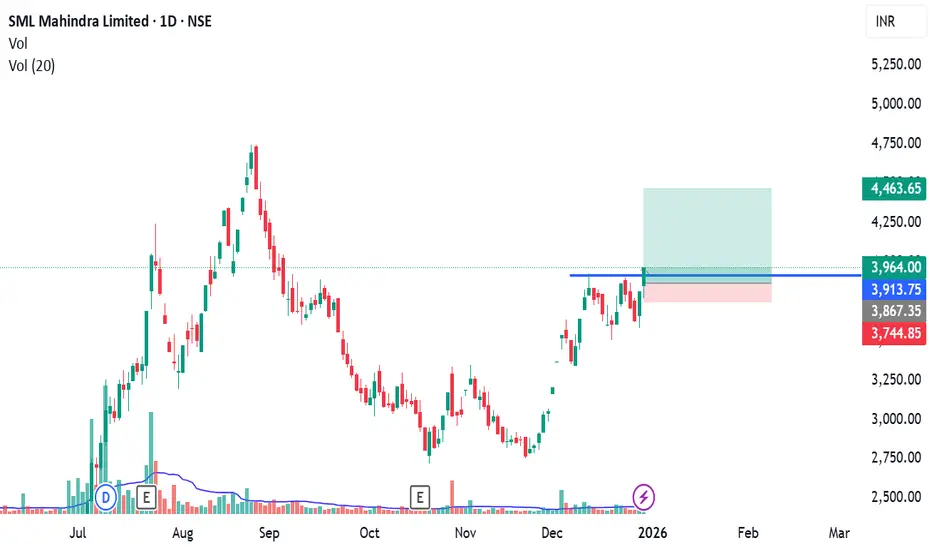
SMLMAH TRADE | SWING SETUPTrade Type: Swing Trade
Time Frame: Short–Medium Term
Bias: Bullish
Trend: Uptrend continuation
KPI Strength Factors ✅
🔹 Price above key EMAs (20/50/100) → bullish structure intact
🔹 Higher high–higher low formation → trend continuation
🔹 Strong bullish candle with good close → buyer control
🔹 Volume expansion on upside → confirmation of strength
🔹 Holding above breakout / demand zone → no distribution signs
Swing Trade Plan:
Buy Zone: Near current levels / minor pullbacks
Targets:
🎯 T1: Previous swing high
🎯 T2: Next resistance zone (positional extension)
Stop Loss: Below recent swing low / demand zone
Swing View:
As long as price holds above the breakout base, SMLMAH is likely to continue its upward move with higher targets in the coming sessions.
For AU Small Finance Bank (AUBANK), the technical setup as of DeFor AU Small Finance Bank (AUBANK), the technical setup as of December 30, 2025, shows the stock is testing a critical psychological and technical resistance zone. The price is hovering near its 52-week highs, suggesting a "buy on breakout" or "buy on dips" strategy.
Technical Snapshot
• Current Price: ~₹975 – ₹986
• Trend: Bullish (Trading above short-term and long-term moving averages)
• RSI: Entering the overbought zone but showing room for a final leg up toward the ₹1,000 mark.
• Key Resistance: ₹985 (Immediate) | ₹1,007 (52-week High)
• Key Support: ₹965 – ₹970 (Strong immediate base) | ₹945 (Major Support)

BUY TODAY SELL TOMORROW for 5%DON’T HAVE TIME TO MANAGE YOUR TRADES?
- Take BTST trades at 3:25 pm every day
- Try to exit by taking 4-7% profit of each trade
- SL can also be maintained as closing below the low of the breakout candle
Now, why do I prefer BTST over swing trades? The primary reason is that I have observed that 90% of the stocks give most of the movement in just 1-2 days and the rest of the time they either consolidate or fall
Resistance Breakout in SASKEN
BUY TODAY SELL TOMORROW for 5%

Bitcoin Is Quiet Again — That’s Usually When Big Moves BeginBitcoin spent multiple sessions moving sideways inside a clearly defined accumulation range.
This kind of price behavior usually signals one thing, strong hands are building positions while weak hands get shaken out.
Sideways markets are not random. They are preparation phases.
Price remained compressed inside the accumulation zone, showing balance between buyers and sellers with declining volatility.
The breakout candle was decisive and impulsive, indicating acceptance above the range rather than a fake move.
After breakout, price pulled back into the prior range high, which is a classic bullish retest behavior.
As long as price holds above the breakout base, the structure favors continuation toward the expansion zone marked on the chart.
A failure back inside the range, would invalidate the breakout and shift momentum back to neutral.
If this helped you read price better, like, follow, or comment, more clean structure studies coming.
⚠️ DISCLAIMER: This analysis is for educational purposes only and is not financial advice. Markets involve risk. Always manage your position size and do your own analysis.

Is $MONAD Bullish? Technical Structure Suggests 10x PotentialPrice is Consolidating in a range-bound Structure Between Well-Defined Support and Resistance, indicating active Accumulation.
🟦 Demand Zone: $0.020–$0.022
🟥 Supply Zone: $0.025–$0.027
A Confirmed Breakout and close above Resistance Would signal a Bullish Structure Shift and Continuation of the Uptrend.
Trend Remains Bullish above $0.016, the recent swing low. A breakdown below invalidates the setup.
Based on Structure and Expansion Potential, 10x Upside is possible in a Strong Altseason.
Volatility remains High, Risk Management is Mandatory.
NFA & DYOR

BUY TODAY SELL TOMORROW for 5%DON’T HAVE TIME TO MANAGE YOUR TRADES?
- Take BTST trades at 3:25 pm every day
- Try to exit by taking 4-7% profit of each trade
- SL can also be maintained as closing below the low of the breakout candle
Now, why do I prefer BTST over swing trades? The primary reason is that I have observed that 90% of the stocks give most of the movement in just 1-2 days and the rest of the time they either consolidate or fall
Resistance Breakout in HINDZINC
BUY TODAY SELL TOMORROW for 5%

BUY TODAY SELL TOMORROW for 5%DON’T HAVE TIME TO MANAGE YOUR TRADES?
- Take BTST trades at 3:25 pm every day
- Try to exit by taking 4-7% profit of each trade
- SL can also be maintained as closing below the low of the breakout candle
Now, why do I prefer BTST over swing trades? The primary reason is that I have observed that 90% of the stocks give most of the movement in just 1-2 days and the rest of the time they either consolidate or fall
Cup & Handle Breakout in INFOBEAN
BUY TODAY SELL TOMORROW for 5%

BUY TODAY SELL TOMORROW for 5%DON’T HAVE TIME TO MANAGE YOUR TRADES?
- Take BTST trades at 3:25 pm every day
- Try to exit by taking 4-7% profit of each trade
- SL can also be maintained as closing below the low of the breakout candle
Now, why do I prefer BTST over swing trades? The primary reason is that I have observed that 90% of the stocks give most of the movement in just 1-2 days and the rest of the time they either consolidate or fall
Trendline Breakout in ASHAPURMIN
BUY TODAY SELL TOMORROW for 5%

Vishnu Chemicals: Bullish - long consolidation breakout at 575Vishnu Chemicals: CMP 547.95
Trend: Bullish - long consolidation breakout levels.
Resistance: 560/575/638/755
Support: 531/512/500
Sustained breakout above 560-575 levels supported with volumes can give a up move.

BUY TODAY SELL TOMORROW for 5% - BTST STOCK OPTIONDON’T HAVE TIME TO MANAGE YOUR TRADES?
- Take BTST Stock Option trades at 3:25 pm every day
- Try to exit by taking 4-7% profit of each trade
- Head & Shoulder Breakout in IIFL
BUY TODAY, SELL TOMORROW for 5%
I

BUY TODAY SELL TOMORROW for 5%DON’T HAVE TIME TO MANAGE YOUR TRADES?
- Take BTST trades at 3:25 pm every day
- Try to exit by taking 4-7% profit of each trade
- SL can also be maintained as closing below the low of the breakout candle
Now, why do I prefer BTST over swing trades? The primary reason is that I have observed that 90% of the stocks give most of the movement in just 1-2 days and the rest of the time they either consolidate or fall
Cup & Handle Breakout in ASIAN TILES
BUY TODAY SELL TOMORROW for 5%

BUY TODAY SELL TOMORROW for 5%DON’T HAVE TIME TO MANAGE YOUR TRADES?
- Take BTST trades at 3:25 pm every day
- Try to exit by taking 4-7% profit of each trade
- SL can also be maintained as closing below the low of the breakout candle
Now, why do I prefer BTST over swing trades? The primary reason is that I have observed that 90% of the stocks give most of the movement in just 1-2 days and the rest of the time they either consolidate or fall
Cup & Handle Breakout in KPL
BUY TODAY SELL TOMORROW for 5%

Decoding Weekly Structure: Support, Resistance & Channel DynamicSummary -
This multi-window TradingView chart showcases a weekly time frame on the left, featuring a white counter line, a dotted hidden resistance line, and a monthly support/resistance zone highlighted in white on the right. Additionally, a pink parallel channel marks head and resistance zones, offering a visual guide to price structure without forecasting future movement. Each element helps identify historical areas where price has shown significant reactions.
Terms and Language explained -
Counter Line (White): A horizontal line used to mark a specific price level, often for tracking key reference points or psychological levels.
Hidden Resistance (Dotted Line): A resistance line that is not immediately obvious but is derived from less visible price action or volume analysis. It helps identify potential areas where price may struggle to move higher.
Monthly Support/Resistance Zone: A broader area on the chart where price has historically found support (demand) or resistance (supply) over the monthly time frame. These zones are often marked for their significance in longer-term analysis
Parallel Channel: A set of parallel lines drawn to connect consecutive highs and lows, forming a channel that helps visualize the current price trend and boundaries.
Disclaimer
The information presented in this chart is for educational purposes only. No part of this post constitutes financial advice, a recommendation, or a forecast of future price movement. Always conduct your own research and consult a qualified financial advisor before making any trading decisions.

Price action understanding that will change the way you tradeI make educational content videos for swing trading . In this video I have used concepts like Trendlines, Counter trendlines, zones, Support and Resistance, Market fall, Targets and Exit plan for any trade setup and most importantly use of lines with multi time frame analysis .
Charts used are 3 months or older

#JKTYRE - Cup & Handle / IHNS BO in DTFScript: JKTYRE
Key highlights: 💡⚡
📈 Cup & Handle / IHNS BO in DTF
📈 Volume spike seen during Breakout
📈 MACD Bounce
📈 RS Line making 52WH
✅Boost and follow to never miss a new idea! ✅
⚠️ Important: Always Exit the trade before any Event.
⚠️ Important: Always maintain your Risk:Reward Ratio as 1:2, with this RR, you only need a 33% win rate to Breakeven.
⚠️Disclaimer: I am not SEBI Registered Advisor. My posts are purely for training and educational purposes.
Eat🍜 Sleep😴 TradingView📈 Repeat 🔁

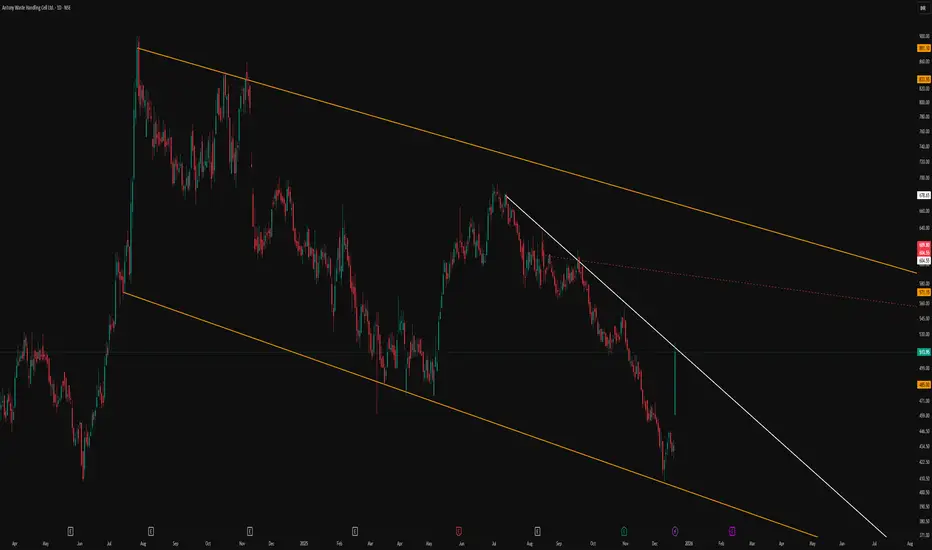
Classic Descending Channel With Clear Structural LevelsThe primary feature of this chart is the broad descending parallel channel marked by the orange lines, which frames the entire corrective phase in a neat, orderly manner. Price has repeatedly respected both the upper and lower boundaries, reinforcing the relevance of this channel as a dominant structure.
A trend‑changing resistance line is drawn in white, connecting swing highs and visually separating the prevailing downtrend from any potential shift in behavior. This line serves as a clear reference for how price has reacted to supply zones within the channel, without implying any future breakout or directional bias.
The red dotted line acts as an internal, hidden line derived from prior price interaction, helping to map out the internal rhythm of the move. Overall, the chart is intended purely as a structural illustration of how price respects channels and internal reference lines, without any forecast or trade signal.
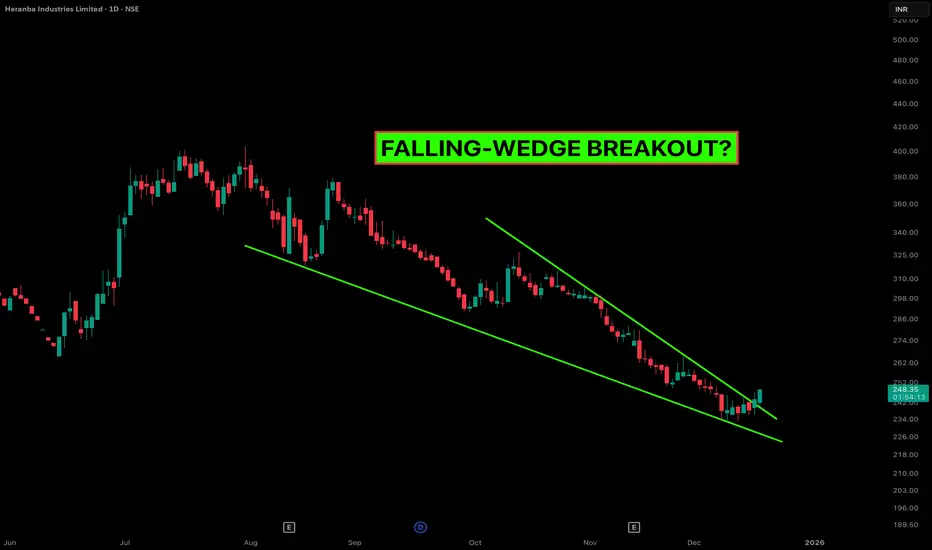
Heranba Industries: Why Falling Wedges Often Mark the BottomThe Setup Heranba Industries (NSE: HERANBA) has been in a corrective phase for months, but the structure has now matured into a classic Falling Wedge Pattern on the Daily timeframe.
For those new to this pattern: A Falling Wedge is a bullish reversal pattern. It is characterized by "Lower Highs" and "Lower Lows" contracting into a narrower range. This contraction signals that selling pressure is exhausting and buyers are stepping in at higher relative lows.
Technical Breakdown:
Price Action: The price has respected the upper trendline resistance multiple times. The recent breakout candle suggests a shift in momentum.
The Psychology: Notice how the selling waves are getting shorter? This "compression" usually precedes an expansion in volatility (the breakout).
Volume Profile: We are looking for a spike in volume to confirm the breakout validity. A low-volume breakout is often a trap, so watch the close.
Trade Management (Educational View):
Aggressive Entry: On the immediate break of the upper trendline (Current Levels: ~247-248).
Conservative Entry: Waiting for a "Retest" of the trendline around 240-242 to confirm support.
Stop Loss: Strictly below the recent swing low (invalidate the pattern if price falls back into the wedge).
Targets: The theoretical target of a wedge is often the top of the wedge structure (the origin of the pattern).
Risological Note: We track these compression patterns because they offer high Risk-to-Reward ratios. We are not predicting the future; we are reacting to probability.
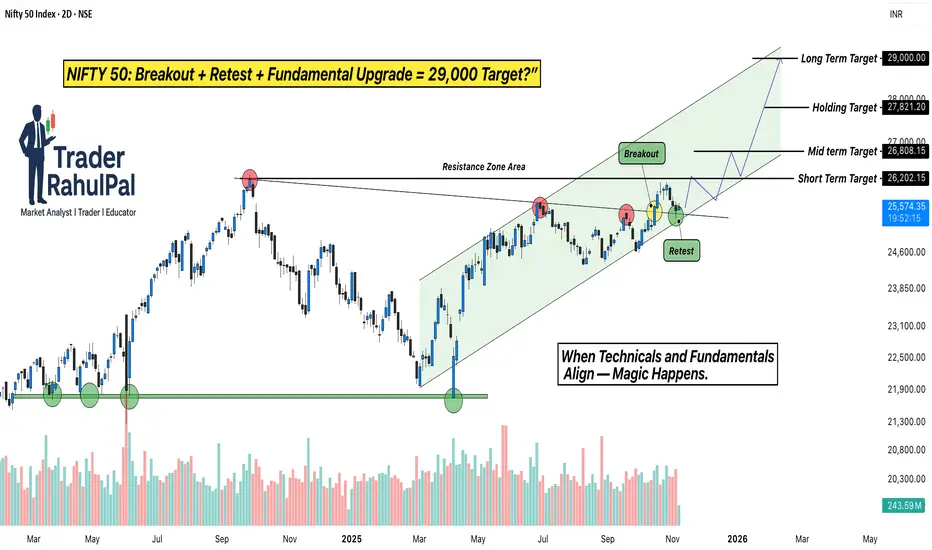
NIFTY Breakout + Goldman Sachs Upgrade = 29,000 Target?Hello Traders!
Today’s analysis is on NIFTY 50 Index, which has recently given a strong Breakout and Retest setup after months of consolidation. The index broke out from its Resistance Zone , retested the breakout area perfectly, and is now holding firmly inside a rising Trend Channel .
This move is not just technical, it’s being backed by major institutional optimism. According to a recent Goldman Sachs report , India’s stock market has been upgraded to “Overweight”, with NIFTY 50 projected to reach 29,000 by 2026 .
Why this setup is special?
Perfect breakout and retest structure with strong volume confirmation.
Channel trend remains intact, showing controlled accumulation at higher levels.
Institutional support from Goldman Sachs aligns with the technical breakout, adding conviction to the rally.
Levels to Track:
NIFTY is holding above the breakout zone near 25,000 , with immediate support seen at 24,600 . As long as the index sustains above this level, the short-term upside remains open toward 26,800 , followed by the next leg around 29,000 , matching Goldman Sachs’ longterm projection.
Rahul’s Tip:
When technicals and fundamentals align, the results are often explosive. A clean retest like this, supported by global institutional confidence, can lead to a powerful trend extension. Traders who position early usually ride the strongest part of the move.
(Analysis By @TraderRahulPal | More analysis & educational content on my profile. If this helped you, don’t forget to like and follow for regular updates.)
Disclaimer:
This analysis is for educational purposes only and should not be taken as financial advice. Please do your own research or consult your financial advisor before investing.
BUY TODAY SELL TOMORROW for 5%DON’T HAVE TIME TO MANAGE YOUR TRADES?
- Take BTST trades at 3:25 pm every day
- Try to exit by taking 4-7% profit of each trade
- SL can also be maintained as closing below the low of the breakout candle
Now, why do I prefer BTST over swing trades? The primary reason is that I have observed that 90% of the stocks give most of the movement in just 1-2 days and the rest of the time they either consolidate or fall
Cup & Handle Breakout in RAMCOSYS
BUY TODAY SELL TOMORROW for 5%

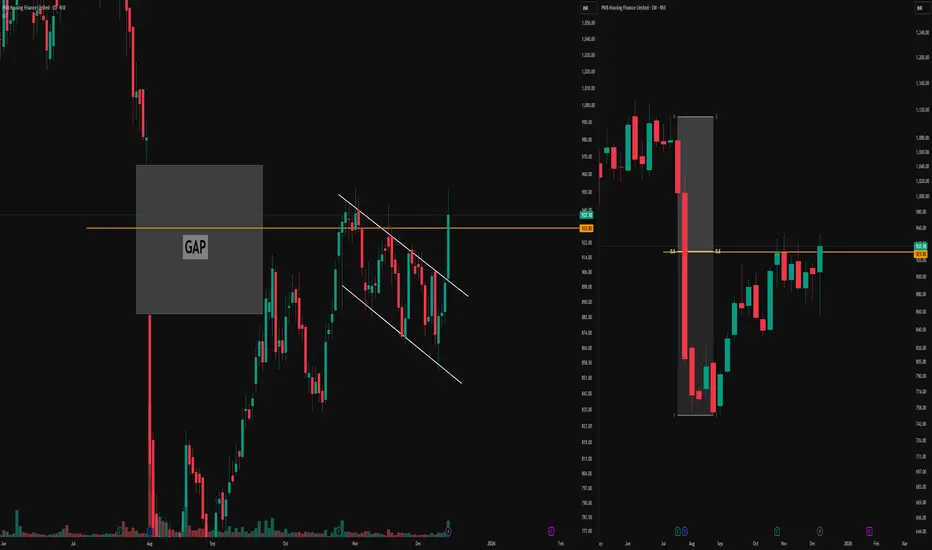
Parallel Channel, Stubborn Gap & 0.5 Equilibrium RejectionDaily Timeframe Details
The left chart on the daily timeframe displays a parallel channel structure forming after an initial one-sided move.
A significant gap emerged within this leg, which price has approached multiple times—first entering the gap area from below but rejecting sharply to form a higher low, then pushing toward a higher high without fully filling it.
This illustrates how gaps often resist easy fills from either direction, acting as persistent reference zones that demand confluence for interaction.
Weekly Timeframe Context
The right chart provides the weekly timeframe for the same instrument, highlighting repeated rejections at the 0.5 equilibrium level.
These weekly rejections align precisely with the daily gap interactions and channel boundaries, demonstrating how higher-timeframe equilibrium can underpin lower-timeframe price behavior without implying direction.
Such multi-timeframe alignment offers educational insight into structural references in market analysis.
This post serves purely educational and observational purposes and does not constitute buy, sell, or investment advice. Always conduct your own research.