BUY TODAY SELL TOMORROW for 5%DON’T HAVE TIME TO MANAGE YOUR TRADES?
- Take BTST trades at 3:25 pm every day
- Try to exit by taking 4-7% profit of each trade
- SL can also be maintained as closing below the low of the breakout candle
Now, why do I prefer BTST over swing trades? The primary reason is that I have observed that 90% of the stocks give most of the movement in just 1-2 days and the rest of the time they either consolidate or fall
Round Bottom Breakout in WINDLAS
BUY TODAY SELL TOMORROW for 5%
Breakoutsignal
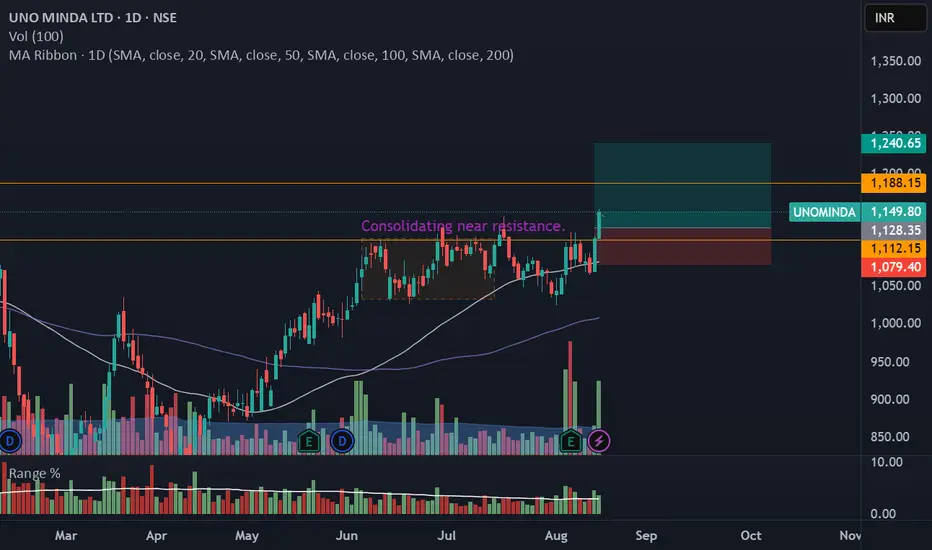
UNOMINDA – Daily Timeframe Breakout Idea (Resistance Zone Break)UNO MINDA LTD. has shown a breakout above a key horizontal resistance level on the daily chart, accompanied by a nearly 1.5 times volume surge near the breakout, as seen earlier, supported by strong momentum.
🔍 Breakout Context:
- Price broke above the ~₹1110 and 1120 horizontal resistance, which had held for over 6 months.
- Breakout supported by more than average volume and just above average range near the resistance zone.
- The price is also trading above both the 50- and 100-day SMAs, indicating strong trend continuation.
- This aligns with a bullish continuation setup.
📉 Trade Plan:
- CMP: ₹1149
- Entry: Near ₹1128
- Target: ₹1240 (~10% upside from CMP)
- Stop-Loss: ₹1079 (Closing Candle)
- Risk-Reward Ratio: ~1 : 2.2
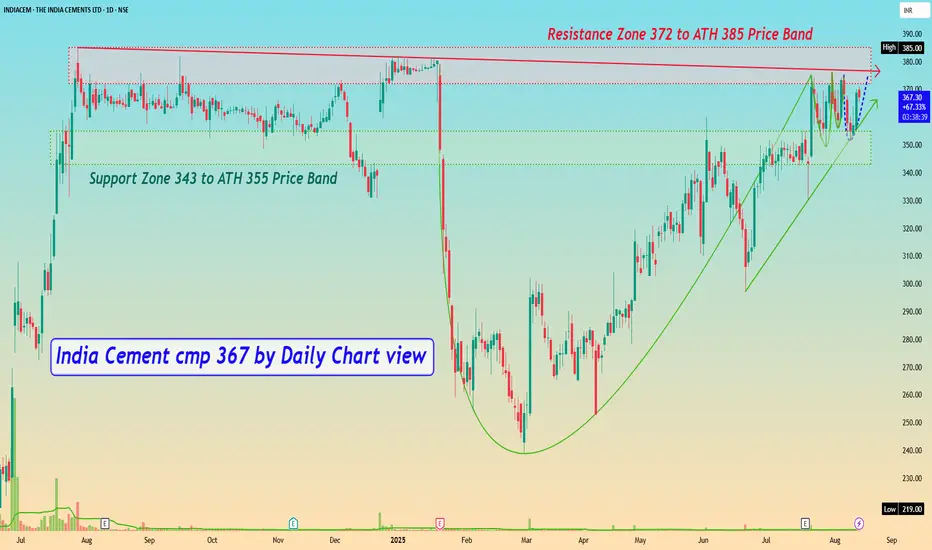
India Cement cmp 367 by Daily Chart viewIndia Cement cmp 367 by Daily Chart view
- Support Zone 343 to ATH 355 Price Band
- Resistance Zone 372 to ATH 385 Price Band
- Falling Resistance Trendline hurdle with Resistance Zone
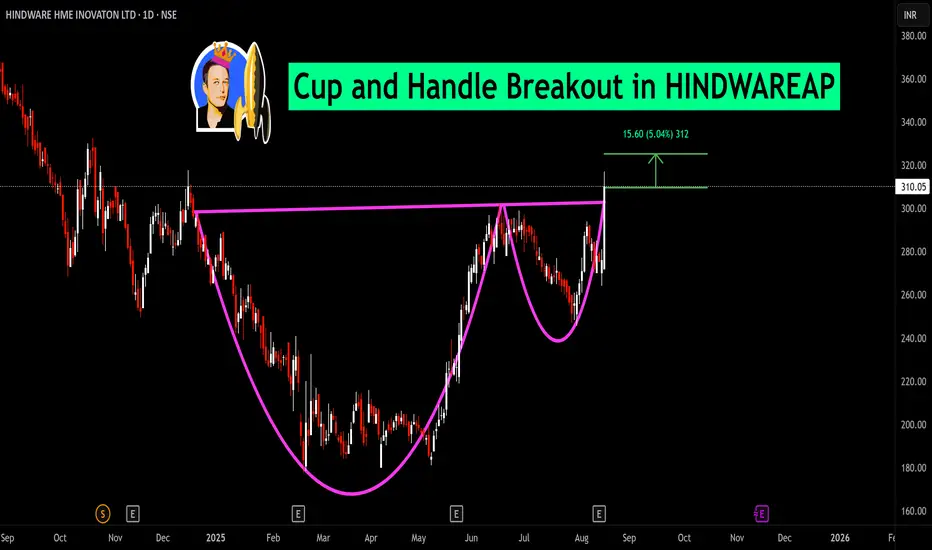
- Bullish Cup and Handle pattern by the Resistance Zone neckline
- Rising Support Trendline seems well sustained by price momentum
- *Volumes steadily close to avg traded qty, need to increase for fresh breakout*
BUY TODAY SELL TOMORROW for 5%DON’T HAVE TIME TO MANAGE YOUR TRADES?
- Take BTST trades at 3:25 pm every day
- Try to exit by taking 4-7% profit of each trade
- SL can also be maintained as closing below the low of the breakout candle
Now, why do I prefer BTST over swing trades? The primary reason is that I have observed that 90% of the stocks give most of the movement in just 1-2 days and the rest of the time they either consolidate or fall
Resistance Breakout in AVALON
BUY TODAY SELL TOMORROW for 5%

BUY TODAY SELL TOMORROW for 5%DON’T HAVE TIME TO MANAGE YOUR TRADES?
- Take BTST trades at 3:25 pm every day
- Try to exit by taking 4-7% profit of each trade
- SL can also be maintained as closing below the low of the breakout candle
Now, why do I prefer BTST over swing trades? The primary reason is that I have observed that 90% of the stocks give most of the movement in just 1-2 days and the rest of the time they either consolidate or fall
Rising Wedge Pattern in OSWALAGRO
BUY TODAY SELL TOMORROW for 5%

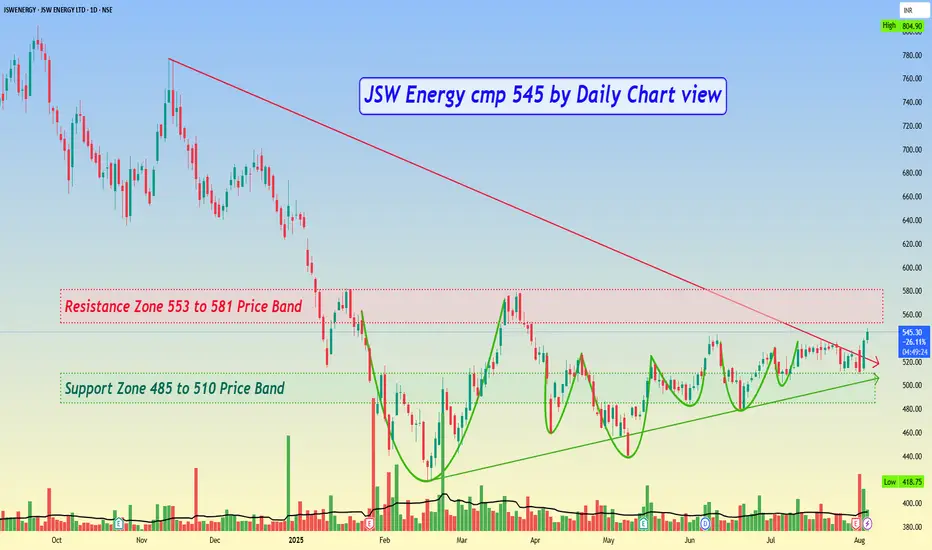
JSW Energy cmp 545 by Daily Chart viewJSW Energy cmp 545 by Daily Chart view
- Support Zone 485 to 510 Price Band
- Resistance Zone 553 to 581 Price Band
- Falling Resistance Trendline Breakout has well sustained
- Rising Support Trendline well respected by upwards Price Momentum
- Multiple Bullish Rounding Bottoms plus considerate VCP pattern too, as viewed individually
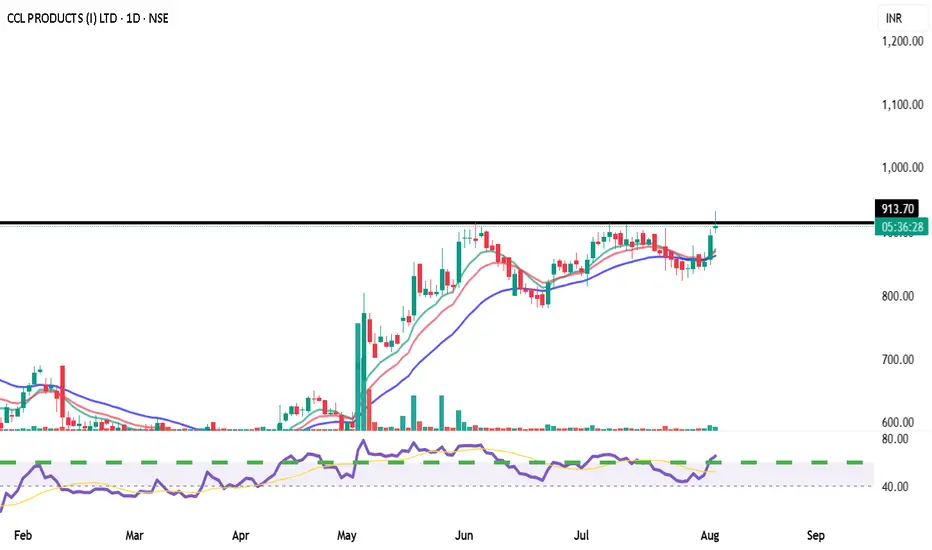
CCL PRODUCTS (INDIA) LIMITED EQUITY RESEARCH REPORTRecommendation: BUY
Target Price: ₹1,050 (12-month horizon)
Stop Loss: ₹850
Rationale
CCL Products represents a compelling investment opportunity in India's food processing sector. The company's strong financial performance, market leadership position, and strategic expansion plans provide solid fundamentals for continued growth. Strong Q4 FY25 results with 50.38% PBT growth and 15.02% revenue growth demonstrate operational excellence and market demand strength.
Catalyst Timeline
Near-term (3-6 months): Q1 FY26 results and capacity utilization updates
Medium-term (6-12 months): Specialty coffee segment scaling and Vietnam facility ramp-up
Long-term (12-24 months): Achievement of 100,000 MT capacity target
Risk-Reward Assessment
Upside Potential: 14.1% to target price
Risk Level: Moderate to High (commodity exposure)
Investment Horizon: Medium to long-term (12-18 months)
BUY TODAY SELL TOMORROW for 5%DON’T HAVE TIME TO MANAGE YOUR TRADES?
- Take BTST trades at 3:25 pm every day
- Try to exit by taking 4-7% profit of each trade
- SL can also be maintained as closing below the low of the breakout candle
Now, why do I prefer BTST over swing trades? The primary reason is that I have observed that 90% of the stocks give most of the movement in just 1-2 days and the rest of the time they either consolidate or fall
Trendline Support in SUZLON
BUY TODAY SELL TOMORROW for 5%

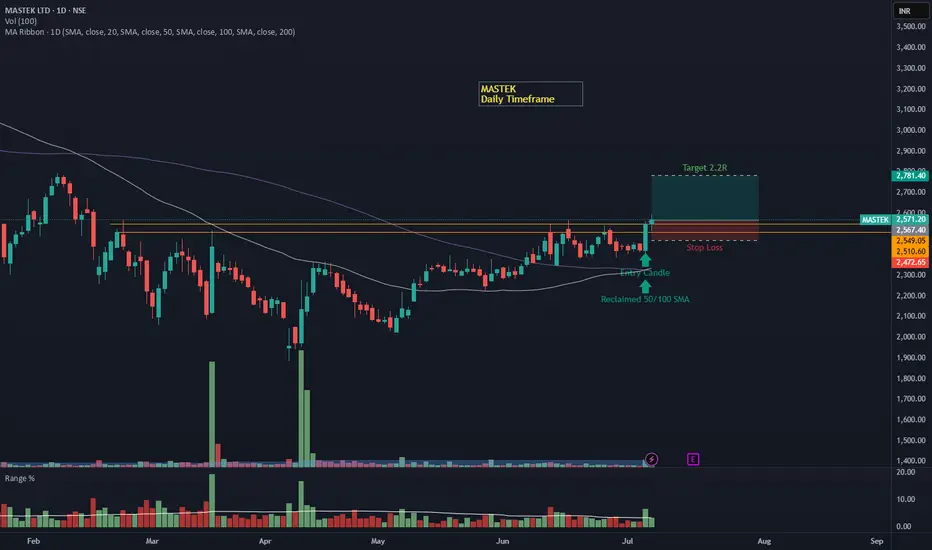
MASTEK – Daily Timeframe Breakout Idea (Resistance Zone Break)MASTEK has broken above a key resistance zone on the daily timeframe, backed by a strong bullish candle and a significant volume surge.
📌 Breakout Context:
The stock consolidated near the ₹2460–2480 zone for several sessions, forming a horizontal resistance zone.
On July 4th, the price broke out with strong bullish momentum, closing above the resistance with a wide-range green candle and a volume spike.
The breakout candle also closed above both 50- and 100-day Simple Moving Averages, confirming a bullish bias.
💡 Trade Setup:
Entry: ₹2550–2570 (near breakout)
Stop Loss: Below the breakout zone at ₹2472
Target: ₹2780+ (2.2R setup)
Risk-Reward: ~1:2.2 (ideal for swing trades)
🎯 Why This Setup Stands Out:
Volume on the breakout day is notably higher than average, confirming institutional interest.
Clean horizontal breakout from a multi-week range.
SMA structure is bullish, with the price reclaiming key MAs.
⚠️ Disclaimer: This post is for educational purposes only and not financial advice. Always consult your financial advisor before making trading decisions.
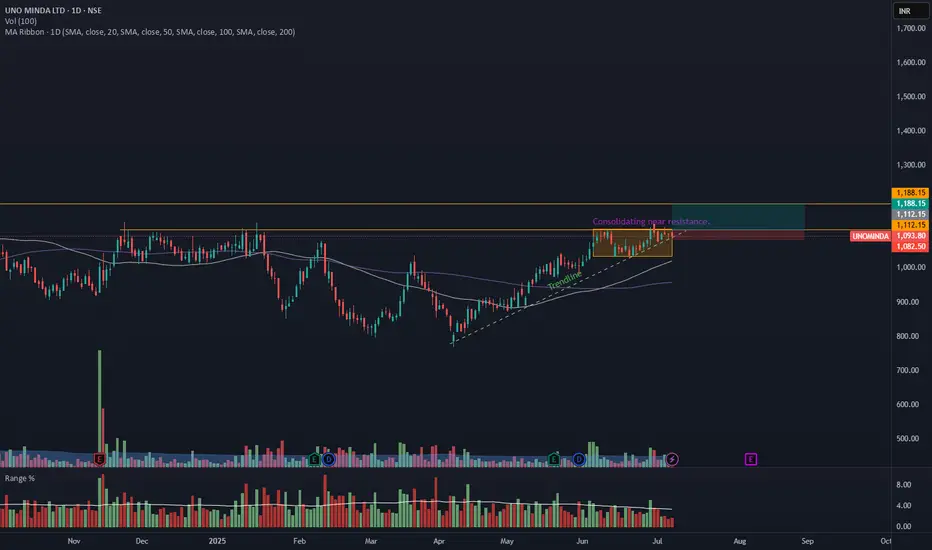
UNOMINDA – Daily Timeframe Breakout Idea (Resistance Zone Break)UNO MINDA LTD. has shown a breakout above a key horizontal resistance level on the daily chart, accompanied by a nearly 1.5 times volume surge near the breakout, as seen earlier, supported by strong momentum.
🔍 Breakout Context:
- Price might break above the ~₹1110 horizontal resistance, which had held for over 6 months.
- Breakout supported by more than average volume and just above average range near the resistance zone.
- The price is also trading above both the 50- and 100-day SMAs, indicating strong trend continuation.
- This aligns with a bullish continuation setup.
📉 Trade Plan:
- CMP: ₹1093
- Entry: Near ₹1112
- Target: ₹1188 (~7% upside from CMP)
- Stop-Loss: ₹1082
- Risk-Reward Ratio: ~1 : 2.0
📌 Note:
- Look for a confirmation candle to enter the trade.
- Avoid chasing the extended move unless confident in intraday momentum.
⚠️ Disclaimer: This post is for educational purposes only and not financial advice. Always do your research or consult a financial advisor before trading.
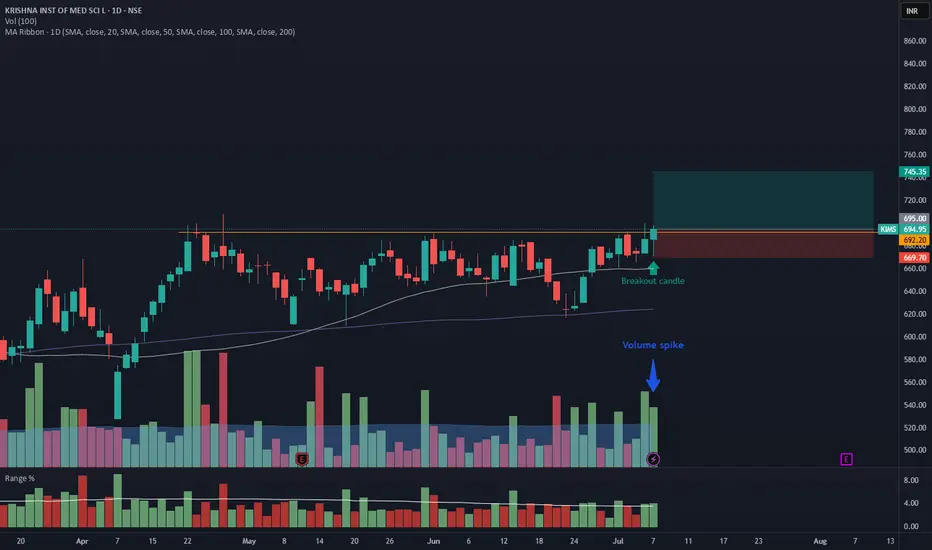
KIMS – Daily Timeframe Breakout Idea (Resistance Zone Break)
KRISHNA INSTITUTE OF MEDICAL SCIENCE has shown a breakout above a key horizontal resistance on the daily chart, accompanied by a ~2x volume surge, supported by strong momentum.
🔍 Breakout Context:
- Price broke above the ~692.20 horizontal resistance, which had held for over 2 months.
- Breakout supported by <2x average volume and just above average range on the breakout candle.
- The price is also trading above both the 50- and 100-day SMAs, indicating strong trend continuation.
- This aligns with a bullish continuation setup.
📉 Trade Plan:
- CMP: ₹694
- Entry: Near ₹695
- Target: ₹746 (~7.25% upside from CMP)
- Stop-Loss: ₹669
- Risk-Reward Ratio: ~1 : 2.0
📌 Note:
- Avoid chasing the extended move unless confident in intraday momentum.
⚠️ Disclaimer: This post is for educational purposes only and not financial advice. Always do your research or consult a financial advisor before trading.
NIFTY Analysis – 21 july 2025 ,morning update at 9 amNIFTY Price Levels:
Expected Opening:-- Near 24985 (flat)
Upside Watch: May test 25035
Downside Trigger: If Nifty fails to hold 24985, potential fall towards:
24896 (Support 1)
24807 (Support 2)
nifty support -24897, 24807, 24722
Resistance -25035, 25122, 25219
Wait for Pattern Confirmation:
Bottleneck patterns often result in fakeouts, so avoid premature entries.
Use BOD or SOR Strategy
BOD (Buy on Dip): Only if strong bounce from support with volume.
SOR (Sell on Rise): If price fails to sustain above resistance zones.
Scalping Opportunity:
Due to bottleneck formation, expect a narrow range
Opening near 24985, range-bound likely due to bottleneck.
Upside capped near 25035 unless breakout on volume.
Watch 24896 and 24807 for bounce or breakdown.
Prefer scalping or small quantity BOD/SOR trades post 9:30 AM
Nifty is opening flat near 24985 (inside this range).
Bearish Bottleneck pattern means price is getting compressed (low volatility).
Both buyers and sellers are active inside this tight band but no clear breakout yet.
Scalping is best strategy in sideways zones, with small targets and stop-loss.

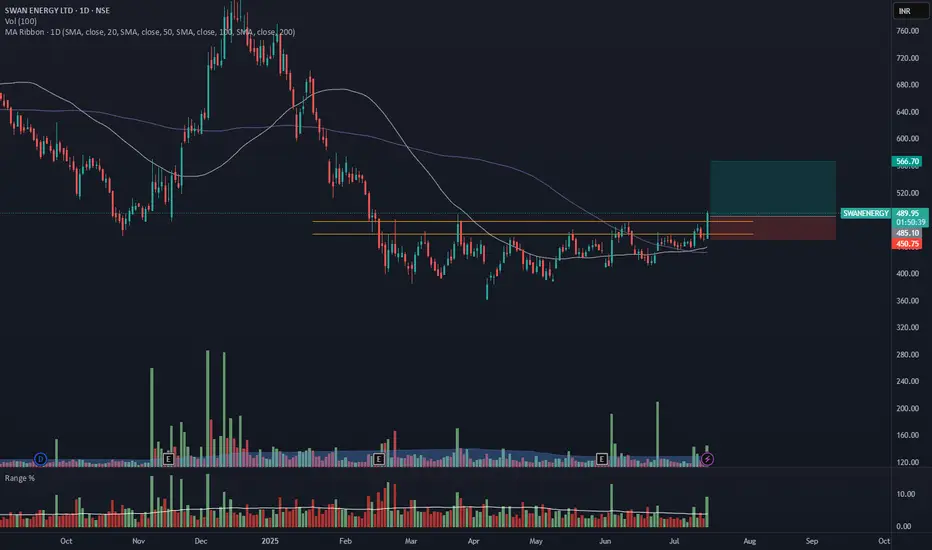
SWANENERGY - Daily Timeframe Breakout (Resistance Zone Break)SWAN ENERGY has shown a breakout above a key horizontal resistance level on the daily chart, accompanied by a nearly 2.5 times volume surge near the breakout zone, as seen earlier, supported by strong momentum.
🔍 Breakout Context:
- Price might break above the ~₹484 horizontal resistance, which had held for over 6 months.
The breakout zone has been supported by 2.5X volume and a range 3X of average near the resistance zone.
- The price is also trading above both the 50- and 100-day SMAs, indicating strong trend continuation.
- This aligns with a bullish continuation setup.
📉 Trade Plan:
- CMP: ₹485.2
- Entry: Near ₹484
- Target: ₹566 (~16.5% upside from CMP)
- Stop-Loss: ₹450
- Risk-Reward Ratio: ~ 1 : 2.3
📌 Note:
- Wait for the closing of this candle, enter the trade near 3:20 PM, or get confirmation on 75min/1Hr TF.
- Avoid chasing the extended move unless confident in intraday momentum.
⚠️ Disclaimer: This post is for educational purposes only and not financial advice. Always do your research or consult a financial advisor before trading.
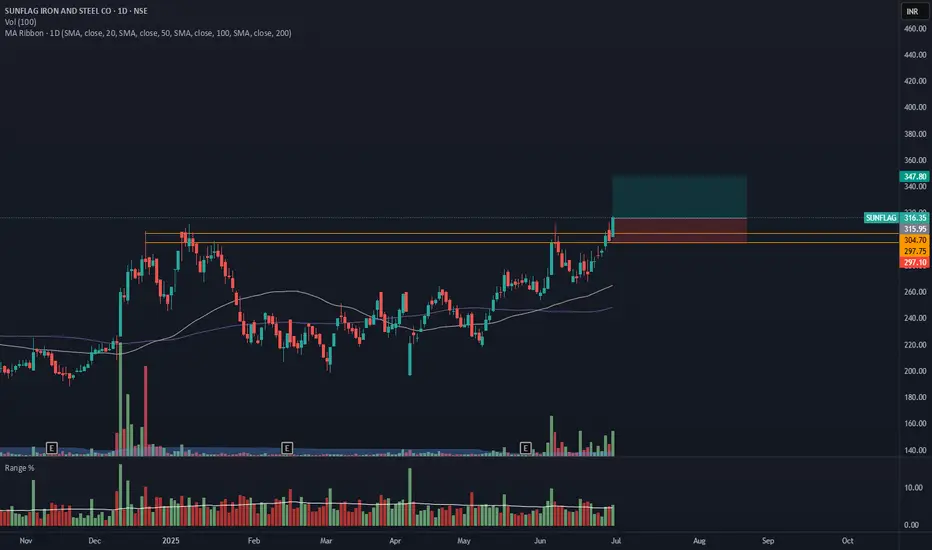
SUNFLAG- Breakout from DTFSUNFLAG has resistance weakening on the Daily charts and has given a breakout with good volume.
The target of this pattern signals an upside potential of 10% from the current price level in the medium term.
The stock is trading above its 50- and 100-day simple moving averages (SMAs). The range is more than 1.2X, and the Volume is also >6X the average.
CMP- Rs. 316
Target Price- Rs347 ( 10% upside)
SL - 297
Disclaimer: This is not a buy/sell recommendation. For educational purpose only. Kindly consult your financial advisor before entering a trade.
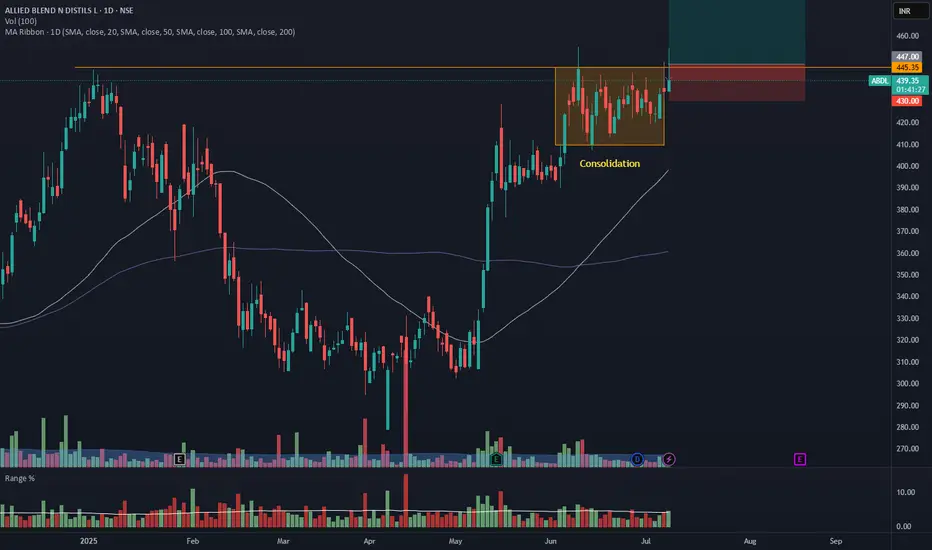
ABDL - Daily Timeframe Breakout Idea (Resistance Zone Break)Allied Blenders and Distillers Ltd. has shown a breakout above a key horizontal resistance level on the daily chart, accompanied by a nearly 2 times volume surge near the breakout zone, as seen earlier, supported by strong momentum.
🔍 Breakout Context:
- Price might break above the ~₹446 horizontal resistance, which had held for over 6 months.
The breakout zone has been supported by 2X volume and a range 1.5X of average near the resistance zone.
- The price is also trading above both the 50- and 100-day SMAs, indicating strong trend continuation.
- This aligns with a bullish continuation setup.
📉 Trade Plan:
- CMP: ₹439.15
- Entry: Near ₹446
- Target: ₹481 (~7.5% upside from CMP)
- Stop-Loss: ₹430
- Risk-Reward Ratio: ~ 1 : 2
📌 Note:
- Look for a confirmation candle to enter the trade.
- Avoid chasing the extended move unless confident in intraday momentum.
⚠️ Disclaimer: This post is for educational purposes only and not financial advice. Always do your research or consult a financial advisor before trading.
EIEL: The Anatomy of a Textbook Turnaround PlayToday, we're going to dissect the anatomy of the EIEL chart. What we have here isn't just a random series of candlesticks; it's a compelling case study in how a stock structurally transitions from a deep downtrend to a potential new path upward. It's a classic story, and the clues have been laid out for us to follow.
Every now and then, a chart comes along that tells a crystal-clear story. It’s not about predicting the future with certainty, but about recognizing a classic pattern of behavior. In my opinion, EIEL is painting one of those pictures right now—a powerful narrative of a stock transitioning from a brutal downtrend to a new, potential uptrend.
Let’s break down the key chapters of this story.
Chapter 1: The Foundation (March - May 2025)
After a long and painful decline, the selling finally exhausted itself. The stock didn’t just stop falling; it went into a deep slumber, trading sideways in a well-defined range.
The Accumulation Zone: This is where the smart money went to work. For three months, while the stock looked boring to most, the volume completely evaporated. This wasn't a sign of disinterest; it was the tell-tale sign of accumulation. Big players were quietly absorbing shares from the last of the weak hands.
The Bedrock Support: The absolute floor for this entire structure was established at 188 . This is the level where buyers showed up with absolute resolve.
Chapter 2: The Ignition (Late May 2025)
After months of quiet, the market made its move. The stock ignited, blasting through the ceiling of its trading range at 232 .
This wasn't just a breakout; it was a statement of intent, backed by a massive surge in volume. That's the kind of power that signals a genuine change in character for a stock.
Chapter 3: The Confirmation & The Coil (June - Present)
This is where the story gets really interesting, and it’s what makes the current setup so compelling. After the powerful breakout, the stock pulled back to re-test the old resistance level.
It wasn't a perfect, clean kiss of support. It dipped slightly below 232 in a classic "shakeout" maneuver, designed to scare traders out of their positions before the real move. The fast and aggressive recovery from that dip is incredibly bullish—it confirmed that the old ceiling is now the new floor.
So, where do we stand now?
The Box: The price is currently coiling in a very tight consolidation box, building energy for its next move. The floor of this box is our key support at 232 , and the lid is the immediate resistance at 252 .
The Volume Story: Just like in the initial accumulation phase, the volume has gone quiet again during this consolidation. This tells us there's very little selling pressure. The stock is simply resting.
🎯 The Game Plan 🎯
Based on this price action, the thesis is straightforwardly bullish. The stock has done all the heavy lifting of building a base and has confirmed its strength.
The Trigger: A decisive close above the lid of the box at 252 would be the signal that this consolidation is over and the next leg up is beginning.
The First Target: The initial objective would be a re-test of the post-breakout high at 268 . A move through that level would open the door to significantly more upside.
The Invalidation Point: A trade is only as good as its risk management. The bullish thesis remains fully intact as long as the price holds above the key support at 232 . A close below this level would signal that the breakout has failed and would be a reason to step aside.
This is a classic setup that rewards patience. The structure is sound, the volume confirms the price action, and the risk is clearly defined. Keep a close eye on that 252 level.
Disclaimer: This is my personal analysis and is for educational purposes only. It is not financial advice. Please conduct your own due diligence before making any trading decisions.

NYKAA - Breakout from DTFNYKAA has resistance weakening on the Daily charts and has given a breakout with good volume.
The target of this pattern signals an upside potential of 10% from the current price level in the medium term.
The stock is trading above its 50- and 100-day simple moving averages (SMAs). The range is more than >1.2X, and the Volume is also >2X the average.
CMP- Rs. 108
Target Price- Rs228 ( 10% upside)
SL -202
Disclaimer: This is not a buy/sell recommendation. For educational purpose only. Kindly consult your financial advisor before entering a trade.

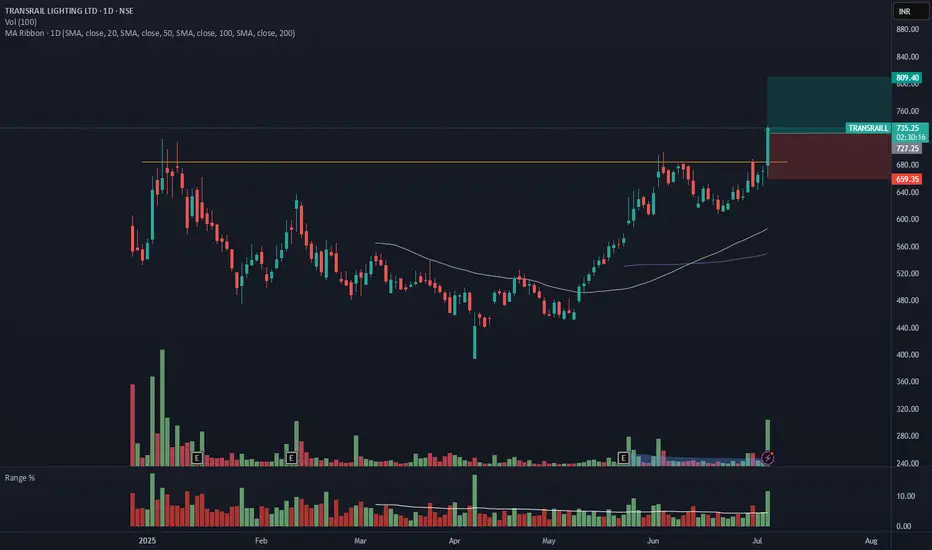
TRANSRAILL - Breakout from Daily TFTRANSRAILL has resistance weakening on the Daily charts and has given a breakout with good volume.
The target of this pattern signals an upside potential of ~10% from the current price level in the medium term.
The stock is trading above its 50- and 100-day simple moving averages (SMAs). The range is more than >2X, and the Volume is also >6X the average.
CMP- Rs. 727
Target Price- Rs.805( ~10% upside)
SL -859
Note- The breakout candle has gone up, extended, so be mindful of your position.
Disclaimer: This is not a buy/sell recommendation. For educational purpose only. Kindly consult your financial advisor before entering a trade.
APOLLOHOSP Soon to ATH??!!!Yessss!!!!!
Chart patterns looks prudent for the above titled opinion
Rounding bottom....with a Inverted H&S pattern awaiting a Breakout!!!!!!
Expecting a Breakout by this week or next.
We can make our entry after the breakout solid candle....
Just add it to your watchlist and keep an eye on it!!!!
will update once the breakout happens!!!!!
just my opinion....not an advice nor tip....
Thank you!!!!!!

CHOLAFIN- Breakout from DTFCHOLAFIN has resistance weakening on the Daily charts and has given a breakout with good volume.
The target of this pattern signals an upside potential of ~10% from the current price level in the medium term.
The stock is trading above its 50- and 100-day simple moving averages (SMAs). The range is more than >1X, and the Volume is also >1X the average.
CMP- Rs. 1628
Est. Entry price ~ 1670
Target Price- Rs1813 ( ~10% upside)
SL -1610
Note- The candle closed isn't very promising, so we have to wait for a stronger move. The promising move should be able to close above 1670.
Disclaimer: This is not a buy/sell recommendation. For educational purpose only. Kindly consult your financial advisor before entering a trade.

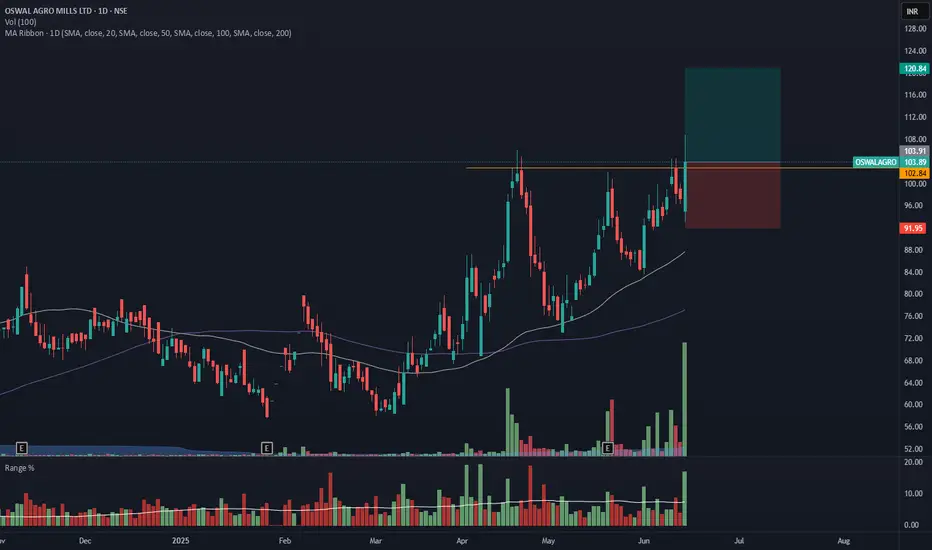
OSWALAGRO - Breakout from DTFOSWALAGRO has resistance weakening on the Daily charts and has given a breakout with good volume.
The target of this pattern signals an upside potential of 15% from the current price level in the medium term.
The stock is trading above its 50- and 100-day exponential moving averages (EMAs). The range is more than >2X, and the Volume is also >10X the average.
CMP- Rs. 104
Est. Entry price ~ 108
Target Price- Rs120 ( 15% upside)
SL -92
Note- The candle closed isn't very promising, so we have to wait for a stronger move.
Disclaimer: This is not a buy/sell recommendation. For educational purpose only. Kindly consult your financial advisor before entering a trade.
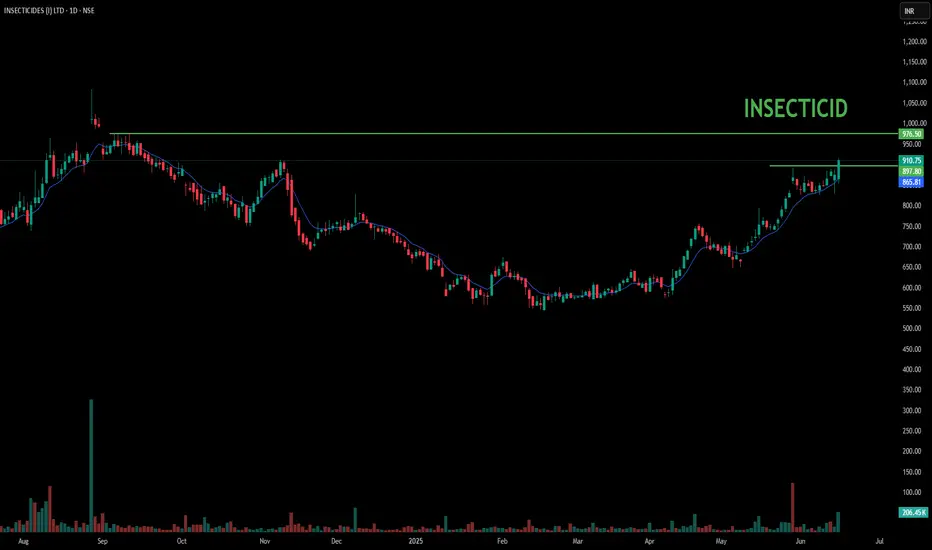
INSECTICIDES - BREAKOUT STOCK📈 Insecticides (India) Ltd – Breakout Stock on the Radar
Insecticides India is currently exhibiting strong technical momentum, supported by high volumes and a confirmed breakout on the charts. The stock has surpassed key resistance levels, indicating potential for short- to medium-term upside. Traders and investors should keep this stock on their watchlist for further price action confirmation.
🔍 Key Observations
Breakout from a consolidation zone
Rising volumes supporting the move
Technical indicators signaling bullish momentum
📌 This update is purely for informational and educational purposes only and not a recommendation to buy or sell any securities. Please do your own research or consult a SEBI-registered advisor before making any investment decisions.
Tirumalai: The Anatomy of a BreakoutOn the daily chart, TIRUMALCHM appears to be approaching a potential breakout from an ascending triangle pattern, a formation often associated with bullish continuation. Notably, the price has managed to close above all key EMAs, including the 200-day EMA, which is widely regarded as a long-term trend indicator.
From a momentum perspective, both the RSI and MACD indicators are showing strength on the daily and weekly timeframes. These signals may suggest the early stages of a sustained upward trend, contingent on broader market conditions and follow-through price action.
Given the current technical setup, the stock may be considered for gradual accumulation near the CMP. Alternatively, more conservative participants might prefer to wait for a potential retest of the breakout zone in the coming sessions, which could offer a more favourable risk-reward entry with a next long term resistance of ₹340 .
A technical invalidation level could be considered below the ₹251 mark, depending on individual risk tolerance and trading strategy.
Disclaimer: This analysis is intended solely for educational and informational purposes. It does not constitute investment advice or a recommendation to buy or sell any financial instrument. Market participants are strongly encouraged to conduct their own research or consult with a qualified financial advisor before making any investment decisions.
