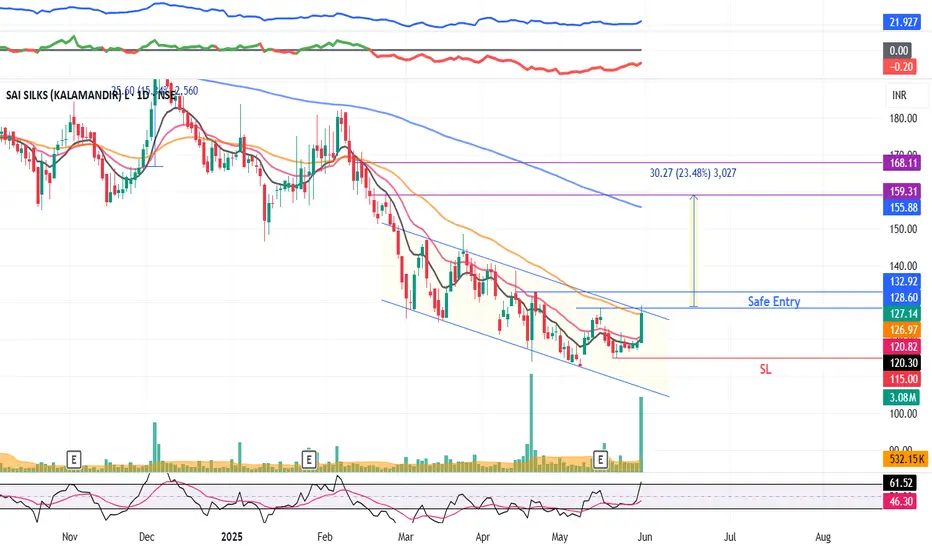
KALAMANDIR : Falling Channel pattern#KALAMANDIR #chartpatterntrading #fallingchannelpattern #channelbreakout #breakoutstock
KALAMANDIR : Swing Trade
>> Breakout stock
>> Falling Channel pattern breakout
>> Good Strength & Volume Buildup
>> Stock in Momentum
Swing Traders can lock profits @10% & keep trailing
Disc : Stock Charts shared are for Learning purpose, not a Trade recommendation
Consult a SEBI Registered Advisor before taking position in it.
Breakoutstocks
PVSL : Swing Trade#PVSL #swingtrade #Trendingstock #momentumstock
PVSL : Swing trade
>> Breakout stock
>> Trending setup
>> Momentum stock
>> Good Strength & Volume buildup
Swing Traders can lock profit at 10% and keep Trailing
Disc : Stock Charts shared are for Learning purpose and not a Trade Recommendation.
Consult a SEBI Registered advisor before taking position in it.

CHALET Hotels : Swing pick#CHALET #swingtrade #breakout #threewhitesoldiers #trendingstock
CHALET : Swing Trade
>> TWS Visible
>> Trending Setup
>> Good Strength in Stock
>> Volumes Dried up, Expansion imminent
>> Quick 10-15% upside potential
Swing Traders can lock profit at 10% & Keep Trailing
Disc : Charts shared are for Learning purpose and not a Trade recommendation. Consult a SEBI Registered Advisor before taking position in it.

CSBBANK : Swing Pick#CSBBANK #BREAKOUTSTOCK #trendingstock
CSBBANK : Swing Trade
>> Breakout Candidate
>> Trending stock
>> Good strength & Volume
>> Good Upside Potential
Swing Traders can lock profit at 10% and keep trailing
Disc : Stock Charts shared are for Learning purpose and not a Trade recommendation.
Consult a SEBI Registered Advisor before taking position in it.

SURAJEST : Short Term Trade (1-3 Months)#SURAJEST #parallelchannelbreakout #breakoutstock #trendingStock #Momentumstock
SURAJEST : Short Term (1-3 Months)
>> Parallel Channel Breakout
>> Breakout Candidate
>> Trending Stock in Momentum
>> Good Strength in Stock
>> Recent Volume Buildup
>> Good Upside Potential
Swing Traders can lock profit at 10% and keep trailing
Disc : Stock charts shared are for Learning purpose and not a Trade recommendation.
Pls consult a SEBI Registered Advisor before taking position in it.

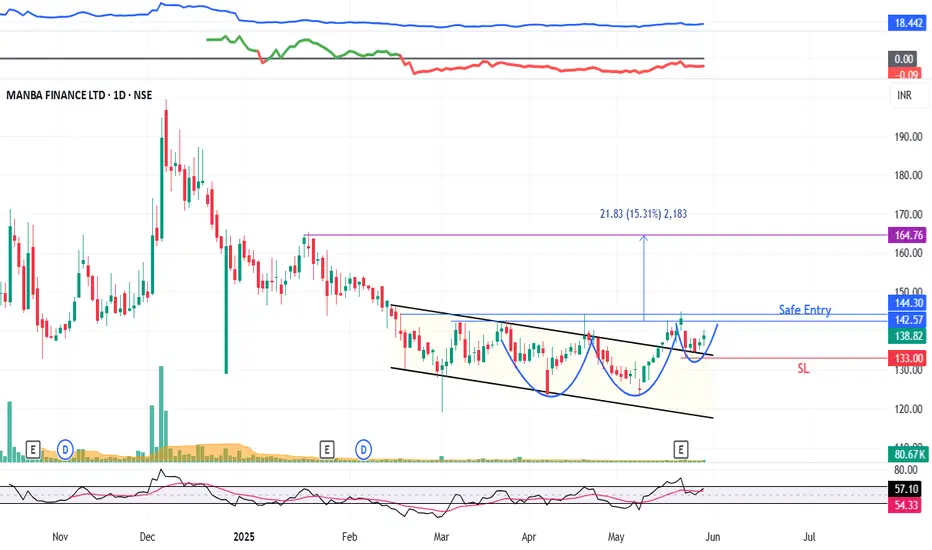
MANBA : Momentum stock (swing pick)#MANBA #breakoutstock #vcppattern #parallelchannelbreakout #momentumstock
MANBA : Swing Trade
>> Parallel Channel Breakout
>> VCP pattern formation
>> Trending Stock
>> Breakout Candidate
>> Good Strength & Volumes Dried up
Swing Traders can lock profit at 10% & keep trailing.
Disclaimer : Stock Charts shared are for Learning Purpose and not a Trade recommendation. Consult a SEBI Registered Advisor before taking position in it.
Even Technical Analysis is not 100%, so I reserve the Right to be wrong.
SHANKARA: supply zone breakout➡️PE well below the industry PE (half)
➡️highest ever sales and manageable debt
➡️volume uptick
Cons:
⬆️receivables (probably on account of pushed sales)
⬆️retail holding and trade payables

ECLERX | Ideal Retracement Zone Identified📉 White Lines — Multiple DTF trendlines, including the key falling counter-trendline (CT), were decisively broken. The breakout marks the end of a strong downward structure with excellent follow-through.
🟧 Orange Line — Major Monthly Time Frame (MTF) resistance lies just overhead.
🔍 Breakout Candle:
Exceptionally strong with a close near high.
Backed by 1.83M volume, showing strong institutional interest.
Pattern size is large — adding weight to the structural reversal.
⚠️ Caution: A large portion of the move seems to have already played out within one candle. Chasing here risks poor R:R due to limited space before overhead resistance.
📐 Strategy Setup:
Fibonacci Retracement plotted on the breakout candle.
Ideal entry zone highlighted in green between the 0.382 to 0.5 levels
This zone represents a healthy and probable pullback area, offering better risk-reward alignment for potential continuation.
🧭 Trade Idea: Avoid chasing. Instead, watch for a retracement to the green zone. If price reacts positively there, it could offer a technically strong R:R opportunity while staying aligned with the broader breakout narrative.

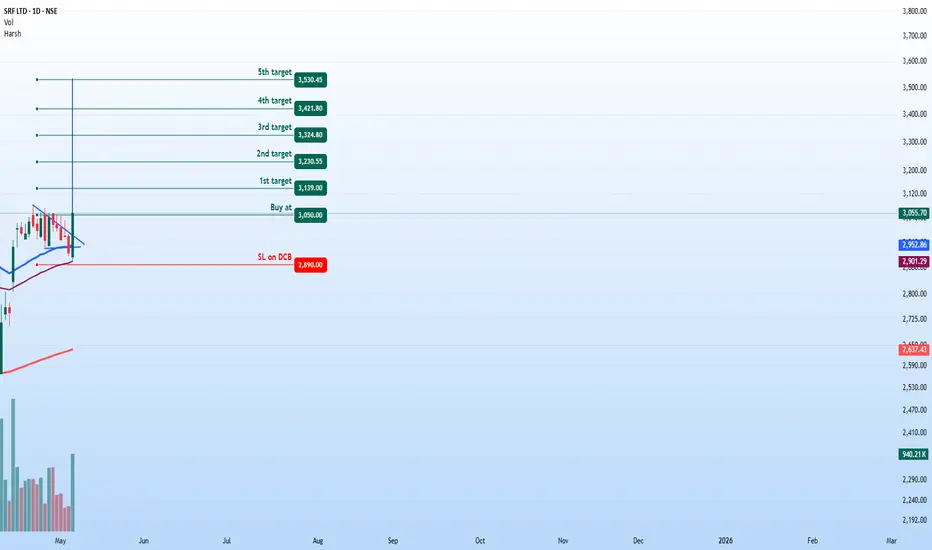
SRF – Bullish Breakout OpportunityStock Name: SRF Limited ( NSE:SRF )
Trend: Bullish 🚀
Timeframe: Daily
Trade Setup
Entry Zone: ₹3,050 (Breakout confirmation)
Stop Loss: ₹2,890 (~5.2% risk)
Targets:
T1: ₹3,139
T2: ₹3,230.55
T3: ₹3,324.80
T4: ₹3,421.80
Final Target: ₹3,530.45
Technical Rationale
✅ Bullish Flag Breakout – Price broke out of a consolidation pattern, signaling continuation.
✅ 200 DEMA Support – Strong bounce from the 200-day Exponential Moving Average.
✅ RSI Strength – Daily & Weekly RSI >60 (bullish momentum intact).
✅ Volume Surge – Breakout volume (940K) was 3x+ the previous day (300K), confirming strong buying interest.
Risk Management
Strict SL – Exit if ₹2,890 is breached on daily closing basis.
Trail SL – After hitting T1/T2, move SL to breakeven or higher.
Partial Booking – Consider taking profits at each target.
Disclaimer
This post is for educational purposes only and not investment advice. Trading involves risks, including capital loss. Past performance doesn’t guarantee future results. Always conduct your own analysis or consult a financial advisor before trading. The author holds no liability for financial decisions made based on this content.
Thoughts? Are you watching NSE:SRF for this breakout? Drop your views below! 👇
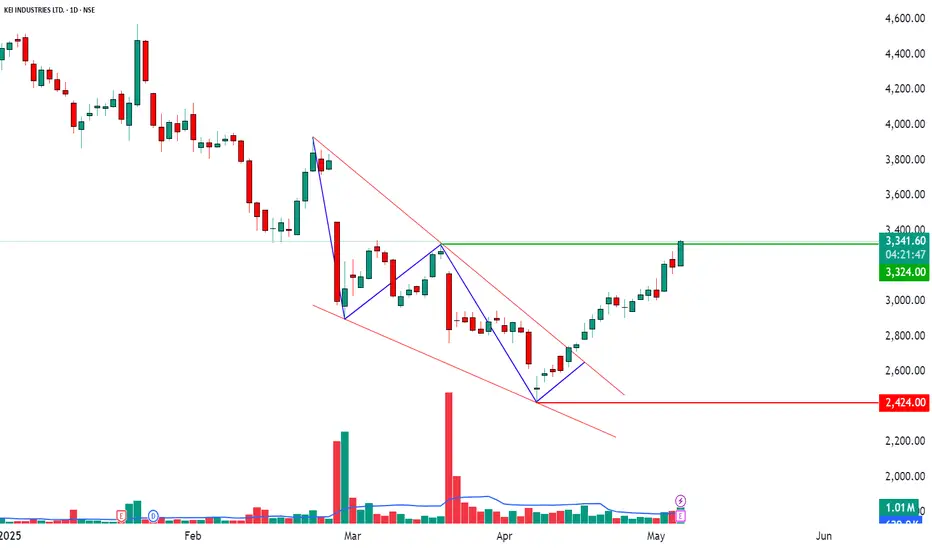
Falling Wedge Breakout + AB=CD Bullish Pattern | Daily Chart📈 KEI INDUSTRIES LTD – Falling Wedge Breakout + AB=CD Bullish Pattern | Daily Chart
🗓️ Date: May 07, 2025
💹 Timeframe: Daily
🏢 Stock: KEI Industries Ltd (NSE)
📊 Chart Analysis Overview:
KEI has broken out of a Falling Wedge pattern, a classic bullish continuation/reversal signal, backed by strong volume surge and a completed AB=CD harmonic leg — indicating the bulls are stepping in with conviction.
After weeks of corrective move, the price respected the wedge’s support, formed higher lows, and has now convincingly breached the upper trendline.
🔎 Pattern Breakdown:
✅ Falling Wedge: Identified with red trendlines showing price compression.
✅ AB=CD Harmonic: Blue legs marking symmetrical retracement and projection.
✅ Breakout Confirmation: Bullish candles closing above the wedge resistance with momentum.
📌 Key Technical Levels:
🔴 Support Zone: ₹2,424 (Previous swing low & harmonic completion)
🟢 Resistance Ahead: ₹3,324 (Recent price ceiling)
⚡ CMP: ₹3,318.50
A clean close above ₹3,324 could ignite the next leg of momentum, possibly toward ₹3,500–₹3,650 in coming sessions.
📈 Volume Insight:
Breakout is supported by a noticeable volume expansion — suggesting participation by smart money and institutional interest.
📰 March Quarter Results – Strong Fundamentals:
📈 Consolidated Net Profit:
🟢 ₹226.5 Cr — up 34.5% YoY (vs ₹168.5 Cr last year)
📊 Revenue:
🟢 ₹2,914.8 Cr — up 25.1% YoY (vs ₹2,329.9 Cr)
This earnings momentum adds a fundamental tailwind to the ongoing technical rally.
🧠 Market Bias & Strategy:
As long as the price holds above ₹3,000 and respects the breakout structure, the trend favors bullish momentum traders.
📍 Lookout for a pullback-to-retest near ₹3,200–₹3,250 as a potential entry zone with low-risk, high-reward setup.
🔔 Disclaimer: This analysis is for educational purposes only, not investment advice. Always do your own research or consult your advisor before trading.
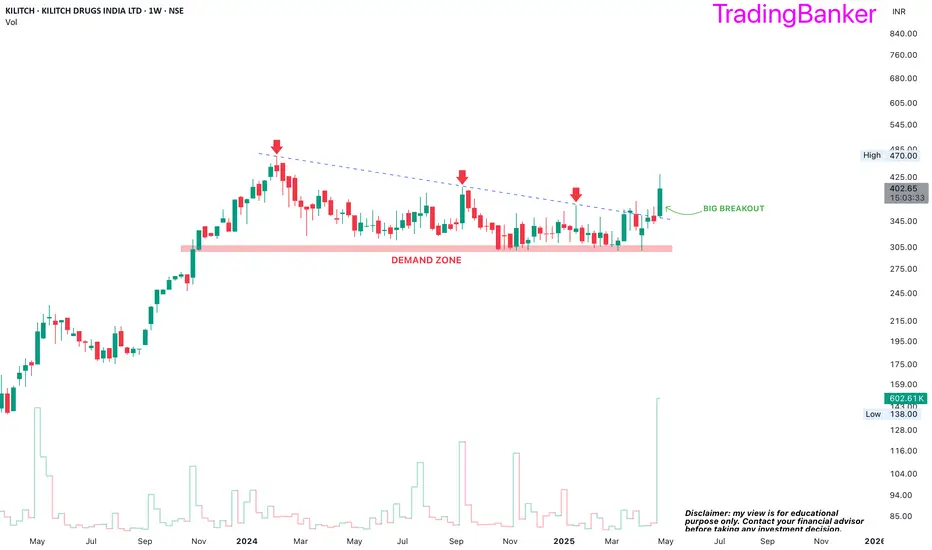
KILITCH: Multibagger in the making?-Earnings and sales have been improving YoY
-Undertaking capacity expansion which will further boost financials
-Highest promoter holding in the last decade
-Will enter partially and rest upon decent quarterly result
-Trendline breakout with huge volumes. SL below breakout candle.
Emcure Pharma CMP at 1045 After an admissible correction stock started moving upside, if the observed wave wroked well we may see an upside for 1247 with wave 3 and correction will be over .
I am bullish on it .

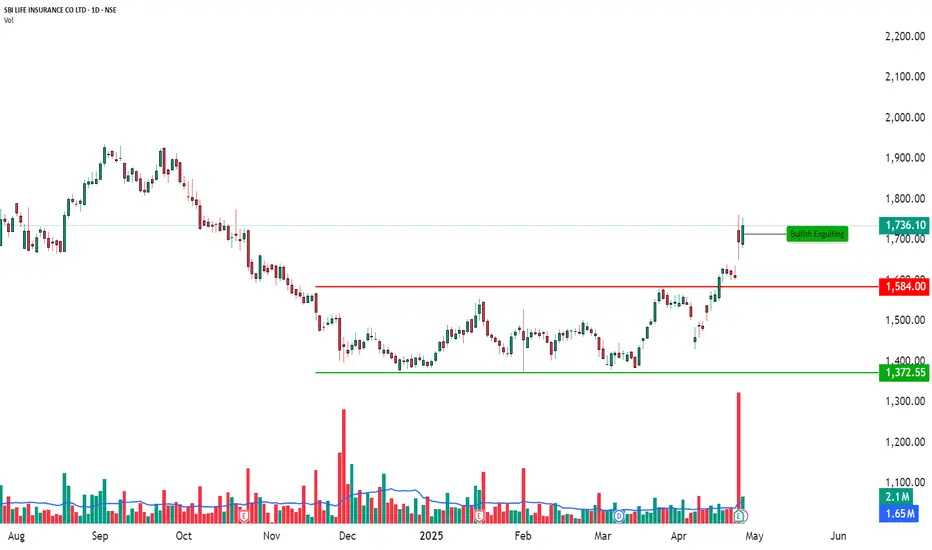
Breakout with Bullish Engulfing Confirmation | Daily Chart🏦 SBI LIFE INSURANCE CO LTD – Breakout with Bullish Engulfing Confirmation | Daily Chart
📅 Date: April 28, 2025
📈 Timeframe: Daily Chart
🔍 Stock: SBI Life Insurance Co Ltd (NSE)
📌 Technical Overview:
SBI Life is showing strong bullish momentum on the daily chart after breaking out above a key horizontal resistance around ₹1,584.
The price has formed a Bullish Engulfing candlestick pattern, indicating renewed buyer strength, backed by heavy volume.
🧩 Chart Pattern:
Strong horizontal resistance at ₹1,584 (now acting as support).
Bullish Engulfing candle printed around ₹1,736.10, showing strong rejection of lower levels.
Price structure continues to maintain higher highs and higher lows – a positive sign for bulls.
🔍 Key Price Levels:
Support Zones: ₹1,584(marked in red)
Major Support: ₹1,372.55(green horizontal line)
Current Market Price (CMP): ₹1,736.10
A sustained move above ₹1,736 with rising volume could potentially take the stock towards higher psychological levels around ₹1,800+.
📊 Volume Analysis:
Strong volume breakout observed during the recent rally.
Volume spike supports the validity of the bullish breakout, indicating increased buying interest.
🧠 Observational Bias:
As long as SBI Life holds above ₹1,584, the short-term to medium-term bias remains positively bullish. Any healthy pullbacks near ₹1,580–₹1,600 zones could offer better risk-reward setups for positional traders.
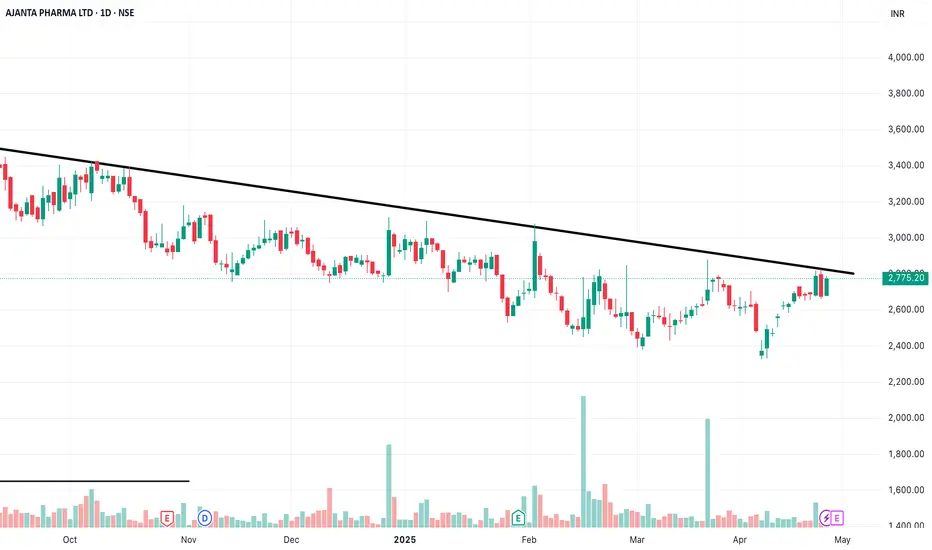
AJANTA PHARMA CMP 2775 Having trend line breakout and with this Breakout , with this breakout it may lead to all time high , Pharma industry is all time favourite and ready to move with appropriate correction.
Breakout Alert on Ntpc Green LTD🔹 Counter Trendline Breakout (CT BO)
Price action has broken a well-respected counter trendline, indicating a potential shift in momentum from bearish to bullish. This breakout isn’t just symbolic — it's backed by conviction.
🔹 Volume-Based Confirmation
Today's bullish candle comes with significantly high volume, suggesting institutional activity and strong buyer interest. Volume is one of the most critical confirmation tools in breakout trading — and it's speaking loud and clear here.
🔹 Low → Higher Low → Breakout
A major Low was established earlier.
Price then formed a Higher Low Zone, indicating accumulation and a potential trend reversal.
The breakout candle confirms the Higher High – Higher Low (HH-HL) market structure — a classic signal of trend reversal and early uptrend formation.
🔔 Add to your watchlist.
📍 Mark the breakout zone.
📈 Let price action guide your decision.

HCG: supply zone breakout➡️Volatility contraction pattern
➡️supply zone #breakout
➡️SL below breakout candle
➡️Increasing cash from operations
➡️capital expansion
➡️reducing retail shareholding
Cons:
➡️Receivables beyond 6 months
➡️profits are down despite increased sales

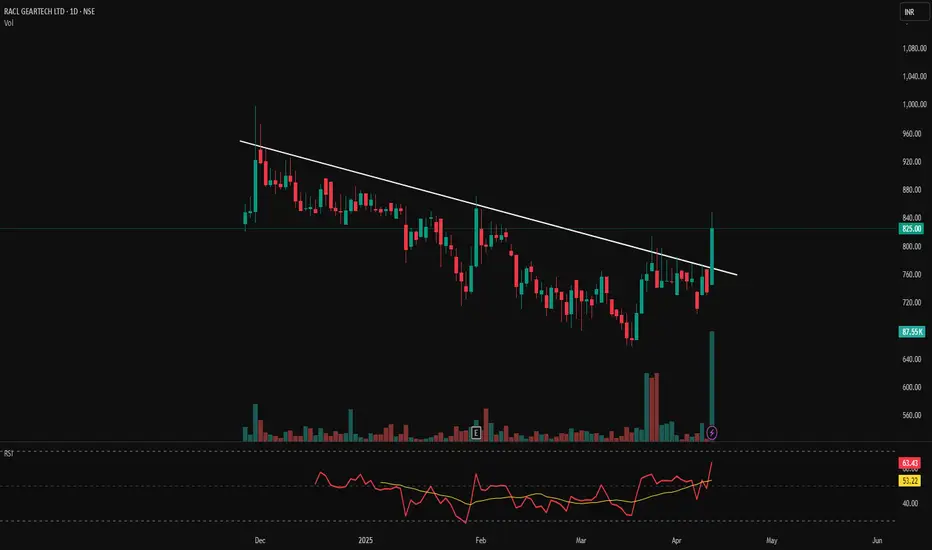
RACL Geartech Ltd - Trendline Breakout with Volume ConfirmationRACL Geartech Ltd – Trendline Breakout with Volume Confirmation! 🚀🔥
📅 Date: April 12, 2025
📊 Chart Overview:
RACL Geartech has shown a strong bullish breakout above a long-standing descending trendline resistance, backed by a massive volume surge—a classic breakout confirmation signal.
📌 Key Levels:
📈 Breakout Level (Previous Resistance): ₹760
✅ New Support: ₹760
🔼 Resistance Zones Ahead: ₹860 ➡️ ₹900 ➡️ ₹950
⚠️ Stop-loss for Swing Position: ₹740 (below breakout + trendline)
📈 Technical Indicators:
📊 Volume Spike: Today’s volume (87.5K) is significantly higher than the recent average, indicating strong buying interest.
📉 RSI (Relative Strength Index): At 63.43, showing positive momentum with potential room before entering overbought territory.
📉 MACD-like indicator (yellow line vs red line crossover): Clear upward crossover—bullish shift in momentum.
📏 Trendline drawn from December 2024 highs to recent lower highs—now convincingly broken.
🧠 Trade Strategy:
🎯 Consider buying on dips near ₹770–₹785 if retest occurs.
🛡 SL: ₹740
🎯 Targets: ₹860 ➡️ ₹900 ➡️ ₹950
📌 Disclaimer: This chart is for educational and analytical purposes. Always conduct your own analysis or consult a registered financial advisor before taking any trading/investment decision.
NIVA BUPA HEALTH (NSE: NIVA) – Breakout PotentialRight now, it is completing a descending triangle breakout, which is a bullish pattern.
The stock has been consolidating for the past 4 months in a tight range, building strength for a breakout.
All important levels have been marked on the chart.
Looking at the chart, we can say that if the price breaks to the upside, there is a high probability that the stock will reach the ₹98.63 target.
For the past few days, volume has also been quite good. If we enter the stock at ₹76.66, we can achieve the target with
Risk: Reward :: 1 : 2.49
Support Levels:
🔹 ₹72.44 – Strong support zone
🔹 ₹70.11 – Previous low acting as support
🔹 ₹69.21 – Secondary support in case of a pullback
Resistance Levels:
🔹 ₹76.66 – Immediate breakout level
🔹 ₹85.35 – Previous high acting as resistance
🔹 ₹98.63 – Final target zone
Reasons:
✅ Consolidation for 4 months, leading to a strong breakout setup
✅ Descending Triangle Breakout
✅ Support at ₹72.44 holding strong
✅ Wait for RSI to cross 60 for confirmation
✅ First breakout attempt after listing drop
✅ High volume surge, indicating strong buying interest
✅ Price > 50 EMA and approaching trendline resistance
Verdict:
Bullish
Plan of Action:
Enter once the breakout is confirmed to the upside.
BUY: ₹76.66
Stoploss: ₹72.44
Target: ₹98.63
Trailing SL: ₹5–₹8 once price crosses ₹85

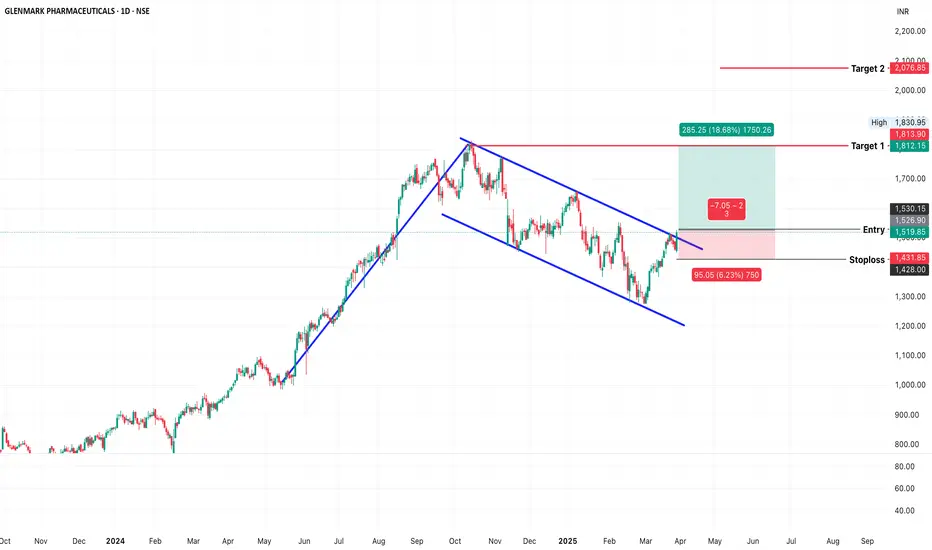
GLENMARK PHARMA (NSE: GLENMARK) – Confirmed Channel BreakoutGlenmark Pharma has confirmed a breakout from a falling wedge and flag & pole pattern , supported by strong volume and a bounce from the 200 EMA . Price structure and momentum suggest bullish continuation.
Key Observations:
Pattern Formation: Falling wedge + flag & pole since September 2024
Breakout Confirmation: Closed above upper trendline at ₹1,519.85 on March 27, 2025
200 EMA Support: Price took support at 200 EMA and reclaimed both key moving averages
Volume Spike: High volume on breakout candle validates the move
Support & Resistance Levels:
Immediate Support: ₹1,432
Breakout Level (Entry): ₹1,520
Target 1: ₹1,813
Target 2: ₹2,076
Major Resistance: ₹2,100
Indicators & Risk-Reward:
✅ RSI: 64.92 – showing strong bullish momentum
✅ Volume: Significant volume surge during breakout
✅ Risk-to-Reward: ~1:3 – ideal for swing setup
Verdict: Bullish
With pattern breakout, volume confirmation, and RSI strength, Glenmark is poised for a potential up-move.
Plan of Action:
BUY: ₹1,520
Stop Loss: ₹1,432
Target 1: ₹1,813
Target 2: ₹2,076
Trailing SL: Start trailing above ₹1,650 to protect profits
VA TECH WABAG LTD (NSE: WABAG) is about to break to the upsideRight now, it is completing a descending trendline breakout, which is a bullish pattern.
The stock has been consolidating for the past 4 months in a corrective phase and is now attempting a strong breakout.
All important levels have been marked on the chart.
Looking at the chart, we can say that if the price sustains above the breakout level, there is a high probability that the stock will reach the ₹1,922 target.
For the past few days, volume has also been quite good. If we enter the stock at ₹1,463, we can achieve the target with
Risk: Reward :: 1 : 2.63.
Support Levels:
🔹 ₹1,315 – Strong support zone
🔹 ₹1,182 – 50% Fibonacci retracement support
🔹 ₹1,007 – 61.8% Fibonacci support level (Golden Ratio)
Resistance Levels:
🔹 ₹1,482 – Immediate breakout level
🔹 ₹1,573 – Fibonacci 23.6% retracement resistance
🔹 ₹1,922 – Final target zone
Reasons:
✅ Consolidation for 4 months, leading to a strong breakout setup
✅ Descending Trendline Breakout
✅ Support at ₹1,315 holding strong
✅ Wait for RSI to cross 65 for confirmation
✅ Successful breakout attempt after a corrective phase
✅ High volume surge, indicating strong buying interest
✅ Price > 50-day & 200-day EMA (bullish signal)
Verdict:
Bullish
Plan of Action:
Enter once the breakout is confirmed to the upside.
BUY: ₹1,463
Stoploss: ₹1,315
Target: ₹1,922
Trailing SL: ₹50

GULFOILLUB-Breakout Stock🚀 Gulf Oil Lubricants (GULFOILLUB) is in strong momentum! This stock is showing promising movement, making it worth keeping on your watchlist. 📈 Investors are advised to study the stock and conduct their own research before making any investment decisions.
Disclaimer: This is purely for informational purposes and not a recommendation to buy or sell. Investors are advised to conduct their own research and risk assessment before making any investment decisions, as stock markets are subject to volatility and risks.
#StockMarket #MomentumStocks #BreakoutStocks #StocksToBuy #StockMarketNews #Trading #StockMarketIndia #ShareMarket #Nifty50 #SwingTrading #TechnicalAnalysis #BestStocks #NiftySmallCap #NiftyMidCap #BankNifty #MultibaggerStocks #Investment #IntradayTrading #StockMarketUpdates #TradingTips #BreakoutTrading #FinancialMarkets #StockMarketInvesting #GULFOILLUB #StocksToWatch #ShareMarketIndia

ETT - Breakout Stock ETT has recently emerged as a breakout stock, capturing significant investor attention through its impressive market performance and dynamic strategic initiatives. Its upward trajectory reflects robust market momentum, positioning ETT as a compelling prospect in the competitive landscape.

Amazing breakout on WEEKLY Timeframe - CAMLINFINECheckout an amazing breakout happened in the stock in Weekly timeframe, macroscopically seen in Daily timeframe. Having a great favor that the stock might be bullish expecting a staggering returns of minimum 25% TGT. IMPORTANT BREAKOUT LEVELS ARE ALWAYS RESPECTED!
NOTE for learners: Place the breakout levels as per the chart shared and track it yourself to get amazed!!
#No complicated chart patterns
#No big big indicators
#No Excel sheet or number magics
TRADE IDEA: WAIT FOR THE STOCK TO BREAKOUT IN WEEKLY TIMEFRAME ABOVE THIS LEVEL.
Checkout an amazing breakout happened in the stock in Weekly timeframe.
Breakouts happening in longer timeframe is way more powerful than the breakouts seen in Daily timeframe. You can blindly invest once the weekly candle closes above the breakout line and stay invested forever. Also these stocks breakouts are lifelong predictions, it means technically these breakouts happen giving more returns in the longer runs. Hence, even when the scrip makes a loss of 10% / 20% / 30% / 50%, the stock will regain and turn around. Once they again enter the same breakout level, they will flyyyyyyyyyyyy like a ROCKET if held in the portfolio in the longer run.
Time makes money, GREEDY & EGO will not make money.
Also, magically these breakouts tend to prove that the companies turn around and fundamentally becoming strong. Also the magic happens when more diversification is done in various sectors under various scripts with equal money invested in each N500 scripts.
The real deal is when to purchase and where to purchase the stock. That is where Breakout study comes into play.
LET'S PUMP IN SOME MONEY AND REVOLUTIONIZE THE NATION'S ECONOMY!
