HDFC BANK - KEY BREAKOUT LEVELS FOR 7 JANUARY 2021 For more charts, please contact me via direct message
Breakouttrade

Powergrid Intraday , Breakout Trade.All Logic Explained on chart.
Expecting a good intraday move.
Looks good for positional on weekly and monthly charts too.
Will post after weekly close.

BREAKOUT CONFIRMED ON WEEKLY CHARTS |LONG SETUP!Stock has indicated clear breakout in today's session and looks pretty much ready for a big move from here, chip in with the stop-loss and targets mentioned on chart. Some aggressive bullish movement is expected now.

CIPLA BREAKOUT Cipla is at a very crucial level and retested the resistance as well
if Cipla break its all-time high = 839 you can enter and get your target as 1:2
SL will be the previous low as per price action theory = 817

WIPRO | RR 1:4 | Pre-Breakout=====================================================
⭕ Positional Trading Opportunity ! Daily Chart Alert !!! ⭕
--Buy above = 368 (Breakout)
--Stop-loss = 355
--Target's = 400 | 420
--R:R = 1:4
--Pattern's = Triangle Pattern | Flag Pattern
#ThankU For Checking Out My Content , I Hope U Liked IT 📌
======================================================
⭕ Technical Reasons to trade or Strategy applied :- ⭕
1) Wait For Clear Entry
2) Watch Out For Volume After Pattern Breakout / At Breakout Candle
3) All IT Stock's & IT Index Is In Uptrend , Stock Is Trading Above 200DMA
4) Overall Stock looking Bullish...
📈(Risk Must Be Managed.)
🙄Keep Your Eyes On Index
======================================================
Guys Check Out MY Related Ideas As Well, You Will Found Them Really Useful, GUARANTEED !
🙏FOLLOW for more !
👍LIKE if you found it useful !
✍COMMENT Below your view !
----------Any Suggestions----------

ADANI PORTSNSE:ADANIPORTS | (Positional Trade)
Look For BuY (After Breakout)
Entry :- 368+
Stop Loss :- 350
Target's 👇
1st = 388
2nd = 415
(Risk Must Be Managed.)
Keep Your Eyes On Index
Give Me A Thumbs Up...👍
😜Follow For More ✔
--Any Suggestions--

RELIANCE INDUSTRIES | RR 1:2.5 | Triangle Pattern(Intraday / Swing / Positional) | RR 1:2.5+ | Type:- Pre - Breakout/Retest
Reasons To Trade🤔 :- Stock Is In Overall Uptrend, Above 200DMA, Market & Sector Leader, Ready To Break - Triangle Pattern .
Entry :- 2040 (After Breakout)
Stop Loss :- 1985
Target's :- 2175 | 2300
(Risk Must Be Managed.)
Keep Your Eyes On Index
Follow For More 🤝
Give Me A Thumbs Up.. 👍
Comment Below 👨💻
--Any Suggestions--


COLPAL VIEW - CONTINUATION 🎯🎯🎯IN MY PREVIOUS SHARED IDEA
WE COULD CATCH THE MOVE FROM 1535 TILL 1560 WHICH WAS THE TARGET LEVEL GIVEN
FOR NOW IT HAS MOVED BEYOND TARGET LEVEL
CMP @ 1570 +++
WHAT NOW FROM HERE ???
PERSONAL VIEW:-
ON DAILY CHART, SCRIPT IS RUNNING @ TOP OF A TREND LINE
WHICH HAS BEEN TESTED MANY TIMES AND NOT BREACHED SINCE MAY'20
LOOKING @ THE CURRENT MOMENTUM THERE CAN BE A POSSIBILITY TO BREAK THE TREND LINE
AND GO FURTHER UP OR A DIP BACK TO OLD ENTRY LEVEL
POINTS TO BE CONSIDERED :-
>>> LOOKING @ MOVING AVG'S - SCRIPT IS FAR AWAY FROM 20, 50, 200 MA - BREAKOUT FAR AWAY HAS MORE STRENGTH
>>> VOLUME PART AS OF NOW HAS THOUGH NOT BEEN GREAT WHICH CUD HAD BEEN A GREAT FACTOR
>>> OSCILLATORS OVERALL ARE NEUTRAL
PIVOT LEVEL SUGGESTION :>
RESISTANCE 1 = 1570
RESISTANCE 2 = 1625
RESISTANCE 3 = 1745
PIVOT = 1522
SUPPORT 1 = 1460
SUPPORT 2 = 1410
SUPPORT 3 = 1300
TRADE SUGGESTION :-
* BUY ON BREAKOUT KEEPING ABOVE PIVOTS IN MIND
* WAIT FOR A DIP BACK TO 1520-1535 TO ENTER
***DISCLAIMER - FOR STUDY PURPOSE ONLY***
BELOW IS OLD IDEA POSE FOR REFERENCE >>>>>

MINDTREE(Swing / Positional Trade) | RR 1:2+ | Type:- Breakout & Retest
Reasons To Trade 🤔 :- Pattern Breakout, Taking Good Support At 50 DMA, Bullish Stock.
Entry :- 1360
Stop Loss :- 1322
Target :- 1450
(Risk Must Be Managed.)
Keep Your Eyes On Index
😜Follow For More ✔
Give Me A Thumbs Up...👍
--Any Suggestions--

BANDHAN BANK(Swing / Positional Trade) | RR 1:3+ | Type:- Breakout
Reasons To Trade 🤔 :- Head & Shoulders Pattern , Bullish Banknifty , Above 200DMA , Global Market Bullish.
Entry :- 334 (Only Enter After Clear Breakout Or Opening Above Trendline).
Stop Loss :- 313
Targets :- 1st= 365 | 2nd= 395
(Risk Must Be Managed.)
Keep Your Eyes On Index
😜Follow For More ✔
Give Me A Thumbs Up...👍
--Any Suggestions--

PIDILITE INDUSTRIES(Swing / Positional Trade) | RR 1:3+ | Type:- Breakout
Reasons To Trade🤔 :- Weekly Resistance + Triangle Breakout, Big Candle + Volume Confirmation, Stock In Weekly Uptrend + Above 200DMA.
Entry :- 1520 - 1530
Stop Loss :- 1472
Target :- 1669
(Risk Must Be Managed.)
Keep Your Eyes On Index
😜Follow For More ✔
Give Me A Thumbs Up...👍
--Any Suggestions--

DR REDDYS LABS(Intraday / Swing Trade) | RR 1:2.8+ | Type:- Breakout
Reasons To Trade🤔 :- In Uptrend, Making Higher High's, Above 200DMA, Forming Continuation Pattern, Overall Sector is Bullish.
Entry :- 5200
Stop Loss :- 5100
Target :- 5480
(Risk Must Be Managed.)
Keep Your Eyes On Index
😜Follow For More ✔
Give Me A Thumbs Up... 👍
--Any Suggestions--

Mahindra & MahindraLook For Buy (Positional)
Entry :- 655 to 660
SL :- 634.50 or 627.60
T1 :- 669.80
T2 :- 682.20
T3 :- 702.20
T4 :- 734.60
Keep Your Eyes On Index
(Risk Must Be Managed.)
Give Me A Thumbs Up...👍
😜Follow For More ✔
--Any Suggestions--

Hindustan Petrol: AnalysisKeep an eye on Hindustan Petrol. Expected momentum is in upward direction.
.
Reason to Buy:
1) Forming a triangle pattern
2) Taking support on weekly as well as daily trend line.
3) Formation of 'W-Pattern' (wait for neck line break)
.
Stop-loss must be below the previous immediate swing. RR ratio must be calculated and traded accordingly.

NBCC Short term pickAbove sustaining 26.40 can show 28/30/33.50 with support of 24.80....short term pick

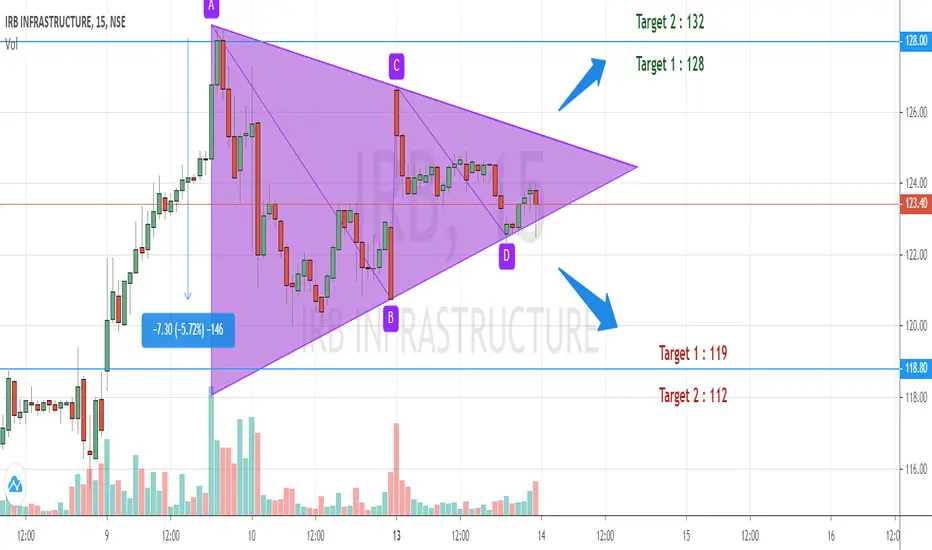
Triangle Breakout!!TRADING PSYCHOLOGY : The stock forms a triangle pattern when the tug of war between BULLS and BEARS is at the end stage where one is bound to give up.
AC line will act as resistance line.
BD line will act as support line.
when to trade : The candlestick has to break the support/resistance line with increasing volume to confirm the direction.
STOP LOSS: If the breakout is upwards then support line will act as stop loss.
If the breakout is downwards then resistance will act as stop loss.
PS : This is 15 minute candlestick chart so the targets are most likely to achieve in 1-2 days.
The accuracy of this strategy is 80%.
RBL Bank breakout but in Acuumulation ZoneRBL Bank breakout but it is in Acuumulation Zone. WE need to keep a watch on this stock as for 2 months it has been into accumulation zone. it has some hurdles to reach to 140, but once it reaches 140 it will be ready to fly, So keep this stock in your watchlist.

Buy DLF above 160 TARget 170 to 177 PositionalBuy DLF above 160 TARget 170 to 177 Positional. A Clear cut breakout with heavy volume there is a stiff resistance at 160 once it crosses it will move higher to target of 170 to 177

Ujiivan Finance Clean BreakoutUjiivan Finance Clean Breakout with heacy volume, See chart for support and resistance.. will act as a target for buy side if market is bearish then we will sell it and our support becomes our target....

GILLETTE INDIA | Monthly BreakoutGillette produces a monthly breakout. After a consolidation for a period of 16 months, price broke out in April very strongly. Technically, the consolidation phase can be considered as a bullish continuation pattern i.e. Bull flag and that means a big uptrend is only about to begin. Technically speaking, potential for the upside is nearly 45%.

ITC Long Above 286All details of trade in chart.
BreakOut Trade Pattern.
As the trade is still to get active thus RR is not that much great but if in any case any pin bar or any other price action gets into play at resistance will update the trade. Be quick in taking and booking trade as the trade is on 15 min chart.
CASM!!! ENJOY!!!
