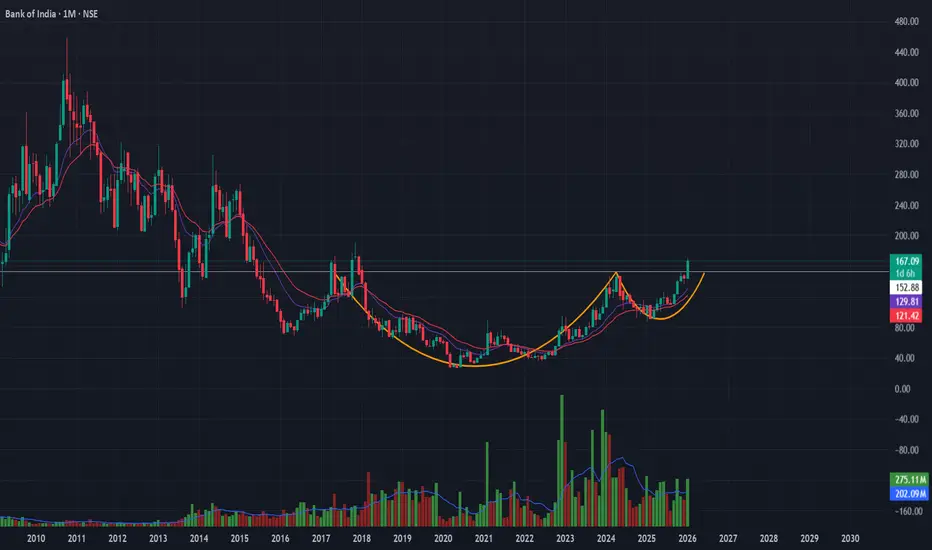
Bank of India | Cup & Handle Breakout SetupStructure:
Long-term Cup & Handle pattern nearing completion on monthly timeframe, indicating accumulation after a prolonged base.
Confirmation Signals:
-Volume expanding on rallies
-RSI above 50 and rising
-OBV trending higher → accumulation visible
-Price holding above short-term EMAs
Trade Plan:
-Buy: Sustained breakout above ₹151
-Targets: ₹199 → ₹268
-Stop-loss: ₹134 (ATR-based, structure-valid)
-Risk–Reward: ~1:5
Breakouttrading
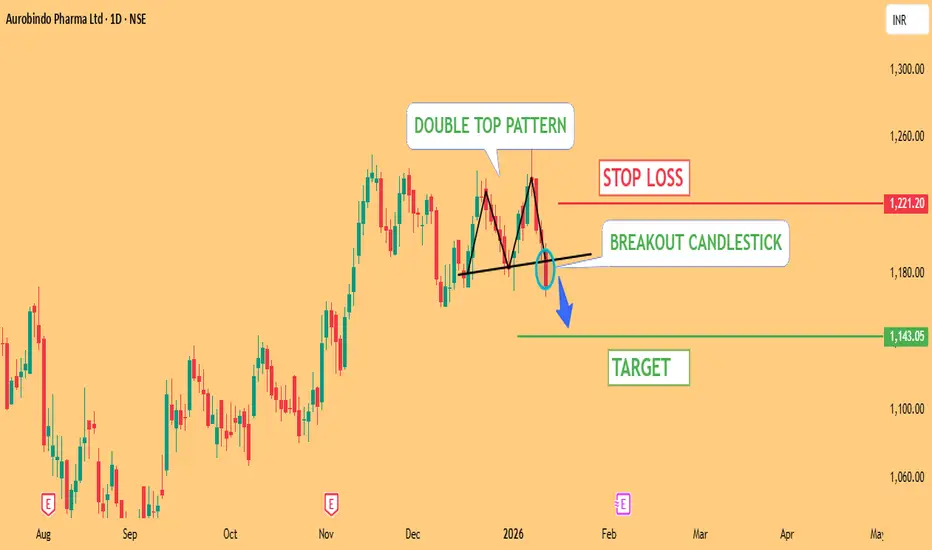
AUROBINDO PHARMA – Bearish Breakdown patternAurobindo Pharma has broken down from a Double Top pattern , confirming bearish momentum.
🔻 Structure: Double Top Breakdown
🔻 Trend: Bearish
🔻 Volume: Breakdown supported by selling pressure
Trade Setup (Short):
Entry: Below Double Top neckline (breakdown zone)
Target: 1143 🎯
Stop Loss: 1221 ⛔
As long as price stays below 1221, downside pressure may continue. A decisive move towards 1143 is expected if bears maintain control.
⚠️ Disclaimer: This is for educational purposes only. Not financial advice. Manage risk properly.
BUY TODAY SELL TOMORROW for 5% - BTST STOCK OPTIONDON’T HAVE TIME TO MANAGE YOUR TRADES?
- Take BTST Stock Option trades at 3:25 pm every day
- Try to exit by taking 4-7% profit of each trade
-Cup & Handle Breakout in DALBHARAT
BUY TODAY, SELL TOMORROW for 5%

BUY TODAY SELL TOMORROW for 5%DON’T HAVE TIME TO MANAGE YOUR TRADES?
- Take BTST trades at 3:25 pm every day
- Try to exit by taking 4-7% profit of each trade
- SL can also be maintained as closing below the low of the breakout candle
Now, why do I prefer BTST over swing trades? The primary reason is that I have observed that 90% of the stocks give most of the movement in just 1-2 days and the rest of the time they either consolidate or fall
Resistance Breakout in MTARTECH
BUY TODAY SELL TOMORROW for 5%

BUY TODAY SELL TOMORROW for 5%DON’T HAVE TIME TO MANAGE YOUR TRADES?
- Take BTST trades at 3:25 pm every day
- Try to exit by taking 4-7% profit of each trade
- SL can also be maintained as closing below the low of the breakout candle
Now, why do I prefer BTST over swing trades? The primary reason is that I have observed that 90% of the stocks give most of the movement in just 1-2 days and the rest of the time they either consolidate or fall
Resistance Breakout in MRPL
BUY TODAY SELL TOMORROW for 5%

BUY TODAY SELL TOMORROW for 5%DON’T HAVE TIME TO MANAGE YOUR TRADES?
- Take BTST trades at 3:25 pm every day
- Try to exit by taking 4-7% profit of each trade
- SL can also be maintained as closing below the low of the breakout candle
Now, why do I prefer BTST over swing trades? The primary reason is that I have observed that 90% of the stocks give most of the movement in just 1-2 days and the rest of the time they either consolidate or fall
Cup & Handle Breakout in PNB
BUY TODAY SELL TOMORROW for 5%

BUY TODAY SELL TOMORROW for 5% - BTST STOCK OPTIONDON’T HAVE TIME TO MANAGE YOUR TRADES?
- Take BTST Stock Option trades at 3:25 pm every day
- Try to exit by taking 4-7% profit of each trade
-Cup & Handle Breakout in DALBHARAT
BUY TODAY, SELL TOMORROW for 5%

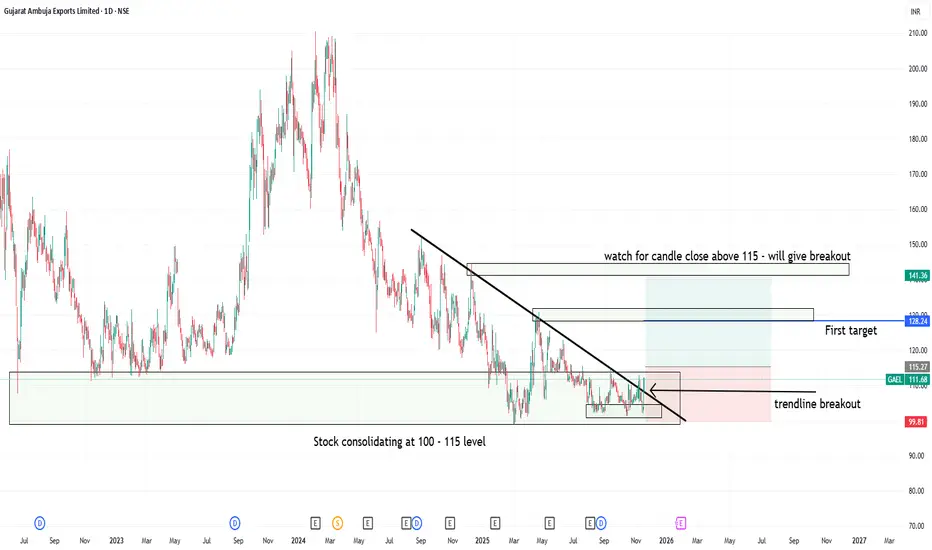
Trendline breakout at support level in GAEL1. Gujrat ambuja export lt- showing consolidation at 100 to 115 levels
2. Candle close above 115 can trigger consolidation breakout at strong support zone
3. Trendline breakout has already happend but above 115 close will be safe and logical
4. Good Risk:Reward one can watch for upside movement with strict sl level
BUY TODAY SELL TOMORROW for 5% - BTST STOCK OPTIONDON’T HAVE TIME TO MANAGE YOUR TRADES?
- Take BTST Stock Option trades at 3:25 pm every day
- Try to exit by taking 4-7% profit of each trade
-Resistance Breakout in ASIANPAINT
BUY TODAY, SELL TOMORROW for 5%

BUY TODAY SELL TOMORROW for 5%DON’T HAVE TIME TO MANAGE YOUR TRADES?
- Take BTST trades at 3:25 pm every day
- Try to exit by taking 4-7% profit of each trade
- SL can also be maintained as closing below the low of the breakout candle
Now, why do I prefer BTST over swing trades? The primary reason is that I have observed that 90% of the stocks give most of the movement in just 1-2 days and the rest of the time they either consolidate or fall
Resistance Breakout in KROSS
BUY TODAY SELL TOMORROW for 5%

BUY TODAY SELL TOMORROW for 5%DON’T HAVE TIME TO MANAGE YOUR TRADES?
- Take BTST trades at 3:25 pm every day
- Try to exit by taking 4-7% profit of each trade
- SL can also be maintained as closing below the low of the breakout candle
Now, why do I prefer BTST over swing trades? The primary reason is that I have observed that 90% of the stocks give most of the movement in just 1-2 days and the rest of the time they either consolidate or fall
Resistance Breakout in EIFFL
BUY TODAY SELL TOMORROW for 5%

BUY TODAY SELL TOMORROW for 5%DON’T HAVE TIME TO MANAGE YOUR TRADES?
- Take BTST trades at 3:25 pm every day
- Try to exit by taking 4-7% profit of each trade
- SL can also be maintained as closing below the low of the breakout candle
Now, why do I prefer BTST over swing trades? The primary reason is that I have observed that 90% of the stocks give most of the movement in just 1-2 days and the rest of the time they either consolidate or fall
Consolidation Breakout in KAPSTON
BUY TODAY SELL TOMORROW for 5%

National Aluminium Company Limited - Breakout Setup, Move is ON.#NATIONALUM trading above Resistance of 331
Next Resistance is at 443
Support is at 228
Here are previous charts:
Chart is self explanatory. Levels of breakout, possible up-moves (where stock may find resistances) and support (close below which, setup will be invalidated) are clearly defined.
Disclaimer: This is for demonstration and educational purpose only. This is not buying or selling recommendations. I am not SEBI registered. Please consult your financial advisor before taking any trade.

National Aluminium Company Limited - Breakout Setup, Move is ON.#NATIONALUM trading above Resistance of 216
Next Resistance is at 331
Support is at 142
Here are previous charts:
Chart is self explanatory. Levels of breakout, possible up-moves (where stock may find resistances) and support (close below which, setup will be invalidated) are clearly defined.
Disclaimer: This is for demonstration and educational purpose only. This is not buying or selling recommendations. I am not SEBI registered. Please consult your financial advisor before taking any trade.

Thangamayil Jewellery Triangle Breakout in Daily TFThangamayil has confirmed a triangle breakout on the daily timeframe, indicating a shift from consolidation to expansion.
🔹 Breakout Level: 3,779
🔹 Upside Target / Next Supply Zone: 4,107
🔹 Key Support (Demand Zone): 3,140
The stock spent multiple sessions compressing within a Ascending triangle, forming higher lows — a classic sign of accumulation.
The breakout came with improved participation, suggesting buyers are gaining control.
As long as price sustains above the breakout zone, the structure remains bullish, and pullbacks may be viewed as retests rather than reversals.
A close back inside the pattern would weaken the breakout setup.
Company Overview
Thangamayil Jewellery Ltd is a well-known South India–focused jewellery retailer, primarily operating in Tamil Nadu.
The company specializes in gold, diamond, and silver jewellery, catering largely to wedding and festive demand.
With a strong regional brand presence and expansion into new stores, Thangamayil benefits from:
Consistent rural & semi-urban demand
High brand trust in South India
Seasonal tailwinds during festivals and marriage seasons
For analysis of any stock, feel free to comment the stock name below.
This analysis is for educational and informational purposes only. It does not constitute investment advice or a recommendation to buy or sell any security. Market investments are subject to risk, and past performance does not guarantee future results. Please consult a SEBI-registered financial advisor before making any investment decisions. The author is not responsible for any losses or gains arising from the use of this information.

Kalyan Jewellers – Elliott Wave analysis for breakout.Kalyan Jewellers – Elliott Wave Validation (Daily Chart, IST)
Big Picture Structure
• Primary trend: Bullish
• Current degree: Wave (5) in progress
• Wave (4): Completed near ₹440–445
• Market is now transitioning from early Wave (5) into impulsive expansion
________________________________________
Role of the Inverted Head & Shoulders (IH&S)
• IH&S has formed after Wave (4) → classic trend-resumption pattern
• This pattern is acting as:
o A reversal from correction
o A launchpad for Wave (5)
Key Pattern Levels
• Head: ~₹440–445 (Wave 4 low)
• Left Shoulder: ~₹495–505
• Right Shoulder: ~₹485–495
• Neckline: ~₹520–525
________________________________________
Breakout Condition (Critical Point)
If today’s candle closes 515 , it confirms breakout
More precisely:
• Daily close above ₹515 with volume
= Confirmed IH&S breakout
= Start of impulse inside Wave (5)
Projected Targets – Elliott-Compliant
Targets are valid Fibonacci expansions from Wave (4) low.
Reference Points
• Wave (4) low: ~₹445
• Breakout zone: ~₹525
🎯 Targets Explained
Target Basis
₹610 0.618 extension of Wave (5)
₹699 Equality with prior Wave (1) / mid expansion
₹799 1.618 extension → typical Wave (5) extreme
✔ All three targets are Elliott-legal and realistic
✔ ₹799 also aligns with previous Wave (3) high, which is common in Wave (5)

BUY TODAY SELL TOMORROW for 5% - BTST STOCK OPTIONDON’T HAVE TIME TO MANAGE YOUR TRADES?
- Take BTST Stock Option trades at 3:25 pm every day
- Try to exit by taking 4-7% profit of each trade
-Resistance Breakout in DIVISLAB
BUY TODAY, SELL TOMORROW for 5%

SRF LTD: Price Compression at Key Resistance|Clean Breakout Play📌 Structure: Daily Timeframe
SRF has been consolidating inside a clean descending channel, printing lower highs while demand holds near the channel base.
Price is now pressing against well-tested channel resistance — a clear decision zone.
🔴 Key Reads
Descending resistance respected multiple times
Tight price compression near supply → volatility contraction
Buying interest visible near demand
Muted volume during consolidation → pre-expansion behaviour
This is structure-led, not momentum-driven.
🟢 Breakout Rules (Strict)
Trade triggers only if:
Strong green Marubozu / near-Marubozu
Daily close above descending resistance
Clear volume expansion
No close above resistance = no trade.
🎯 Trade Plan
Entry: Breakout close
SL: Low of breakout candle
Target 1: ₹3300, then trail
Management: Trail via higher lows / structure
Defined risk. Reward from range expansion, not prediction.
🧠 Why It Works
- Long consolidation builds energy
- Repeated rejections weaken supply
- Channel breakouts often expand fast
Clean price + volume = institutional participation
⚠️ Invalidation
Weak breakout
Low volume
Rejection wick with close back inside channel
→ No trade
📊 Final Word
SRF is coiled, not weak.
Patience first. Execution only on confirmation.
➡️ Let price prove strength. 👍 Appreciate if this helps.
⚠️ Disclaimer
This is a technical study for educational purposes only, based purely on price action and volume.
Not financial advice. Please manage risk as per your own trading plan.
🔔 Follow
If you like clean, no-indicator, price–volume based setups,👉 Follow for more structure-led trade ideas and chart studies.
💬 Your Turn
Have a stock you want analysed using pure price action & volume?
Drop the name in the comments — I’ll pick a few and share clean charts.

BUY TODAY SELL TOMORROW for 5%DON’T HAVE TIME TO MANAGE YOUR TRADES?
- Take BTST trades at 3:25 pm every day
- Try to exit by taking 4-7% profit of each trade
- SL can also be maintained as closing below the low of the breakout candle
Now, why do I prefer BTST over swing trades? The primary reason is that I have observed that 90% of the stocks give most of the movement in just 1-2 days and the rest of the time they either consolidate or fall
Trendline Breakout in AVANTIFEED
BUY TODAY SELL TOMORROW for 5%

Bank of Maharashtra trade for 18-20% upside.**Bank of Maharashtra (Weekly Chart – NSE)**
The stock has **completed its Wave-4 corrective phase** and subsequently formed a **clear Inverse Head & Shoulders (iH&S) pattern**, signalling the start of a **fresh impulsive move (Wave-5)**.
**Technical Observations**
* Wave-4 correction has ended near ₹45–46, respecting Elliott Wave rules
* iH&S neckline breakout confirms trend reversal
* Momentum indicators (RSI & MACD) support bullish continuation
* Price is holding above the breakout zone with healthy structure
**Strategy**
* **Accumulation Zone:** ₹60 – ₹65
* **Upside Target:** ₹75 – ₹80
* **Potential Upside:** ~18–20% from current levels
As long as the price sustains above the accumulation range, the structure remains constructive for further upside in the ongoing **Wave-5**.
This setup favours **accumulate-on-dips** rather than chasing extended candles.
---

Nibe Ltd – Elliott Wave UpdateNibe Ltd – Elliott Wave Update
Nibe Ltd has reversed decisively from the 78.6% Fibonacci retracement, completing a textbook ABC corrective structure. The reversal was accompanied by clear bullish divergence on RSI and MACD, confirming exhaustion of the corrective phase.
Following the reversal:
Wave 1 of the new impulsive structure is complete
Wave 2 has unfolded as a shallow, time-wise correction
Price is now trading in Wave 3, supported by expanding momentum and rising volume
As long as price holds above the recent swing low (~₹1,030), the impulsive structure remains valid. Momentum indicators continue to support further upside, suggesting the trend is in an acceleration phase rather than exhaustion.
Trend Bias: Bullish
Structure: Impulsive (Wave 3 in progress)
Minimum Target: ₹1,700
Invalidation Level: Below the Wave-2 low

BUY TODAY SELL TOMORROW for 5%DON’T HAVE TIME TO MANAGE YOUR TRADES?
- Take BTST trades at 3:25 pm every day
- Try to exit by taking 4-7% profit of each trade
- SL can also be maintained as closing below the low of the breakout candle
Now, why do I prefer BTST over swing trades? The primary reason is that I have observed that 90% of the stocks give most of the movement in just 1-2 days and the rest of the time they either consolidate or fall
Resistance Breakout in GNA
BUY TODAY SELL TOMORROW for 5%

Breakout in Nifty Auto...Chart is self explanatory. Levels of breakout, possible up-moves (where index may find resistances) and support (close below which, setup will be invalidated) are clearly defined.
Disclaimer: This is for demonstration and educational purpose only. This is not buying or selling recommendations. I am not SEBI registered. Please consult your financial advisor before taking any trade.
