#IPCALAB - Rounding Bottom Breakout in DTF / Keep in WL📊 Script: IPCALAB
Key highlights: 💡⚡
📈 Rounding Bottom Breakout in Daily Time Frame
📈 Price consolidating near Resistance, then Breakout
📈 Volume spike during Breakout
📈 MACD Bounce
📈 Can go for a swing trade
BUY ONLY ABOVE 1535 DCB
⏱️ C.M.P 📑💰- 1518
🟢 Target 🎯🏆 – 12%
⚠️ Stoploss ☠️🚫 – 6%
⚠️ Important: Market conditions are Okish, Position size 50% per Trade. Protect Capital Always
⚠️ Important: Always Exit the trade before any Event.
⚠️ Important: Always maintain your Risk:Reward Ratio as 1:2, with this RR, you only need a 33% win rate to Breakeven.
✅Like and follow to never miss a new idea!✅
Disclaimer: I am not SEBI Registered Advisor. My posts are purely for training and educational purposes.
Eat🍜 Sleep😴 TradingView📈 Repeat 🔁
Happy learning with MMT. Cheers!🥂
Breakouttrading
TATA CHEMICALS LTD – Cup & Handle BreakoutTata Chemicals has formed a classic “Cup and Handle” formation on the daily chart – a bullish continuation pattern indicating accumulation followed by breakout potential. This is a well-respected setup among technical traders and often leads to sharp upside momentum once the neckline resistance is broken.
Key Observations:
* Cup & Handle Formation
The stock has completed a large rounded bottom (the cup) from February to June, followed by a healthy pullback (the handle) in July. This indicates strong base building and investor interest.
* Breakout Level: ₹976–978
The price is now testing the neckline resistance zone around ₹976. A breakout and close above this level would confirm the pattern and open room for further upside.
* Bullish Momentum Building
The recent rally toward resistance has been with rising candles, and a breakout could invite fresh buying interest. Momentum indicators are supportive, and MACD (not shown in chart) is likely to cross bullish on confirmation.
* Volume Confirmation Important
Traders should look for above-average volume on the breakout day to validate the strength of the move.
Final View:
Tata Chemicals is at a crucial technical level. A confirmed breakout above ₹978 could trigger a bullish continuation supported by the strong base. Traders looking for swing opportunities should keep this stock on their radar.

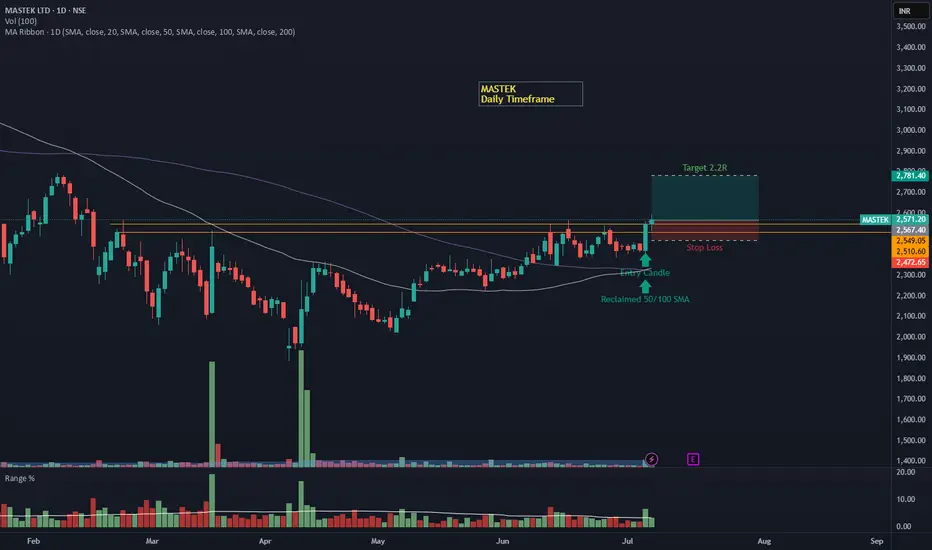
MASTEK – Daily Timeframe Breakout Idea (Resistance Zone Break)MASTEK has broken above a key resistance zone on the daily timeframe, backed by a strong bullish candle and a significant volume surge.
📌 Breakout Context:
The stock consolidated near the ₹2460–2480 zone for several sessions, forming a horizontal resistance zone.
On July 4th, the price broke out with strong bullish momentum, closing above the resistance with a wide-range green candle and a volume spike.
The breakout candle also closed above both 50- and 100-day Simple Moving Averages, confirming a bullish bias.
💡 Trade Setup:
Entry: ₹2550–2570 (near breakout)
Stop Loss: Below the breakout zone at ₹2472
Target: ₹2780+ (2.2R setup)
Risk-Reward: ~1:2.2 (ideal for swing trades)
🎯 Why This Setup Stands Out:
Volume on the breakout day is notably higher than average, confirming institutional interest.
Clean horizontal breakout from a multi-week range.
SMA structure is bullish, with the price reclaiming key MAs.
⚠️ Disclaimer: This post is for educational purposes only and not financial advice. Always consult your financial advisor before making trading decisions.
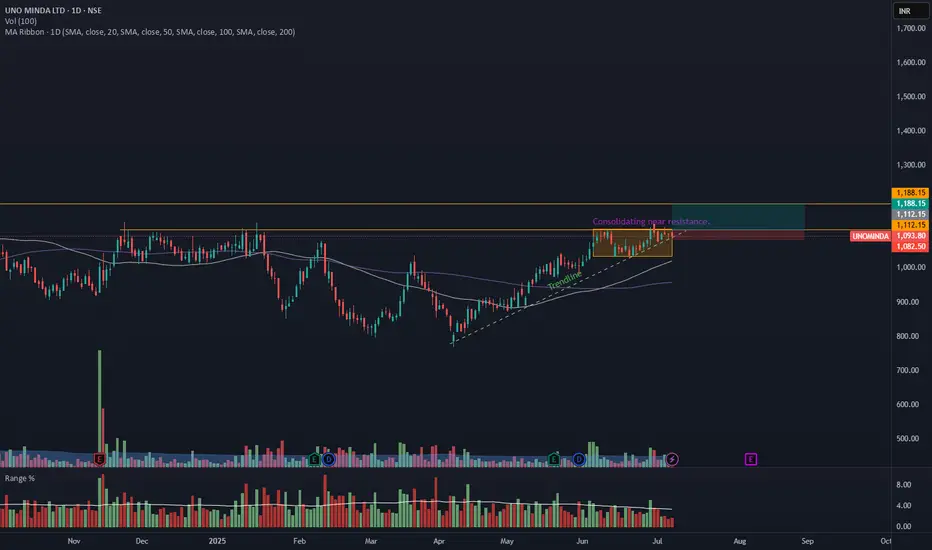
UNOMINDA – Daily Timeframe Breakout Idea (Resistance Zone Break)UNO MINDA LTD. has shown a breakout above a key horizontal resistance level on the daily chart, accompanied by a nearly 1.5 times volume surge near the breakout, as seen earlier, supported by strong momentum.
🔍 Breakout Context:
- Price might break above the ~₹1110 horizontal resistance, which had held for over 6 months.
- Breakout supported by more than average volume and just above average range near the resistance zone.
- The price is also trading above both the 50- and 100-day SMAs, indicating strong trend continuation.
- This aligns with a bullish continuation setup.
📉 Trade Plan:
- CMP: ₹1093
- Entry: Near ₹1112
- Target: ₹1188 (~7% upside from CMP)
- Stop-Loss: ₹1082
- Risk-Reward Ratio: ~1 : 2.0
📌 Note:
- Look for a confirmation candle to enter the trade.
- Avoid chasing the extended move unless confident in intraday momentum.
⚠️ Disclaimer: This post is for educational purposes only and not financial advice. Always do your research or consult a financial advisor before trading.
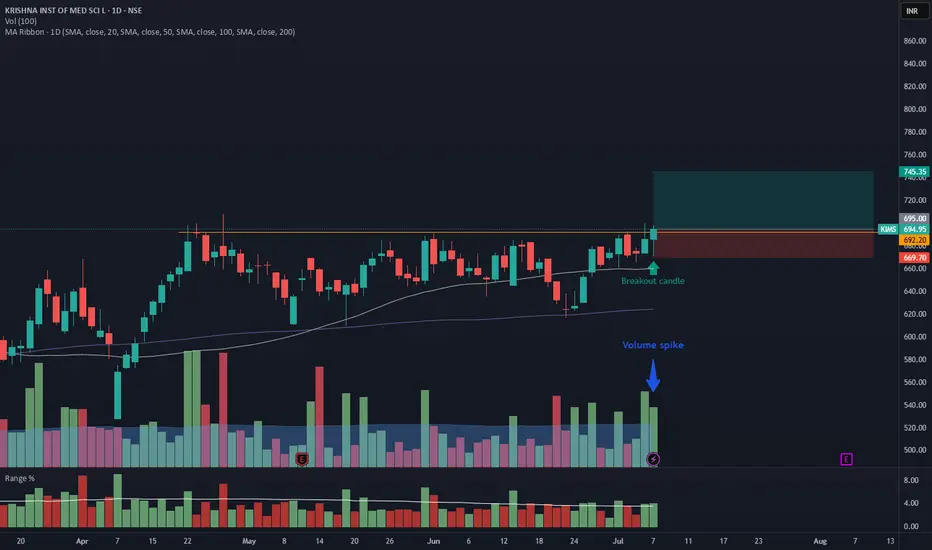
KIMS – Daily Timeframe Breakout Idea (Resistance Zone Break)
KRISHNA INSTITUTE OF MEDICAL SCIENCE has shown a breakout above a key horizontal resistance on the daily chart, accompanied by a ~2x volume surge, supported by strong momentum.
🔍 Breakout Context:
- Price broke above the ~692.20 horizontal resistance, which had held for over 2 months.
- Breakout supported by <2x average volume and just above average range on the breakout candle.
- The price is also trading above both the 50- and 100-day SMAs, indicating strong trend continuation.
- This aligns with a bullish continuation setup.
📉 Trade Plan:
- CMP: ₹694
- Entry: Near ₹695
- Target: ₹746 (~7.25% upside from CMP)
- Stop-Loss: ₹669
- Risk-Reward Ratio: ~1 : 2.0
📌 Note:
- Avoid chasing the extended move unless confident in intraday momentum.
⚠️ Disclaimer: This post is for educational purposes only and not financial advice. Always do your research or consult a financial advisor before trading.
JINDALSTEL : pattern breakout#JINDALSTEL #patterntrading #chartpatternbreakout #swingtrading
JINDALSTEL : Swing Trading
>> Breakout soon
>> Inverse Head & Shoulder pattern
>> Good Strength & Volumes Buildup
>> Trending setup
Swing Traders can lock profits at 10% and keep Trailing
Pls boost, Comment & Follow for more Analysis
Disc : Charts shared are for Learning purpose and not a Trade recommendation. Pls consult your Financial Advisor or a SEBI Registered Advisor before taking position in it

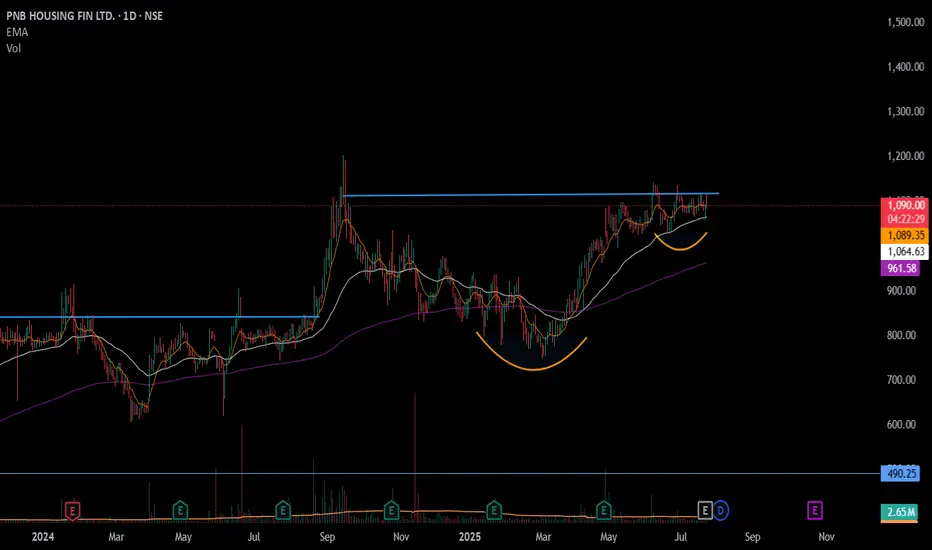
#PNBHOUSING - Keep in WL / C&H Set up in DTF📊 Script:
Key highlights: 💡⚡
📈 Cup & Handel Set up formation in Daily Time Frame.
📈 Price consolidating near Resistance, keep in WL
📈 Wait for Volume spike during Breakout, then Enter
📈 Can go for a swing trade
BUY ONLY ABOVE 1140 DCB
⏱️ C.M.P 📑💰- 1088
🟢 Target 🎯🏆 – NA%
⚠️ Stoploss ☠️🚫 – NA%
⚠️ Important: Market conditions are Okish, Position size 50% per Trade. Protect Capital Always
⚠️ Important: Always Exit the trade before any Event.
⚠️ Important: Always maintain your Risk:Reward Ratio as 1:2, with this RR, you only need a 33% win rate to Breakeven.
✅Like and follow to never miss a new idea!✅
Disclaimer: I am not SEBI Registered Advisor. My posts are purely for training and educational purposes.
Eat🍜 Sleep😴 TradingView📈 Repeat 🔁
Happy learning with MMT. Cheers!🥂
G G Automotive Gears Ltd One-Page Equity ResearchInvestment Thesis – BUY | Target Price ₹300 | Upside ~24%
India’s only listed pure-play traction–gear specialist with 50-year pedigree and >500 OE customers
Rail & Metro orders at record high; Indian Railways raising locomotive build plan by 27% for FY26, driving multi-year volume visibility
Successful diversification into wind-energy, mining & industrial forgings lowers cyclicality and lifts blended margins
Balance-sheet repair complete; net-debt / equity down to 0.53× vs 1.52× in FY23
Snapshot (Standalone)
CommentRevenue (₹ Cr)95.377.336%
EBITDA Margin12.7%10.0%
PAT (₹ Cr)4.431.9497%
EPS (₹)5.322.4544%
ROCE14.9%8.2%
P/E (TTM)26.5×
Market Cap₹ 241 C
Valuation & Target
We apply 32× FY26E EPS (₹9.4) – a 30% discount to peer Elecon (45×) to reflect smaller scale but superior growth trajectory.
Derived Target Price ₹300 (prior ₹241 close), implying 24% upside plus optionality from export traction gears.
Key Catalysts
Indian Railways 100% electrification → higher demand for reduction gearboxes
Metro build-out (20+ cities) – first export order executed FY24 proves capability
Unit-III & IV capacity added FY24 (+30k sq ft) unlocks 35% volume expansion without major capex
Potential government PLI scheme for rail components may grant 6% incentive on sales (not in model).
Risks to Thesis
Lumpy order inflow from Railways could stretch working capital
Alloy-steel price spikes may compress gross margin; 65% raw-material cost is steel
Customer concentration: top-three PSU units >55% of revenue
Small free float → liquidity risk in sharp market Initiate BUY with ₹300 target; accumulate on dips toward ₹220. Recommend watch on quarterly order-book disclosures for traction confirmation.

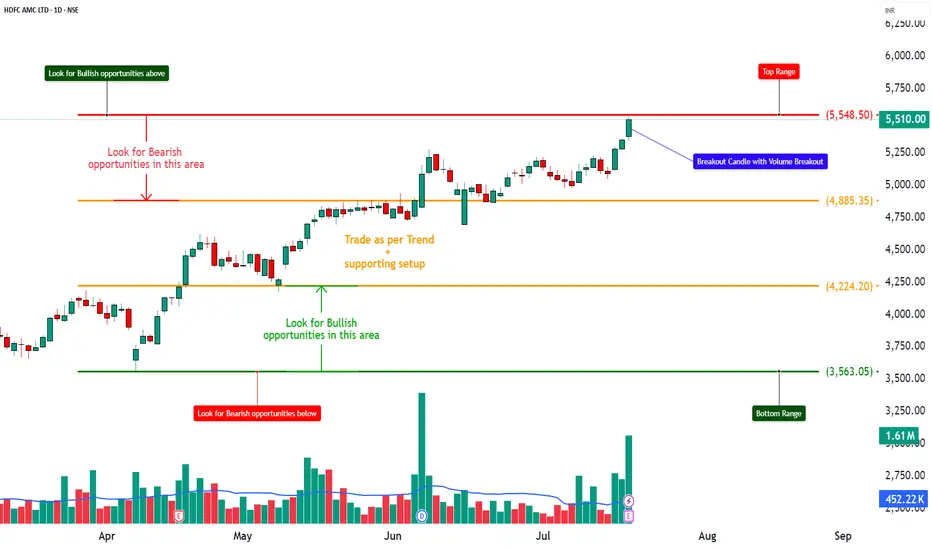
HDFC Asset Management Company Ltd - Long Setup, Move is ON...#HDFCAMC trading above Resistance of 3844
Next Resistance is at 5237
Support is at 2982
Here are previous charts:
Chart is self explanatory. Levels of breakout, possible up-moves (where stock may find resistances) and support (close below which, setup will be invalidated) are clearly defined.
Disclaimer: This is for demonstration and educational purpose only. This is not buying or selling recommendations. I am not SEBI registered. Please consult your financial advisor before taking any trade.

HDFCAMC – Strong Bullish Breakout on High Volume📈 HDFCAMC – Strong Bullish Breakout on High Volume
📅 Setup Date: 18.07.2025 | ⏱ Timeframe: Daily
📍 Strategy: Short-Term HNI Swing Setup
__________________________________________________________________________________
📝 Price Action Summary – HDFCAMC
HDFCAMC has delivered a textbook price action breakout, marked by a wide-range bullish candle on 3x average volume — confirming strong institutional participation. After weeks of tight consolidation and multiple failed attempts near the ₹5,385 resistance zone, the price finally broke out with a clean close near day’s high, indicating minimal selling pressure and clear buyer dominance. The breakout follows a classic compression-before-expansion setup, with the previous range acting as a base for momentum. Importantly, the absence of upper wick, strong follow-through, and volume-backed surge signal genuine strength — not a false breakout. Price has now entered a discovery phase with open space toward ₹5,673–₹5,800. As long as ₹5,385 holds as support, the bulls remain in control, and dip buying remains a high-probability setup. This is a classic case of price action speaking louder than indicators — structure, strength, and story all aligned.
__________________________________________________________________________________Trade Logic – Why This Setup:
Strong Price Structure: The stock has formed a bullish candle backed by a 20-day volume breakout, closing near the highs—indicating strong, sustained demand.
Breakout Confirmation: Price has cleanly broken out from a short-term base formed by multiple candle congestion. It's also trading above the prior resistance level of ₹5,385, confirming breakout strength.
__________________________________________________________________________________ Indicator Confluence: The RSI stands strong at 72, signaling bullish momentum. Additionally, the stock is breaking out of a Bollinger Band squeeze—an early sign of a potential momentum ignition. MACD, CCI, and Stochastic indicators are all aligned in bullish zones across daily, weekly, and monthly timeframes.
EMA Alignment: The stock is trading above all major exponential moving averages (9, 20, 50, 100, and 200 EMA), suggesting healthy trend harmony and support at every timeframe.
VWAP Positioning: Current price action remains well above the daily VWAP, indicating buying interest from institutional players and strong demand zones building underneath.
Volume Spike: Today's volume was 1.61 million, compared to the 10-day average of 452,000—more than a 3x surge, confirming strong buyer conviction and institutional participation.
Open Upside Potential: There are no significant supply zones visible until ₹5,800–₹6,000, offering a clear path for price expansion and swing targets.
Sector Tailwinds: The financial services and AMC sector is witnessing renewed traction after positive earnings and improved fund flow trends, supporting broader strength in related counters.
__________________________________________________________________________________ Would I Enter Now?
YES – Enter Now or on Dip
Reason: Price has just cleared a major volume cluster with strong momentum. Waiting too long might mean missing the breakout. The best approach would be:
• Enter 50% now
• Add 50% near ₹5,495–₹5,485 if there’s an intraday dip
__________________________________________________________________________________ 📈 Resistance Zones
• 🔴 R1: 5,591.5 (possibly weak)
• 🔴 R2: 5,673
• 🔴 R3: 5,797
📉 Support Zones
• 🟢 S1: 5,385
• 🟢 S2: 5,261
• 🟢 S3: 5,179
__________________________________________________________________________________ Direction: Buy (Bullish Bias)
Entry Price: ₹5,510 (Current Market Price)
Alternate Entry: On slight dips to ₹5,485–₹5,495 (ideal risk-managed zone)
Stop Loss: ₹5,385
Reason: This is Support 1 and a key VWAP-based level from the recent volume structure. A breach here invalidates the bullish strength.
Risk–Reward Ratio: 1:1 | 1:2 | +
__________________________________________________________________________________ Overall Bias: Bullish
Spot Price: ₹5,510
Trend: Strong upward momentum
Volatility: Slightly cooling IV (esp. in puts), but still elevated → good for defined-risk strategies
Ideal Strategy Mix: Naked CE or Call Debit Spread (defined-risk bullish strategy)
1. 🔼 Bullish Trade (Naked options as per trend)
Best CE: Buy 5400 CE @ ₹197.95
Why: Strong long buildup with rising OI, high volume, and solid delta — indicating institutional interest and momentum-backed directional strength.
__________________________________________________________________________________ 2. 🔽 Bearish Trade (Naked options as per trend)
Best PE: Sell 5200 PE @ ₹26.5
Why: Strong put writing seen with rising OI and price drop, suggesting low downside risk and income potential if bullish trend holds.
__________________________________________________________________________________
3. ⚙️ Strategy Trade (As per trend + OI data)
Strategy: Call Debit Spread → Buy 5400 CE + Sell 5600 CE
Net Debit: ₹197.95 - ₹92.6 = ₹105.35
Max Profit: ₹200 (spread) - ₹105.35 = ₹94.65
Max Loss: ₹105.35
Risk:Reward ≈ 1 : 0.9
Lot Size: 150
Total Risk: ₹15,802.5
Max Profit: ₹14,197.5
Why: This call spread is ideal because both the 5400 CE and 5600 CE are showing strong long build-up, indicating that traders expect the price to move higher. The 5600 CE has a sharp 168% jump in open interest with high volume, suggesting it’s a realistic target zone. By using a spread (buying 5400 CE and selling 5600 CE), we reduce the upfront cost and limit losses while still capturing upside. It also protects against time decay if the stock consolidates before moving up.
__________________________________________________________________________________ ⚠ Disclaimer (Please Read):
• These Trades are shared for educational purposes only and is not investment advice.
• I am not a SEBI-registered advisor.
• The information provided here is based on personal market observation.
• No buy/sell recommendations are being made.
• Please do your own research or consult a registered financial advisor before making any trading decisions.
• Trading involves risk. Always use proper risk management.
STWP is not responsible for trading decisions based on this post.
__________________________________________________________________________________ 💬 Found this helpful?
Drop your thoughts or questions in the comments below ⬇️
🔁 Share this post with your trading community – let them benefit from clean charts, structured setups, and zone-based learning.
✅ Follow simpletradewithpatience for charts, clean setups, and educational content based on price action, zones, and risk-managed trades.
🚀 Trade with patience, trust your charts, and stay clear-headed!
Be Self-Reliant | Trade with Patience | Learn with Charts & Zones 📊
__________________________________________________________________________________
*********************************************************************************************************************
Caution: This is a result based stock
*********************************************************************************************************************
Buy Mankind Pharma for 15% short term Mankind Pharma
Take entry Near 2600Rs
Target will be 3055( almost 16% upside)
Invest more at 2477
Mankind look likes very bullish
Double bottom pattern perform on up trendline.

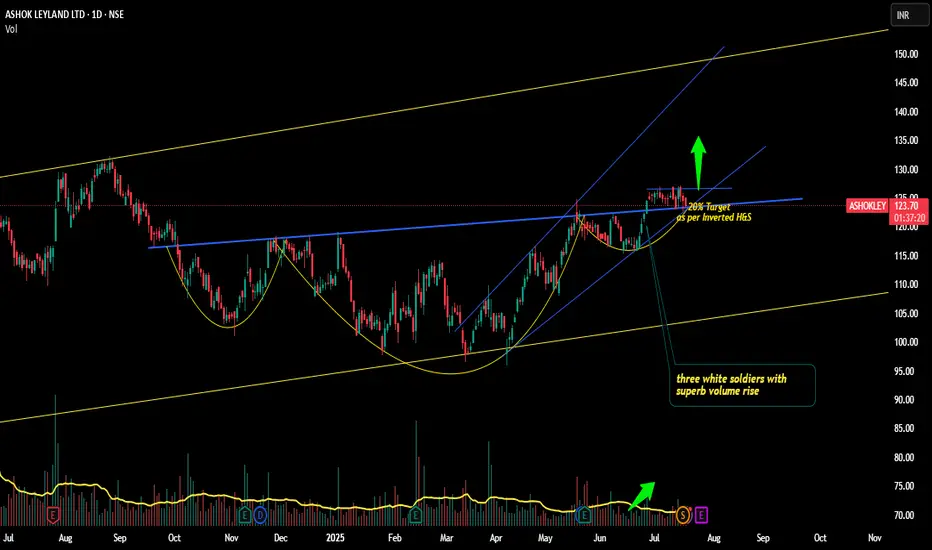
Ashokleyland Truck and Bus loaded with BULLS ?!!Yes!!!!
Chart patterns suggest me the above titled opinion of mine.
Reasons-
1. It's moving in a Ascending channel pattern from MARCH 2020 TILL NOW
2. 3 Upside candles(3 white soldiers) in monthly timeframe(shown below) with good rise in volumes
3. In weekly time frame, Bullish Marubozu candle Breakout seen with good volumes (shown below)
4. Coming to daily time frame, Inverted h&s pattern looks visible and Breakout has happened and now retesting.(there also 3 white soldiers visible)
5. As per pattern , target is about 20% from current levels.(soon to 150 level. )
6. We can enter now with sl as daily close below 120.4, targets -130,138,144 levels
Ashokleyland looks way good for the long term investment (buy and forget) too!! !
This is just my opinion...not a tip nor advice!!!!
Happy trading!!!!
Thank you!!!!
Get VINCOFE for Big Upside in Short termTake entry at cmp 144
Invest More at 111
Target will be 180 ( 25% upside)
We set minimum target for short term...if you hold it for next 2 years then it can be give 100% return

HERO MOTOCORP LTD – TECHNICAL ANALYSIS________________________________________
📈 HERO MOTOCORP LTD – TECHNICAL ANALYSIS
📆 Date: July 15, 2025 | ⏱ Timeframe: Daily Chart
🔍 Educational Breakdown – For Learning & Study Use Only
________________________________________
🔹 Price Action Zones
• 🔴 Top Range (Supply Zone / Resistance): ₹4,486.70
• 🟢 Bottom Range (Demand Zone / Support): ₹4,158.10
Price has recently broken out from a symmetrical triangle pattern, heading toward the marked supply zone. The demand zone at ₹4,158 has been tested multiple times and held firm, acting as the base for this breakout.
________________________________________
🔹 Chart Pattern: ✅
The stock formed a tight triangle consolidation, compressing between a rising support and horizontal resistance. Today’s breakout candle, backed by volume, confirms a bullish resolution of the pattern.
________________________________________
🔹 Reversal Candlestick Patterns
A large bullish engulfing candle has cleared recent highs with strength. Closing near the high, it signals conviction and opens the path for a continued up-move.
________________________________________
🔹 Technical Indicators
• RSI: Crossed above 60 — strength building
• MACD: Positive crossover confirming trend reversal
• VWAP: Price comfortably trading above — supports trend
• Bollinger Bands: Post-squeeze breakout with wide expansion
• Volume: Breakout supported by 20-day volume high — adds strong confirmation
________________________________________
📌 What’s Catching Our Eye:
The volume spike is significant — over 1.76M with breakout from both triangle resistance and VWAP. Add to that a BB Squeeze release, and the setup gets stronger technically.
________________________________________
👀 What We’re Watching For:
If price sustains above ₹4,454, it may move into the next resistance cluster: ₹4,525.97 → ₹4,599.93 → ₹4,730.87. On dips, ₹4,188 and ₹4,158 become important demand zones to monitor for re-entries.
________________________________________
⚠️ Risks to Watch:
A failed follow-up tomorrow or close below ₹4,405 could invalidate the momentum. Also, overbought conditions without volume expansion may lead to a false breakout near ₹4,486.
________________________________________
🔮 What to Expect Next:
If bullish momentum sustains, the stock may first target ₹4,599 and then ₹4,695. Resistance is expected near ₹4,525–₹4,599 range. A clean breakout above ₹4,486 could invite strong follow-up buying.
________________________________________
📊 Trade Plan (Based on Reason and Charts)
🔼 Bullish Trade Setup:
Entry Zone: ₹4,454 – ₹4,465
Stop-loss: ₹4,405.63
Risk–Reward: ~1:1 to 1:2
Reason: Triangle breakout + BB Squeeze + RSI/MACD confirmation + VWAP support
🔽 Bearish Trade Setup:
Only if the price rejects ₹4,486.7 and breaks below ₹4,405:
Entry: Below ₹4,405
SL: ₹4,465
Risk–Reward: ~1:1 to 1:2
Reason: Failed breakout + supply pressure at top range
________________________________________
⚠️ Disclaimer (Please Read):
• This chart is shared for educational purposes only and is not investment advice.
• I am not a SEBI-registered advisor.
• The information provided here is based on personal market observation.
• No buy/sell recommendations are being made.
• Please do your own research or consult a registered financial advisor before making any trading decisions.
• Trading involves risk. Always use proper risk management.
STWP is not responsible for trading decisions based on this post.
________________________________________
💬 Found this helpful?
Drop your thoughts or questions in the comments below ⬇️
🔁 Share this post with your trading community – let them benefit from clean charts, structured setups, and zone-based learning.
✅ Follow @simpletradewithpatience for chart-backed technical analysis that respects price action, demand & supply.
🚀 Trade with patience, trust your charts, and stay clear-headed!
Be Self-Reliant | Trade with Patience | Learn with Charts & Zones 📊
________________________________________

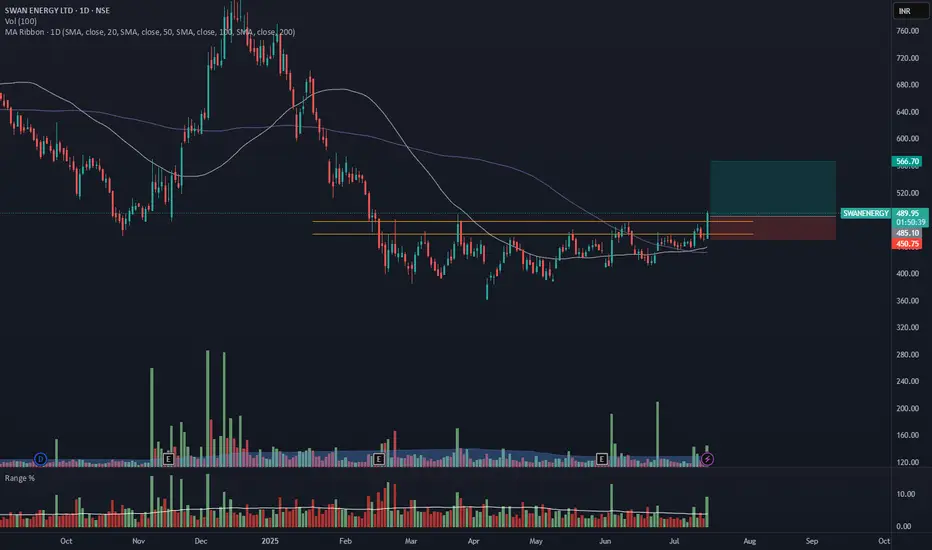
SWANENERGY - Daily Timeframe Breakout (Resistance Zone Break)SWAN ENERGY has shown a breakout above a key horizontal resistance level on the daily chart, accompanied by a nearly 2.5 times volume surge near the breakout zone, as seen earlier, supported by strong momentum.
🔍 Breakout Context:
- Price might break above the ~₹484 horizontal resistance, which had held for over 6 months.
The breakout zone has been supported by 2.5X volume and a range 3X of average near the resistance zone.
- The price is also trading above both the 50- and 100-day SMAs, indicating strong trend continuation.
- This aligns with a bullish continuation setup.
📉 Trade Plan:
- CMP: ₹485.2
- Entry: Near ₹484
- Target: ₹566 (~16.5% upside from CMP)
- Stop-Loss: ₹450
- Risk-Reward Ratio: ~ 1 : 2.3
📌 Note:
- Wait for the closing of this candle, enter the trade near 3:20 PM, or get confirmation on 75min/1Hr TF.
- Avoid chasing the extended move unless confident in intraday momentum.
⚠️ Disclaimer: This post is for educational purposes only and not financial advice. Always do your research or consult a financial advisor before trading.
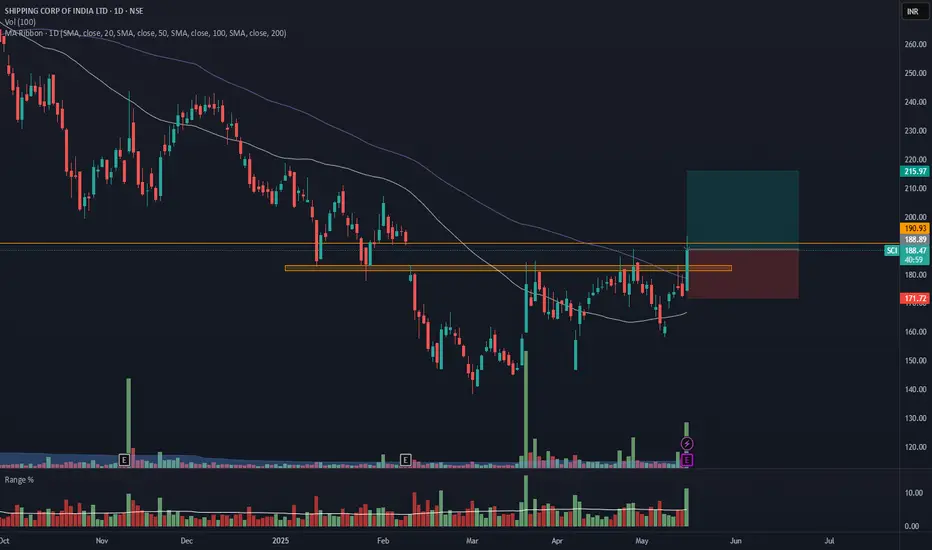
SHIPIING CONTAINERS INDIA - SCI - Breakout from DTFShipping Containers India has resistance weakening on the Daily charts and has given a breakout with good volume.
The target of this pattern signals an upside potential of 15% from the current price level in the medium term.
The stock is trading above its 50- and 100-day exponential moving averages (EMAs). The range is more than 2X, and the Volume is also 3.5X the average.
There is an old support level acting as resistance, which is why the stock won't go over 191. To be safe, wait for the closing price. If it is above 191, it's good.
CMP- Rs. 188
Target Price- Rs216 ( 15% upside)
SL - 171
Disclaimer: This is not a buy/sell recommendation. For educational purpose only. Kindly consult your financial advisor before entering a trade.
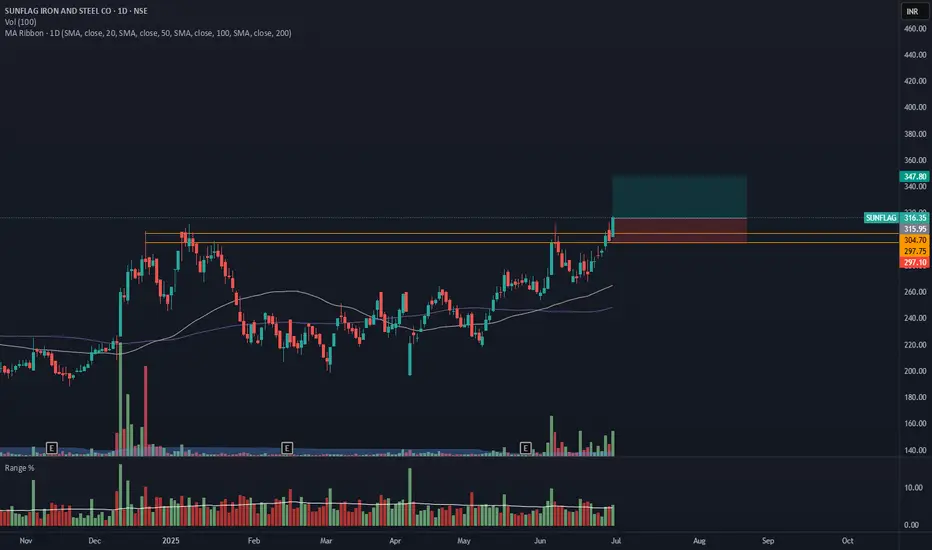
SUNFLAG- Breakout from DTFSUNFLAG has resistance weakening on the Daily charts and has given a breakout with good volume.
The target of this pattern signals an upside potential of 10% from the current price level in the medium term.
The stock is trading above its 50- and 100-day simple moving averages (SMAs). The range is more than 1.2X, and the Volume is also >6X the average.
CMP- Rs. 316
Target Price- Rs347 ( 10% upside)
SL - 297
Disclaimer: This is not a buy/sell recommendation. For educational purpose only. Kindly consult your financial advisor before entering a trade.
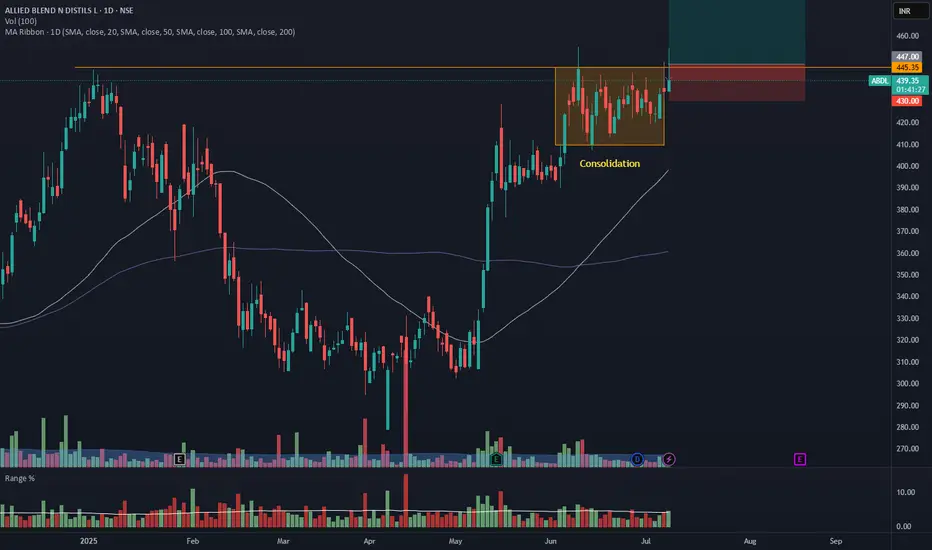
ABDL - Daily Timeframe Breakout Idea (Resistance Zone Break)Allied Blenders and Distillers Ltd. has shown a breakout above a key horizontal resistance level on the daily chart, accompanied by a nearly 2 times volume surge near the breakout zone, as seen earlier, supported by strong momentum.
🔍 Breakout Context:
- Price might break above the ~₹446 horizontal resistance, which had held for over 6 months.
The breakout zone has been supported by 2X volume and a range 1.5X of average near the resistance zone.
- The price is also trading above both the 50- and 100-day SMAs, indicating strong trend continuation.
- This aligns with a bullish continuation setup.
📉 Trade Plan:
- CMP: ₹439.15
- Entry: Near ₹446
- Target: ₹481 (~7.5% upside from CMP)
- Stop-Loss: ₹430
- Risk-Reward Ratio: ~ 1 : 2
📌 Note:
- Look for a confirmation candle to enter the trade.
- Avoid chasing the extended move unless confident in intraday momentum.
⚠️ Disclaimer: This post is for educational purposes only and not financial advice. Always do your research or consult a financial advisor before trading.
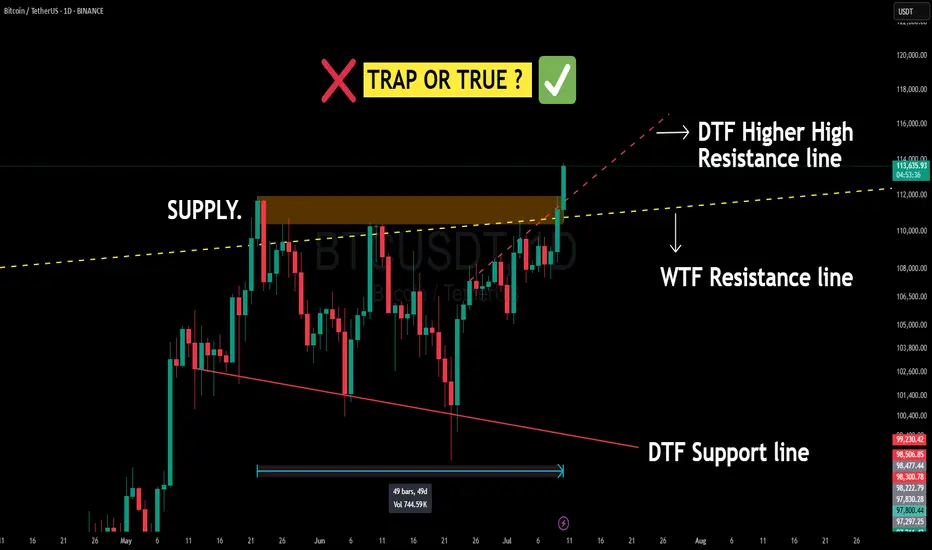
BITCOIN Just Smashed a 50-Day Supply Wall — Breakout or Fakeout Bitcoin (BTC/USDT) on the Daily & Weekly Timeframe just pulled off something BIG:
✅ Broke out of a 50-day consolidation range
✅ Closed above a strong Daily supply zone
✅ Cracked both DTF & WTF resistance lines (including a higher-high dynamic DTF resistance)
✅ Volume confirmation with a strong green candle
📌 This is an extremely bullish structure for short-term scalping ideas.
But Wait — What’s Happening Technically?
Supply Zone: This orange box is where BTC got sold off multiple times before. Breaking above this = strong bullish intent.
⚠️ Caution: Bitcoin is the King of Fakeouts 👑🐍
BTC has a notorious nature for false breakouts, trapping both bulls and bears. That’s why:
🧠 Best Strategy = Trap Trading OR
⏳ Wait for a pullback and retest of broken zones on higher timeframes . Plan your trade - trade your plan .
Don't chase — let price come to you.
💬 Drop your thoughts / doubts in comments.
📌 Not financial advice — just me and my Emotions
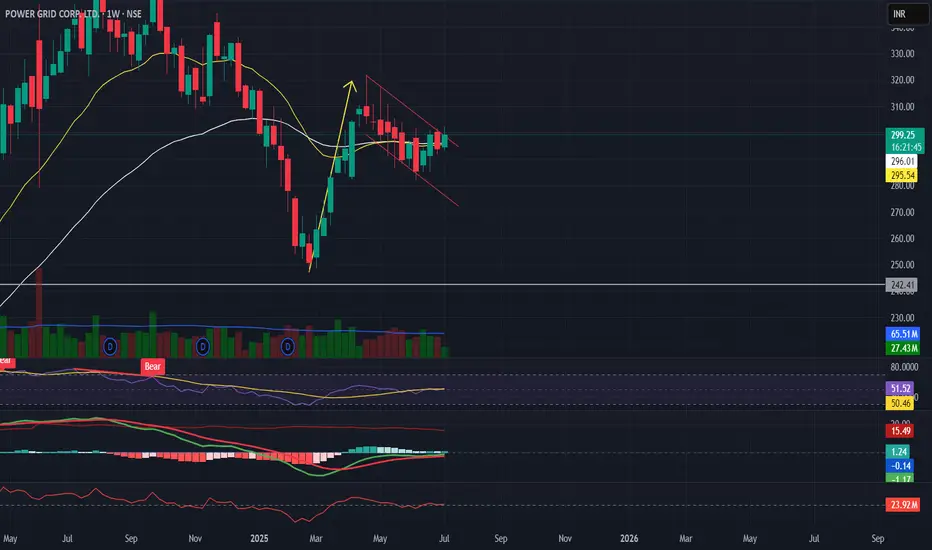
Power Grid Flag Pattern Breakout SetupPower Grid – Breakout Plan
Watching for a clean move above ₹300 level.
Hourly chart shows Cup & Handle formation, while Daily/Weekly has Flag pattern attempting breakout.
✅ Breakout level: ₹300 (confirmation close needed)
✅ Stop-loss: ₹290–294 (below support / ATR-based)
✅ Target 1: ₹328 (Fibonacci 0.618 – Golden Ratio)
✅ Target 2: ₹375 (Measured Move)
Indicators:
EMAs rising on hourly, steady on daily.
RSI strong but nearing overbought on lower timeframe.
MACD positive momentum.
Watching volume for confirmation.
Macro Drivers:
Government infra spending.
Cooling inflation.
Rising electricity demand in India.
✅ Plan: Wait for confirmed breakout with volume. Strict risk management with pre-defined stop.
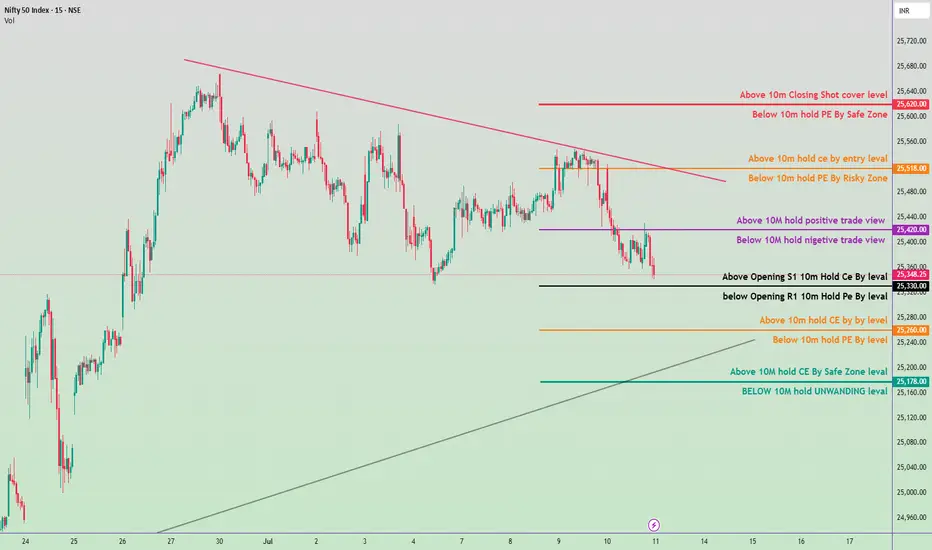
Nifty 50 Intraday Trade Plan 11 july 2025🔴 Resistance & Shorting Zones:
25,620.00
🔹 Above 10m Closing = Short Cover level
🔹 Below 10m = PE by Safe Zone
25,518.00
🔹 Above 10m = Hold CE by Entry level
🔹 Below 10m = PE by Risky Zone
25,420.00
🔹 Above 10m = Hold Positive Trade View
🔹 Below 10m = Negative Trade View
⚖️ Neutral / Opening Zone:
25,348.25 (CMP)
🔸 Above Opening S1 = Hold CE by Level
🔸 Below Opening R1 = Hold PE by Level
🟠 Intermediate Support/Resistance:
25,260.00
🔸 Above 10m = Hold CE by Level
🔸 Below 10m = Hold PE by Level
🟢 Support & Unwinding Zones:
25,178.00
🔹 Above 10m = CE by Safe Zone
🔹 Below 10m = Unwinding Level
📌 Summary:
A move above 25,420 may shift view to bullish/intraday CE hold.
Below 25,260 suggests weakness, possible PE play.
Major support at 25,178, breakdown below this might trigger heavy unwinding.
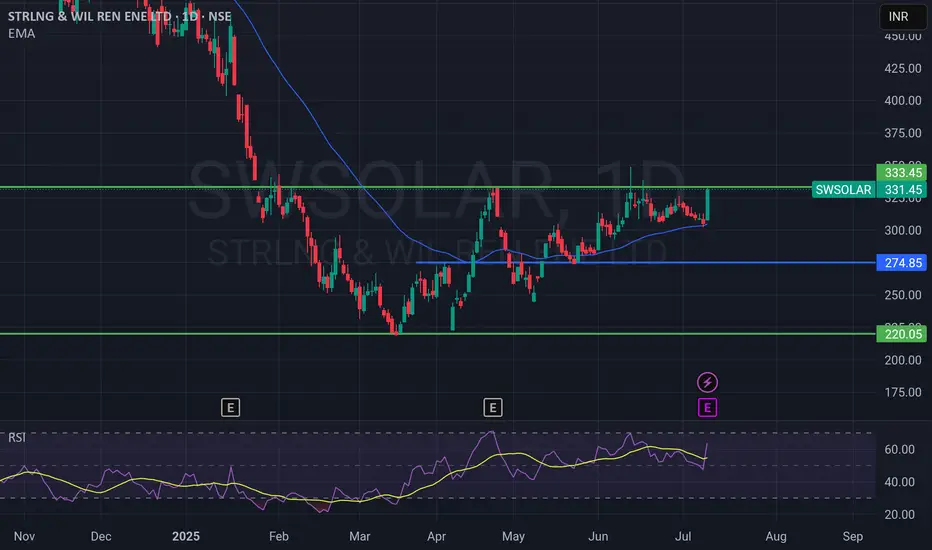
SWSOLAR Breaks Out of Key ResistanceSWSOLAR has given a strong breakout above ₹330 resistance zone with volume support and 8.5% upmove!
Here’s what’s notable:
📈 Breakout above ₹333.45 – a major resistance level.
📊 EMA Support – Price trading above the 50 EMA (~₹304).
💪 RSI at 63.77 – Showing strong bullish momentum but not overbought yet.
🔄 Previous consolidation range was between ₹275 – ₹330.
What to watch next:
Immediate resistance near ₹345–₹360 (if momentum continues).
Support now at breakout zone ~₹330 and strong base at ₹274.
RSI nearing 70 – could see some consolidation before next leg.
📍Possible trade idea:
Long on retest of ₹330 zone with SL below ₹304 EMA.
Target ₹360+ short-term, ₹400 medium-term if strength continues.
📝 What do you think? Is this the start of a fresh uptrend or a fake breakout?
---
🏷️ Tags:
#SWSOLAR #BreakoutStocks #NSEIndia #TechnicalAnalysis #SwingTrading #EMA50 #RSI #CleanEnergyStocks
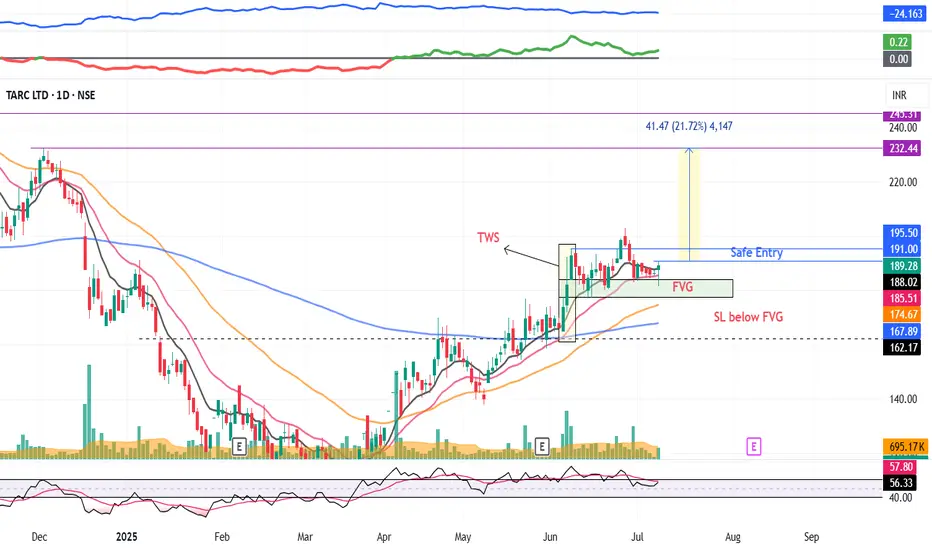
TARC: Swing Pick (Breakout Candidate)#Tarc #swingtrade #threewhitesoldiers #fvg #fairvaluegaps #trendingstock #breakoutstock
TARC : Breakout Candidate
>> Up-trending stock
>> TWS Visible
>> Bounce back from FVG
>> Trending setup
>> Good Volume & Strength
>> Risk Reward Favorable
Swing Traders can lock profit at 10% and keep Trailing
Please Boost, comment and follow us for more Learnings.
Disc : Charts shared are for learning purpose only, not a Trade recommendation. Do your own research and consult your financial advisor before taking any position.