MOTISONS : Breakout Stock#MOTISONS #swingtrade #vcppattern #breakout #trendingstock
MOTISONS : Swing Trade
>> Trending Stock
>> Breakout Candidate
>> VCP pattern
>> Good strength & Volume Buildup
>> Good Upside Potential
Swing Traders can lock profit at 10% and keep Trailing
Please Boost, comment and follow us for more Learnings.
Disc : Charts shared are for learning purpose only, not a Trade recommendation. Do your own research and consult your financial advisor before taking any position.
Breakouttrading

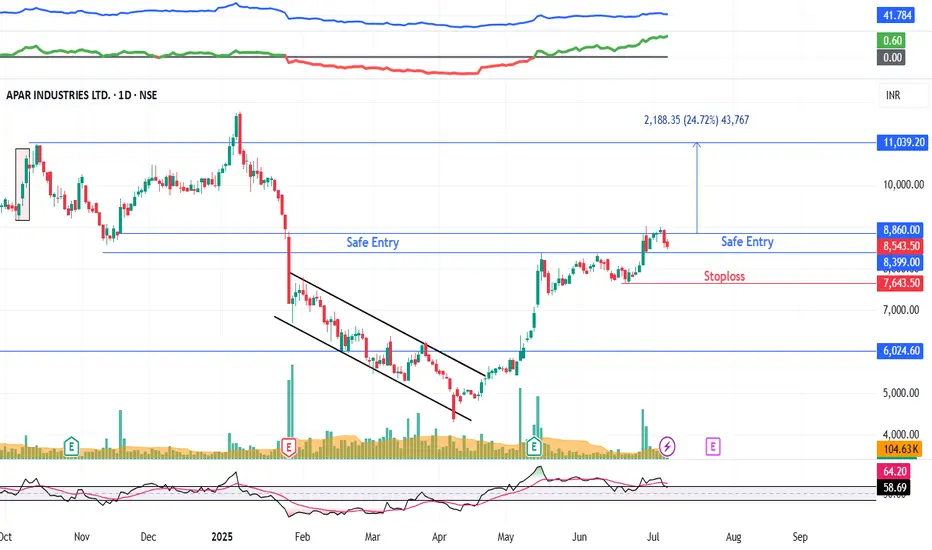
APARINDS : Stage 3 Candidate#APARINDS #stage3 #swingtrade #breakoutstock #trendingstock #patternbreakout
APARINDS : Swing trade
>> Stock in stage3
>> Breakout Candidate
>> Cup & Handle pattern
>> Good strength in Stock
>> Good Recent Buildup
>> Risk Reward Favorable
Swing Traders can lock profit at 10% and keep Trailing
Please Boost, comment and follow us for more Learnings.
Disc : Charts shared are for learning purpose only, not a Trade recommendation. Do your own research and consult your financial advisor before taking any position.
JK Paper LTD (Long View)Breakout Pick
>Supporting Trendline Coming
>Downward Trendline Breakout
> Price Above EMA 200
> Retest Level -380-388
Upside Level (POSSIBLITIES)
-427
-490
-523
Till Then, Keep Following Markets

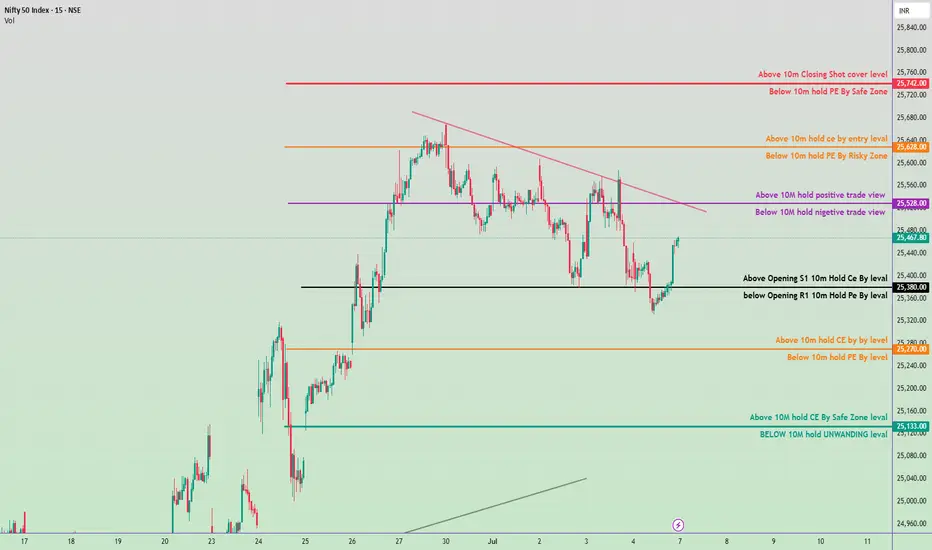
Nifty 50 Intraday Trade Plan - 7 July 2025✅ Bullish Zones (Call Option - CE Buy Levels):
Above 25,133 ➤ Hold CE by Safe Zone level
Above 25,270 ➤ Hold CE by key level
Above 25,380 ➤ Opening S1 Breakout – Hold CE
Above 25,528 ➤ Positive Trade View (10M volume base)
Above 25,628 ➤ Entry level for CE holding
Above 25,742 ➤ Closing Shot – Cover Short Positions
🔻 Bearish Zones (Put Option - PE Buy Levels):
Below 25,133 ➤ Unwinding Level – Hold PE
Below 25,270 ➤ Key level – Hold PE
Below 25,380 ➤ Opening R1 Breakdown – Hold PE
Below 25,528 ➤ Negative Trade View
Below 25,628 ➤ Risky Zone for holding PE
Below 25,742 ➤ Safe Zone for holding PE
🔁 Trendline & Structure Notes:
Downtrend resistance visible around 25,528–25,628 zone.
If price breaks above trendline and sustains, expect bullish momentum.
Support near 25,133 and strong base seen around 25,000 zone.
Gabriel India Limited - Breakout Setup, Move is ON..#GABRIEL trading above Resistance of 518
Next Resistance is at 673
Support is at 415
Here are previous charts:
Chart is self explanatory. Levels of breakout, possible up-moves (where stock may find resistances) and support (close below which, setup will be invalidated) are clearly defined.
Disclaimer: This is for demonstration and educational purpose only. This is not buying or selling recommendations. I am not SEBI registered. Please consult your financial advisor before taking any trade.

NYKAA - Breakout from DTFNYKAA has resistance weakening on the Daily charts and has given a breakout with good volume.
The target of this pattern signals an upside potential of 10% from the current price level in the medium term.
The stock is trading above its 50- and 100-day simple moving averages (SMAs). The range is more than >1.2X, and the Volume is also >2X the average.
CMP- Rs. 108
Target Price- Rs228 ( 10% upside)
SL -202
Disclaimer: This is not a buy/sell recommendation. For educational purpose only. Kindly consult your financial advisor before entering a trade.

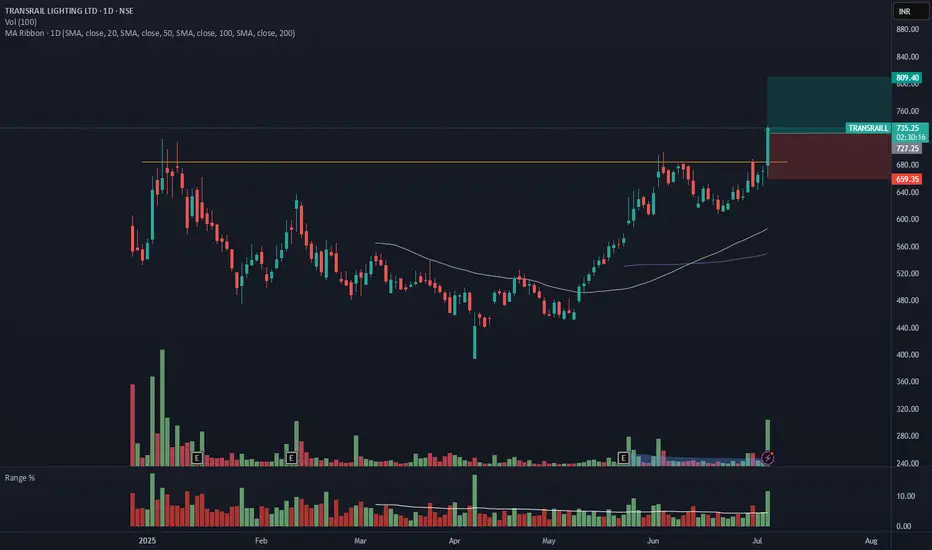
TRANSRAILL - Breakout from Daily TFTRANSRAILL has resistance weakening on the Daily charts and has given a breakout with good volume.
The target of this pattern signals an upside potential of ~10% from the current price level in the medium term.
The stock is trading above its 50- and 100-day simple moving averages (SMAs). The range is more than >2X, and the Volume is also >6X the average.
CMP- Rs. 727
Target Price- Rs.805( ~10% upside)
SL -859
Note- The breakout candle has gone up, extended, so be mindful of your position.
Disclaimer: This is not a buy/sell recommendation. For educational purpose only. Kindly consult your financial advisor before entering a trade.
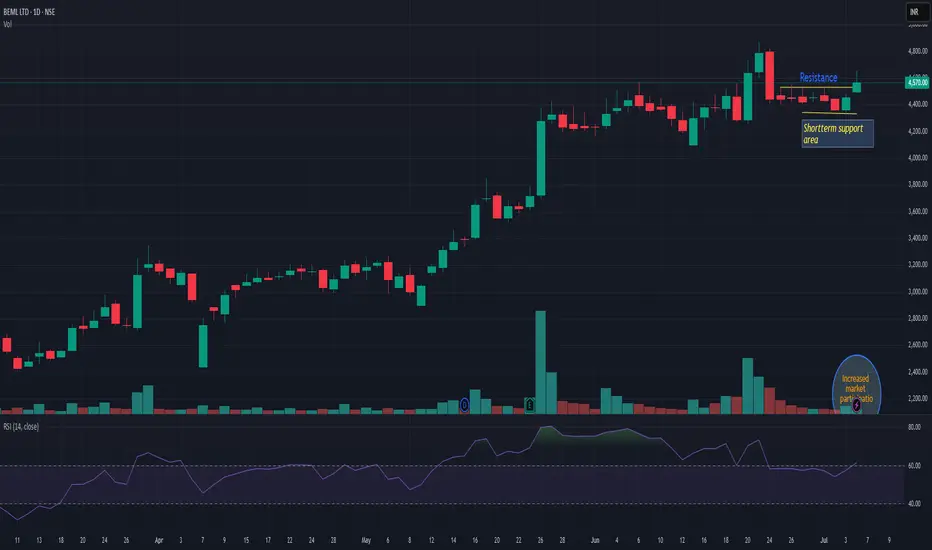
BEMLBEML is trading above resistance line with very decent volume. As long as it is trading above support line, momentum may continue. Recently fresh momentum has been observed on majority defense stock. If today it is closing above 4600 then we may see momentum for next 12-15%. Keep it on radar.
TRANSRAILL : Breakout Stock (Swing Trading) #TRANSRAILL #breakoutstock #swingtrading #chartpattern #cupandhandlepattern #patternbreakout #patterntrading
TRANSRAILL : Swing Trading
>> Breakout Stock
>> Cup and Handle pattern
>> Breakout with Volume
>> Good Strength in Stock
>> Risk Reward Favorable
Swing Traders can lock profit at 10% and keep Trailing
Please Boost, comment and follow us for more Learnings
Disc : Charts shared are for learning purpose only, not a Trade recommendation. Do your own research and consult your financial advisor before taking any position.

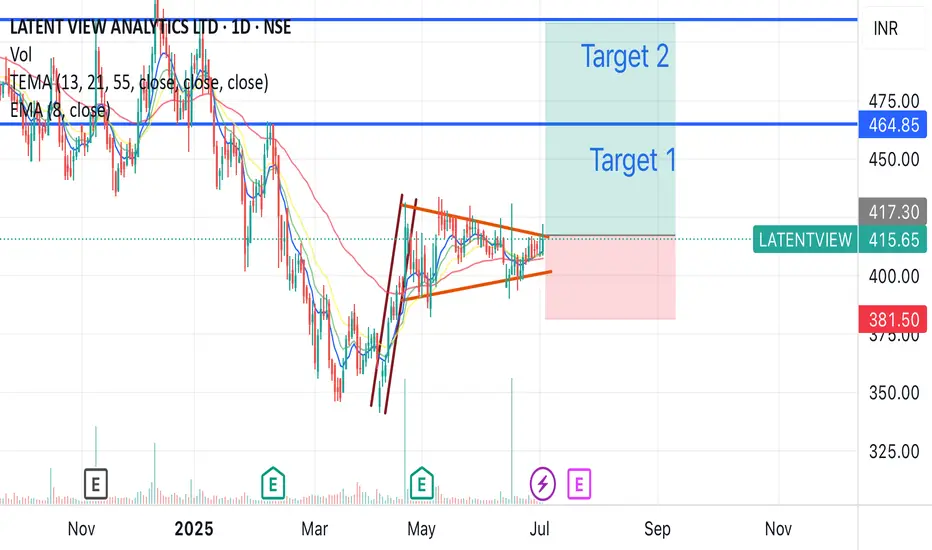
Latent view possible breakout after long consolidationLatent view might give a possible breakout as it is showing a long consolidation with flag and pole pattern, high volume was also seen a week back.
Also 55 Ema is below 8, 13, and 21 ema, which shows potential up movement
Buy around 415-420
Target - 508
Duration - 2-3 months
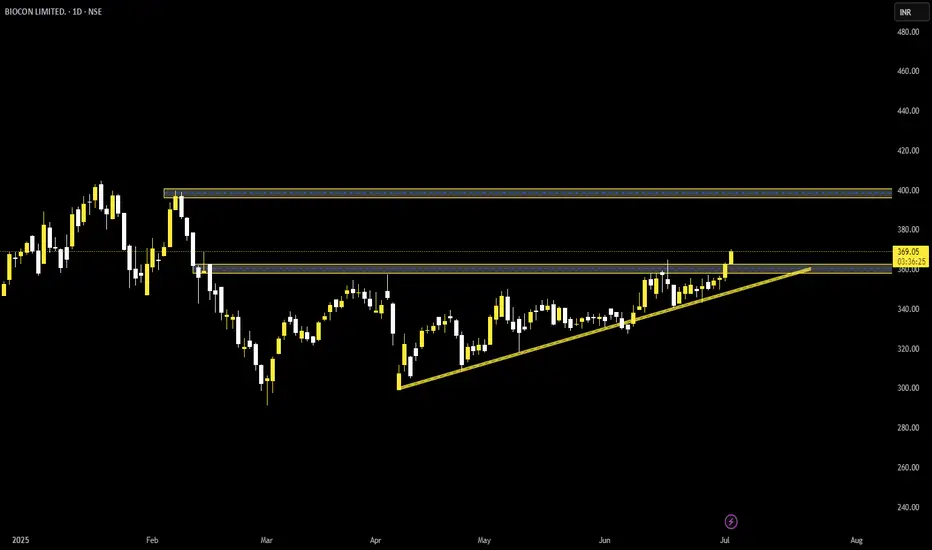
Biocon (Long)Price seen breaking out a resistance zone of 357-362
Expecting 9-10% Move Upside
Thanks
BLUE STAR LTD. – TECHNICAL ANALYSIS📈 BLUE STAR LTD. – TECHNICAL ANALYSIS
📆 Date: July 1, 2025 | ⏱ Timeframe: Daily Chart
🔍 Educational Breakdown – For Learning & Study Use Only
________________________________________________________________________________
🔹 Price Action Zones
• 🔴 Top Range (Resistance): 2417
• 🟢 Bottom Range (Support): 1521
________________________________________________________________________________
🔹 Chart Pattern: ✅
Rectangle/Box Consolidation Breakout – Price was range-bound in a tight zone and has given a strong breakout on high volume, indicating bullish intent.
________________________________________________________________________________
🔹 Reversal Candlestick Patterns
• Top Range (2417): ⛔ No recent candlestick activity visible at the top range.
• Bottom Range (1521): Todays Candle
✅ Bullish Engulfing + Strong Bullish Candle
✅ RSI Bounce + Volume Spike
✅ Confirmed by Price Action and Momentum Indicators
________________________________________________________________________________
📊 Trade Plan (Based on Reason and Logic)
🔼 Bullish Trade Setup:
• Entry: 1715 (Breakout Candle Close)
• Stop Loss: 1614.45 (Below consolidation and bullish candle)
• Target 1: 1850
• Target 2: 1980
• Reason:
o Strong breakout with above-average volume
o Multiple confirmations (RSI, Bollinger Band, Supertrend)
o Box breakout with previous supply cleared
________________________________________________________________________________
🔽 Bearish Trade Setup:
• If price fails to sustain above 1715 and closes back below 1680 zone
• Entry: Below 1665 (Fakeout confirmation)
• SL: Above 1715
• Target: 1615 / 1550
• Reason: Potential failed breakout & liquidity trap
________________________________________________________________________________
📌 Disclaimer
This analysis is shared for educational and study purposes only. It does not constitute investment advice. The author is not SEBI-registered. Please consult a SEBI-registered advisor before making trading decisions. Always use proper risk management and trade only with confirmation.
________________________________________________________________________________
💬 Comments
What’s your view on Britannia?
Drop your thoughts and chart setups
________________________________________________________________________________

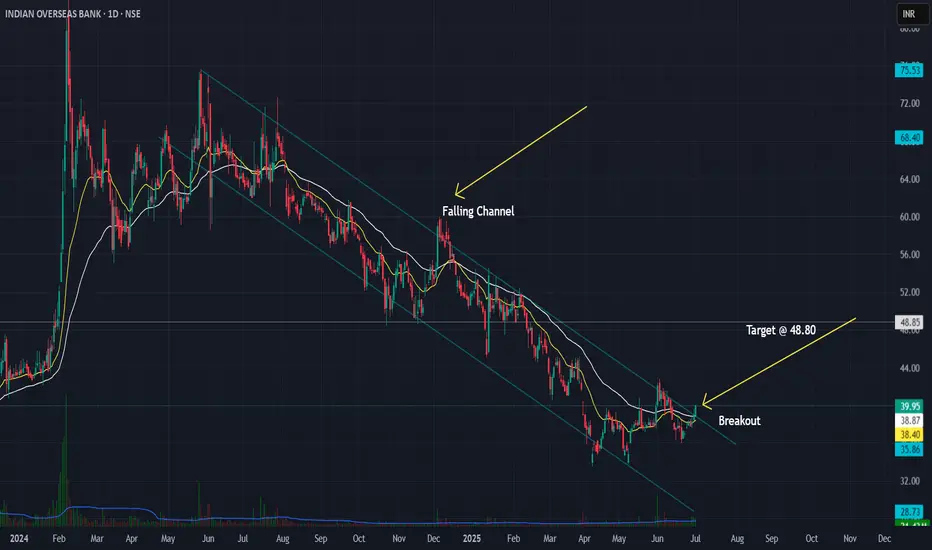
Indian Overseas Bank (IOB) - Falling Channel Breakout Setup📈 Indian Overseas Bank (IOB) – Falling Channel Breakout Setup
Watching a classic falling channel on the daily timeframe with multiple touches on both trendlines. Recent breakout above ~38.8 confirms the channel break.
✅ Planned Trade Details:
- Entry above 38.8 (confirmation)
- Stop-loss: 35.90
- ATR-based stop option: ~37.45 for tighter risk control
- Target zone: 48.80 based on channel height projection
Volume confirmation and follow-through will be key for validating the breakout. Tracking this for a positional swing trade.
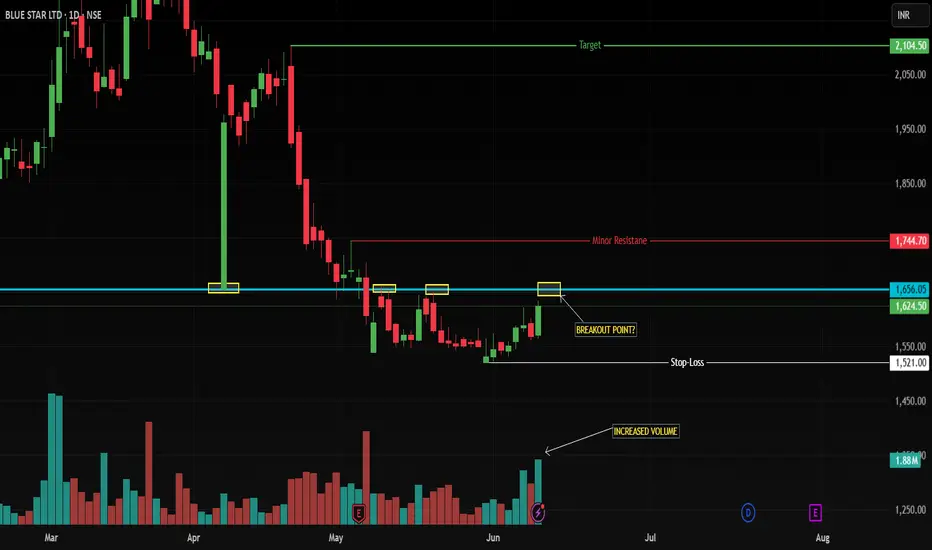
Rounding Bottom Breakout – HUGE 8:1 R/R Setup!NSE: BLUESTARCO | Timeframe: Daily
🔥 Key Observation:
BlueStar is painting a textbook Rounding Bottom reversal pattern – a bullish signal indicating exhaustion of sellers and accumulation by smart money. Current price (1624.50) is coiling near the make-or-break resistance at 1656. A breakout here could ignite a massive rally!
🎯 Trade Plan: Precision Execution
⏱️ TRIGGER:
BUY ONLY ON CONFIRMED BREAKOUT ABOVE 1656
Must see: Strong green candle + Volume > 20% above average
NO BREAKOUT = NO TRADE. Period.
🧯 STOP LOSS (SL):
1521 (swing low below pattern – technical invalidation)
Risk: Just 8.1% from 1656 entry.
🎯 TARGETS:
TP1: 1744 (minor resistance – book 50% here)
TP2: 2100 (measured move target – 27%+ from breakout)
Reward/Risk: 8.4x (Rare asymmetry!)
📊 Why This Works:
Rounding Bottom: Classic reversal pattern after a downtrend – signals long-term trend shift.
Volume Confirmation: Breakout with rising volume = institutional participation.
SL Placement: Below the pattern’s trough (1521) invalidates the setup.
Target Rationale: 2100 aligns with the historical liquidity zone.
🚨 Critical Risk Controls
❗ NO BREAKOUT = NO TRADE.
❗ If breakout lacks volume, REJECT the trade.
❗ Partial exit at 1744: Trail SL to 1650 (breakeven) for remainder.
💡 Trader Psychology Edge
FOMO KILLS: Chasing before 1656 risks getting trapped in fakeouts.
Patience = Profit: Wait for the market’s confirmation – this is where pros separate from amateurs.
Trade Like a Sniper: One clean shot at 1656+volume, or walk away.
Disclaimer: This is not financial advice. Always do your own research. Charts are for educational purposes.
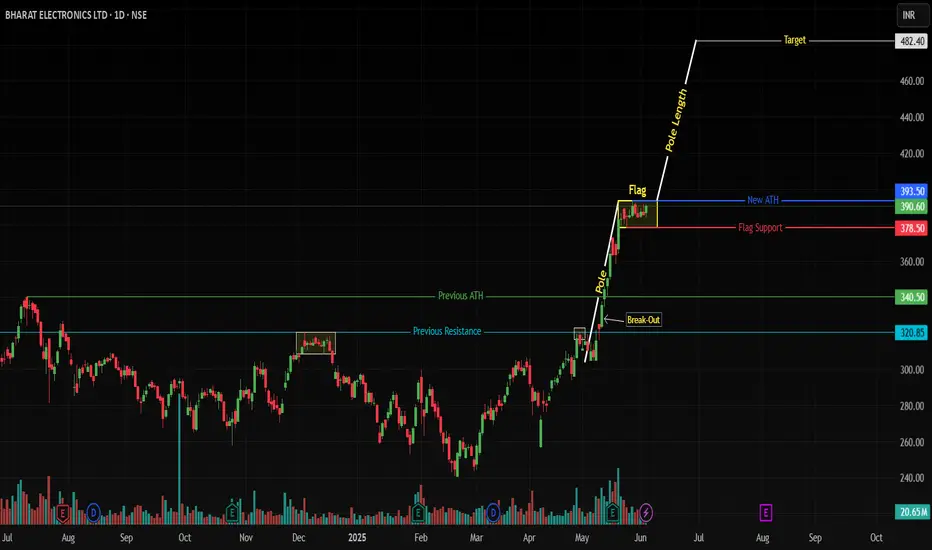
How to Trade ATH Stocks: Harness Explosive Trends with ADX !(BEL Case Study)
NSE:BEL (Daily) - Bull Flag at All-Time Highs
📈 Key Observations
ATH Breakout Confirmed:
Price smashed through ₹340.50 previos ATH, hitting a historic high of ₹393.50.
Consolidation in a tight bull flag (₹378.50–393.50) after a 28.97% surge – classic bullish continuation setup.
ADX: Your Trend Compass 🧭
ADX at 43.95 signals a powerful, directional trend (Readings >25 = strong trend; >40 = explosive momentum).
Ignore oscillator noise: Trends trump RSI/MACD in parabolic moves.
Pattern > Oscillators:
Bull Flag Priority: The pattern’s integrity (lower volume consolidation) outweighs short-term RSI(79)/MACD wobbles.
🚀 Trade Strategy: Trend-First Framework
✅ Entry & Targets
Trigger: Daily close above ₹393.50 (flag resistance).
Add: Retest of ₹393.50 as support.
Targets:
Short-term: ₹420 (5% above ATH)
Measured Move: ₹482 (ATH + pole height: 393.50 + 88.20)
⚔️ Stop-Loss
Conservative: ₹378.50 (flag low breach).
Aggressive: ₹385 (tight stop, honors consolidation structure).
📊 Position Sizing
Risk ≤1% capital per trade.
Reward/Risk Ratio: 4:1 (₹482 target vs. ₹378.50 stop).
💡 Why ADX Trumps RSI/MACD at ATHs
RSI/MACD are lagging in strong trends:
RSI overbought ≠ reversal – it’s fuel for momentum stocks.
MACD crosses often "whipsaw" in high-ADX environments (BEL’s ADX >40 invalidates bearish MACD signals).
ADX is proactive:
"Trends persist until ADX rolls below 30" – Focus on price, not oscillator fears.
🌐 Sector & Fundamental Tailwinds
Defense Sector Strength: India’s capex boost; BEL’s order book increasing.
Institutional Conviction: FIIs increasing stake.
🛡️ Risk Management Checklist
✅ Trade only on confirmed close above ATH.
✅ Use ADX >40 as a momentum green light.
✅ Trail stops at 20-DMA (₹365) once +10% profit.
Chart Markup:
Blue line: Bull flag Resistance at ₹393.50.
Red Line: Bull Flag Support ₹378.50
ADX(14) subchart with 40+ threshold highlighted.
💎 Final Thought: ATH breakouts are trend accelerators, not tops. BEL’s bull flag + ADX >40 frames a high-probability continuation play. Stick with the trend until ADX says otherwise.
Boost this idea if you’re tracking BEL’s breakout!
Follow for high-probability ATH trade setups.
⚠️ Disclaimer
"This is NOT financial advice. Trade at your own risk. Past performance ≠ future results. Always conduct independent research and consult a SEBI-registered advisor. The author holds no position in BEL at time of publication."
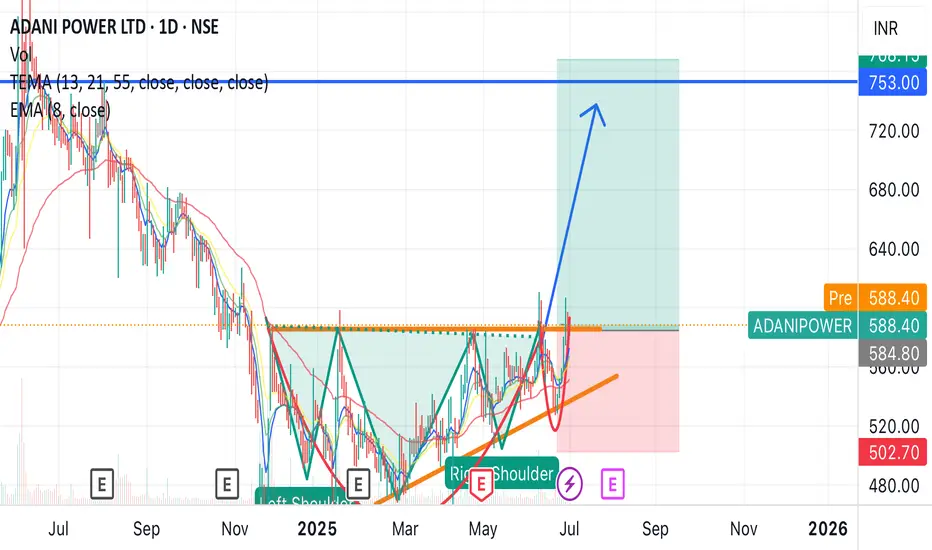
Adani power breakout anytime Adani power price hover just above resistance can give breakout anytime, earlier it was showing head and shoulder pattern and now changed into cup and handle pattern, also the support is also moving up.
Can expect a breakout anytime.
Entry around - 600
Target - 750
Duration 1-2 month
CHOLAFIN- Breakout from DTFCHOLAFIN has resistance weakening on the Daily charts and has given a breakout with good volume.
The target of this pattern signals an upside potential of ~10% from the current price level in the medium term.
The stock is trading above its 50- and 100-day simple moving averages (SMAs). The range is more than >1X, and the Volume is also >1X the average.
CMP- Rs. 1628
Est. Entry price ~ 1670
Target Price- Rs1813 ( ~10% upside)
SL -1610
Note- The candle closed isn't very promising, so we have to wait for a stronger move. The promising move should be able to close above 1670.
Disclaimer: This is not a buy/sell recommendation. For educational purpose only. Kindly consult your financial advisor before entering a trade.

Head and shoulder into cup and handle patternHudco turning head and shoulder pattern into cup and handle pattern price is near resistance and break anytime. This is a short term trade
Buy around - 230-240
Target - 340
Duration - 2-3 months

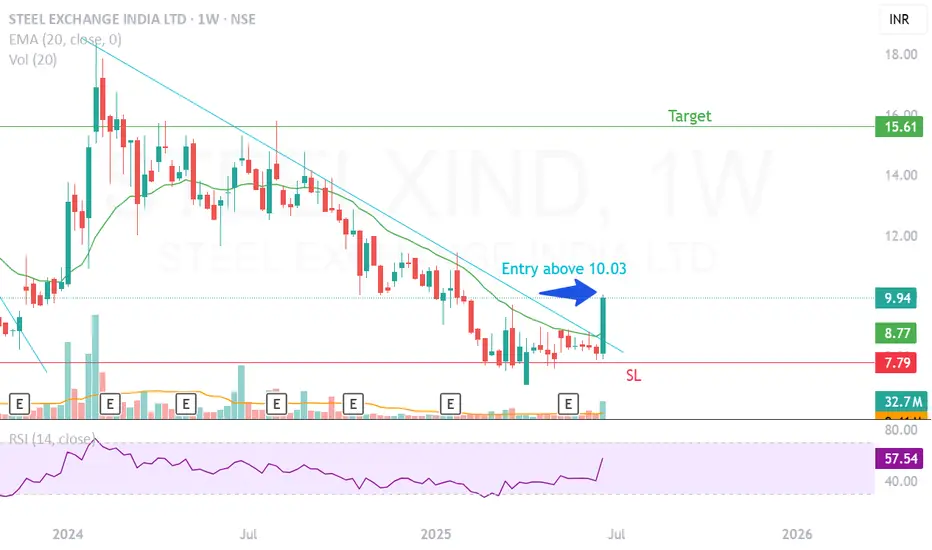
Trendline breakout in weekly Time frameLooks good for buying at this price .
The price was at key support level
trendline breakout happened in daily, weekly timeframe
can get best returns in short time when chased the target with trailing stoploss
Laurus Labs Limited - Breakout Setup, Move is ON...#LAURUSLABS trading above Resistance of 553
Next Resistance is at 699
Support is at 420
Here are previous charts:
Chart is self explanatory. Levels of breakout, possible up-moves (where stock may find resistances) and support (close below which, setup will be invalidated) are clearly defined.
Disclaimer: This is for demonstration and educational purpose only. This is not buying or selling recommendations. I am not SEBI registered. Please consult your financial advisor before taking any trade.

Tata steel cup Handle breakoutTata steel cup and handle breakout and the price is near resistance also with support coming close to the resistance suggesting possible breakout.
Buy around - 160
Target - 180 (13%)
Duration - 1 month
Tata steel have good fundamentals and showing breakout possibility

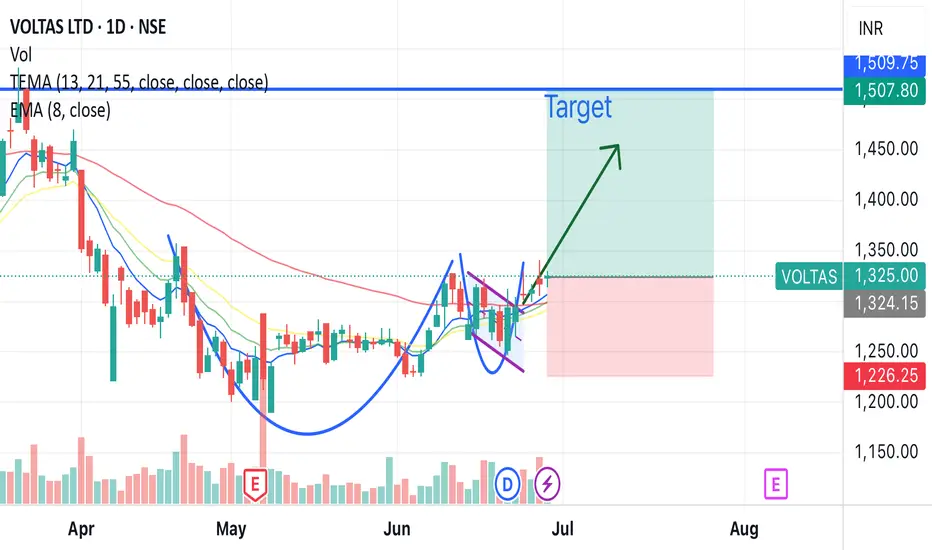
Voltas breakout soon cup and handle patternVoltas will soon be flying, cup and handle breakout pattern, pattern is very prominent, high chances of breakout in short term 15% profit.
Also reaching golden crossover
Buying range - 1310 - 1330
Target - 1507 (15%)
Hold duration - 1-2 month
Voltas belongs to Tata groups and have good fundamentals.
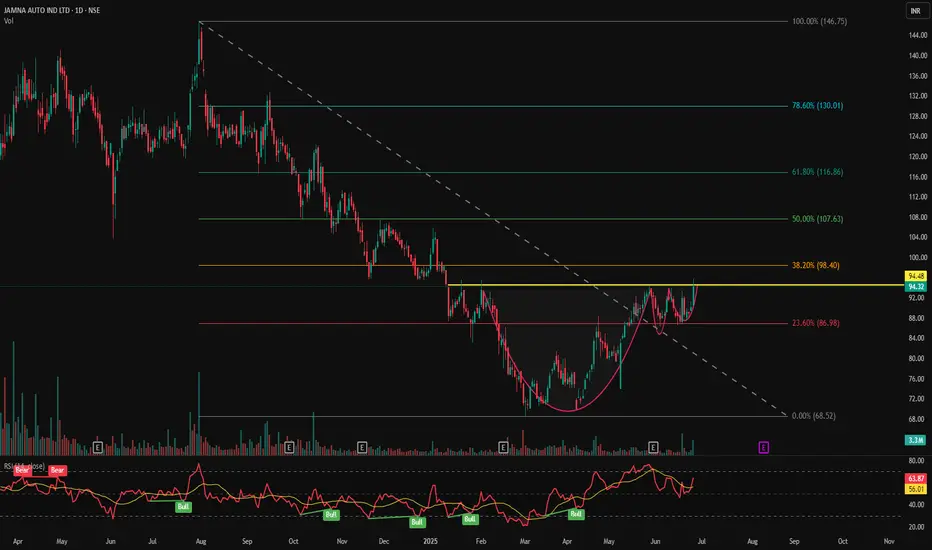
JAMNAAUTO - VCP Pattern Near Breakout📊 JAMNA AUTO (JAMNAAUTO) – VCP Pattern Near Breakout | RSI Momentum | Volume Surge | Daily Chart
📅 Chart Date: June 26, 2025
📈 CMP: ₹94.32 (+4.60%)
📍 Ticker: NSE:JAMNAAUTO
🔍 Technical Analysis Summary
☕ Cup & Handle Formation
The chart shows a well-formed Cup & Handle pattern
Neckline resistance at ₹94.48 – a break above this zone could trigger bullish continuation
Pattern suggests accumulation and breakout setup after prolonged downtrend reversal
📈 Volume
Rising volume on recent candles, supporting strength of potential breakout
Volume above 3.3M confirms strong buying interest
📊 RSI Indicator (14)
RSI currently at 63.87 and rising
Multiple historical RSI Bullish crossovers visible during base and handle formation
RSI > 60 indicates momentum is favoring bulls
📍 Key Price Levels
✅ Breakout Zone (Neckline): ₹94.48
🚀 Upside Targets (Post-breakout estimate):
₹102
₹110
₹120+
🛡️ Support Zones:
₹90 (immediate)
₹85 (handle base)
₹80 (cup base)
📌 Trade Setup Idea
Entry: On breakout above ₹94.50 with volume
SL: Below ₹89
Targets: ₹102 → ₹110 → ₹120+
Risk-Reward: Good, considering rounded base and handle plus RSI confirmation
⚠️ Disclaimer
This chart analysis is for educational purposes only. Always DYOR (Do Your Own Research) and consult a financial advisor before making investment decisions.