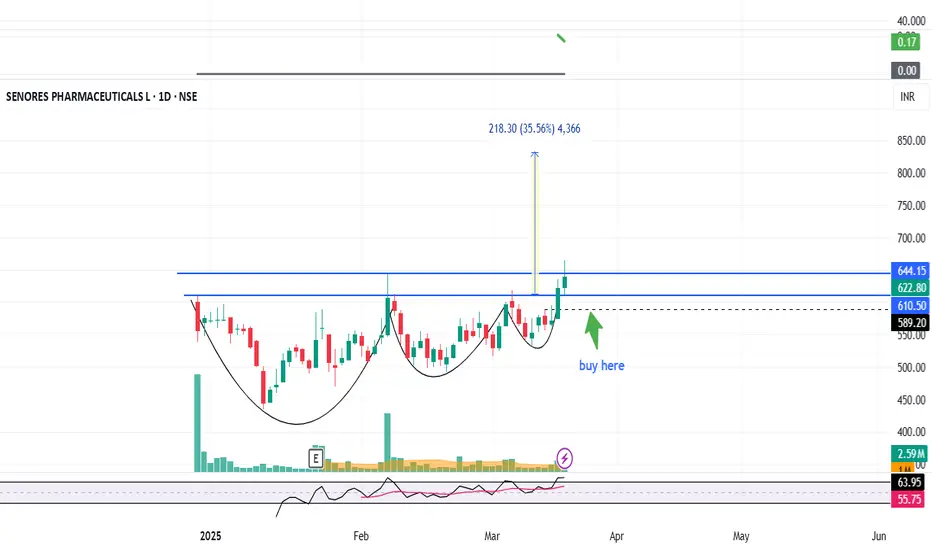
SENORES : Breakout Candidate#SENORES #breakoutsoon #swingtrade #vcppattern #vcpbreakout
SENORES : Swing Trade / Momentum trade
>> wait for Retracement till black line
>> Volumes and Strength Building up
>> Beautiful VCP pattern
>> Low Risk High Reward Trade
Swing Traders can lock profit at 10% and keep Trailing
Please Boost, comment and follow us for more Learnings.
Note : Markets are still Tricky and can go either ways so don't be over aggressive while choosing & planning your Trades, Calculate your Position sizing as per the Risk Reward you see and most importantly don't go all in
Disc : Charts shared are for learning purpose only, not a Trade recommendation. Do your own research and consult your financial advisor before taking any position.
Breakouttrading
Tata Steel Potential Breakout Candidate.📈 Tata Steel - Trading Plan
🎯 Trade Setup:
🔹 Entry: ₹159 (Preferably on a daily closing basis)
🔹 Stop Loss (SL): ₹145 (Daily closing basis) (-8.81%)
🔹 Target 1: ₹184 (+15.72%)
🔹 Risk-to-Reward (R:R): 1:1.78
📊 Why This Stock?
✅ Above 50 DMA & Consolidating Above 200 DMA – Signs of strength after prolonged weakness.
✅ Gap Up & Trading Near Resistance – Potential breakout opportunity if volume supports.
✅ Metal Index Breakout – Recently broke out of a base, trading just below 200 DMA.
✅ Weekly Candles Showing Strength – Wide-range candles indicate demand.
✅ Improving RSI – Momentum gaining strength.
⚠️ Risks to Consider
❌ Overall Trend Still Bearish – Market structure remains Lower Highs, Lower Lows.
❌ Metal Index Below 200 DMA – A strong close above it adds more conviction.
❌ Volume Needs Improvement – A breakout without volume can be weak.
📌 Safe Trading Approach
🔹 Ultra Safe Traders: Wait for a weekly close above ₹159.
🔹 Confirmation Traders: Enter only after Metal Index closes above 200 DMA with volume.
🔹 Breakout Traders: Ensure a clean breakout with strong volume before entry.
📢 Disclaimer: This is not a trade recommendation. Please do your own due diligence and manage your risk accordingly. 🚀

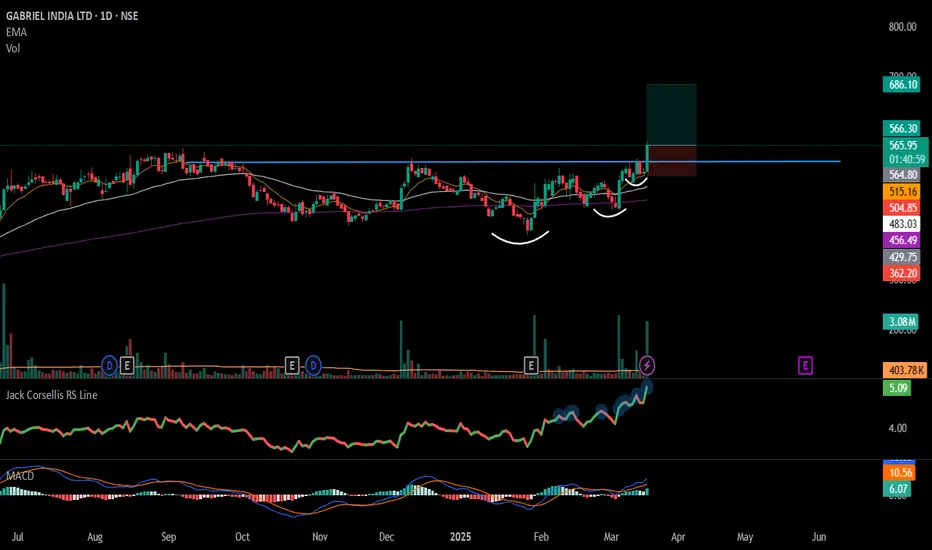
#GABRIEL - VCP Break Out in Daily chart with Volume Spike📊 Script: GABRIEL
Key highlights: 💡⚡
📈 VCP formation in Daily chart.
📈 Price gave a good up move and consolidated.
📈 Volume spike on Breakout
📈 MACD Bounce
📈 RS is making 52WH
📈 One can go for Swing Trade.
BUY ONLY ABOVE 565DCB
⏱️ C.M.P 📑💰- 561
🟢 Target 🎯🏆 – 21%
⚠️ Stoploss ☠️🚫 – 11%
️⚠️ Important: Market conditions are getting better, Position size 25% per Trade. Protect Capital Always
⚠️ Important: Always Exit the trade before any Event.
⚠️ Important: Always maintain your Risk:Reward Ratio as 1:2, with this RR, you only need a 33% win rate to Breakeven.
✅Like and follow to never miss a new idea!✅
Disclaimer: I am not SEBI Registered Advisor. My posts are purely for training and educational purposes.
Eat🍜 Sleep😴 TradingView📈 Repeat 🔁
Happy learning with MMT. Cheers!🥂
Anup Engineering | Counter Trendline Breakout on Radar!ANUP Engineering is at an interesting juncture! 📊
Green Trendline ✅: Acting as strong dynamic support, tested multiple times.
Yellow Counter Trendline ⚡: The reactive line that could lead to a potential breakout.
Blue Resistance 🔵: Multi-timeframe (MTF) resistance—first hurdle after a breakout.
Yellow Resistance 🟡: Major resistance level where price action has reacted before.
Multi-Timeframe Analysis (MTFA) is Key: If the Counter Trendline (CT) breaks, price may first test the MTF Resistance (Blue Line) before challenging the WTF Resistance (Yellow Line).

India Shelter Finance (NSE:INDIASHLTR) - Early Breakout Alert📌 Trade Setup:
Entry: Above ₹811 (Preferably wait for a daily close above this level).
Stop Loss: ₹699 (Closing basis).
Target: ₹1,050+ (Positional).
Risk-Reward Ratio (R:R): ~2.0+ (Depending on entry confirmation).
📊 Technical Overview:
✅ The stock has been consolidating in a base and is attempting a breakout today.
✅ The candle structure looks strong and wide, indicating momentum.
✅ RSI is in a good zone, signaling strength.
✅ Trading above 200 DMA and 50 DMA, indicating bullish structure.
✅ The finance sector is showing early signs of recovery.
💡 Volume is key! While there's a slight improvement, we need stronger volume confirmation for conviction.
📈 Key Fundamentals:
Metric Value
Market Cap ₹8,770 Cr.
Current Price ₹813
Stock P/E 25.3
Book Value ₹231
Dividend Yield 0.00%
ROCE (Return on Capital Employed) 12.2%
ROE (Return on Equity) 14.0%
Face Value ₹5.00
💡 Fundamental View: The stock is trading at a P/E of 25.3, which is reasonable for a growing financial company. ROE of 14% and ROCE of 12.2% indicate decent profitability. No dividend yield as the company is focused on growth.
⚠️ Risk Considerations:
🚨 This is a counter-trend trade! The broader market is still uncertain, so we are taking a test position, NOT an aggressive bet.
🚨 This is NOT a guaranteed move up. The trade idea is to alert about a potential mover once the dust settles.
🚨 Risk management is crucial. Do NOT go all-in, thinking the market has found a bottom. Another round of fall is still possible.
📌 Trade Plan:
Buy in small quantities above ₹811 and wait for follow-through confirmation or a potential retest.
If the breakout sustains, consider adding more positions gradually.
If the stock closes below ₹699, exit.
📌 Do your due diligence! This is an early-stage breakout attempt, and risk-reward should be managed carefully. 🚦
📢 Disclaimer:
This analysis is for educational purposes only and NOT financial advice. Stock markets are subject to risks, and past performance does not guarantee future results. Do your own research before making any investment decisions. 🚨

SDBL - SOM DIST & BREW BY KRS Charts13th Feb / 10:22 AM
Why SDBL??
1. All over Bullish Stock currently in consolidation.
2. Yesterday shown Fake breakdown and suddenly bounce back means many Sellers orders got Triggered which was below that level.
3. Today moving Upside obviously for SL hunting of those sellers.
4. Stock will move upside more when price reaches green line on as we can see in Chart.
Expecting Upside move due to SL hunting in SDBL.

Hindustan Zinc Update – A Breakout on the Horizon?Hindustan Zinc is trading at 432 after pulling back from its all-time high of 807.
It’s approaching a critical zone— a potential trendline breakout could be in the cards! But first, we need a daily closing above 438 to confirm strength.
Key Levels to Watch:
Major Support – It has taken strong support, which can be validated on the monthly timeframe.
The Real Bullish Move? – A decisive closing above 481 could trigger a strong rally!
Plan Your Entry Wisely!
If you want to know my entry, stop-loss, and target, follow me for live updates! Let’s trade smart!

Mastering Fractals: The Secret Weapon of Smart Traders!Hello Traders! Have you ever noticed that market patterns repeat across different timeframes? That’s where Fractal Theory comes in! Fractals are self-repeating patterns that occur at both micro and macro levels, helping traders spot trend reversals, breakouts, and entry points. Today, let's explore how to use fractals in price action trading to refine our strategy and improve accuracy!
1. What Are Fractals in Trading?
Fractals are recurring price patterns that signal potential reversals in the market.
These patterns consist of five or more candlesticks , where the middle candle is either the highest (bearish fractal) or lowest (bullish fractal) in a sequence.
Fractals help traders identify support, resistance, and trend shifts with better precision.
2. How to Identify a Fractal in Price Action?
Bullish Fractal: A price formation where the middle candle has the lowest low , surrounded by two higher lows on both sides.
Bearish Fractal: A price formation where the middle candle has the highest high , with two lower highs on both sides.
Multiple Timeframe Analysis: Fractals appear on all timeframes (from 1-minute to weekly charts), making them useful for scalpers, swing traders, and long-term investors.
3. How to Trade Using Fractal Theory?
Trend Confirmation: Combine fractals with indicators like Moving Averages, RSI, or Fibonacci levels to confirm trend direction.
Entry & Exit Signals: A bullish fractal near support may signal a buying opportunity , while a bearish fractal near resistance may indicate a potential sell signal .
Breakout Trading: Use fractals to spot breakout zones —when price breaks a previous fractal high (bullish) or low (bearish), it can confirm a new trend direction.
Stop-Loss Placement: Set stop-losses below bullish fractals (for buy trades) and above bearish fractals (for sell trades) to manage risk effectively.
Combine with Smart Money Concepts (SMC): Fractals align well with liquidity grabs, order blocks, and institutional moves , making them even more powerful when used with smart money trading techniques.
4. Limitations & Risk Management
Fractals are lagging indicators —they only confirm after the pattern has completed.
False signals can occur , so always confirm with volume, trend structure, or additional indicators.
Use risk-reward ratios wisely —never rely solely on fractals without a solid trading plan and stop-loss strategy.
Conclusion
Fractal Theory helps traders identify high-probability setups , confirm trend reversals , and improve trade entries & exits. By combining fractals with other technical analysis tools , traders can increase their accuracy and reduce market noise.
Have you ever used fractals in your trading? Let’s discuss in the comments!

Market Structure Shift: How to Spot Trend Reversals EarlyHello Traders! Spotting trend reversals early can be a game-changer in trading. A Market Structure Shift (MSS) occurs when price action transitions from an uptrend to a downtrend (or vice versa), giving traders a heads-up before major moves happen. Learning how to identify these shifts early can help you avoid traps and catch high-probability setups. Let’s break it down!
1. What is a Market Structure Shift (MSS)?
A Market Structure Shift (MSS) is when price transitions from a clear trend into a potential reversal.
It usually occurs when the price breaks a key level of support or resistance and fails to continue in the original trend.
MSS is often confirmed when price action starts forming lower highs & lower lows (bearish shift) or higher highs & higher lows (bullish shift).
2. How to Identify a Trend Reversal Early?
Break of Market Structure (BMS): When price breaks a recent swing high (in a downtrend) or a swing low (in an uptrend), it signals a shift in market sentiment.
Liquidity Grab & Stop Hunts: Smart money often pushes price beyond key levels to trigger stop-losses before reversing the trend.
Volume Confirmation: A real market structure shift is supported by increased volume , confirming strong buying or selling interest.
Failure to Make New Highs/Lows: If a trend starts struggling to create fresh highs in an uptrend (or fresh lows in a downtrend ), it indicates a weakening trend.
Moving Average Crossovers: When short-term moving averages (like 9 EMA or 21 EMA) cross below long-term ones (like 50 EMA), it can indicate a structural shift.
Divergence in RSI or MACD: If price makes a higher high , but RSI/MACD makes a lower high , it suggests momentum is weakening , hinting at a potential reversal.
3. How to Trade a Market Structure Shift?
Wait for Confirmation: Don’t enter immediately—wait for price retest or rejection at key levels.
Use Stop-Loss Wisely: Place stop-loss above the previous high (for short trades) or below the previous low (for long trades) to manage risk effectively.
Combine with Other Indicators: MSS is more powerful when used alongside support/resistance, volume analysis, and Fibonacci levels.
Look for Retests: Often, price will retest the broken structure level before continuing in the new trend. This gives a better risk-to-reward entry.
Trade with the New Trend: Once MSS is confirmed , look for pullbacks and enter in the direction of the new trend.
Conclusion
Understanding Market Structure Shifts helps traders stay ahead of trend reversals and avoid getting caught in bad trades. By combining price action, volume, and technical indicators , you can spot reversals early and execute high-probability setups.
Have you ever used market structure shifts in your trading? Let me know in the comments! 👇

Bharat Rasayan | 2200-Day Uptrend Holding Strong, Ct breakoutThe green trendline represents a massive 2200-day uptrend, acting as a strong support level.
A counter-trendline breakout (182 days long) has just occurred, breaking the red resistance line with momentum.
The yellow zone has been respected three times over 1170 days, indicating a strong supply zone—a breakout above this can trigger a major move.
Recent base formation followed by a breakout adds to the bullish structure.
Volume remains low, likely due to the stock trading in 5-digit territory.
Watchlist Ready? Let’s Ride the Trend!

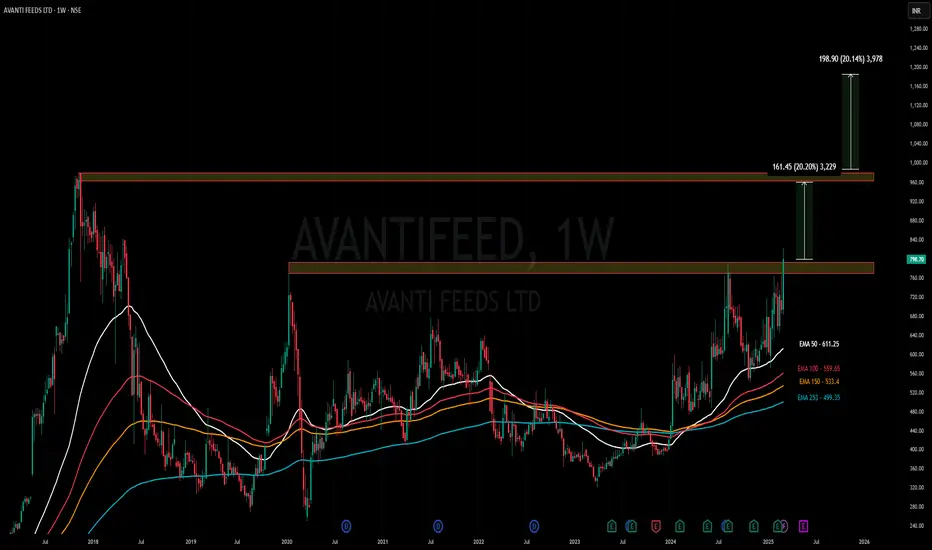
Amazing breakout on WEEKLY Timeframe - AVANTIFEEDCheckout an amazing breakout happened in the stock in Weekly timeframe, macroscopically seen in Daily timeframe. Having a great favor that the stock might be bullish expecting a staggering returns of minimum 25% TGT. IMPORTANT BREAKOUT LEVELS ARE ALWAYS RESPECTED!
NOTE for learners: Place the breakout levels as per the chart shared and track it yourself to get amazed!!
#No complicated chart patterns
#No big big indicators
#No Excel sheet or number magics
TRADE IDEA: WAIT FOR THE STOCK TO BREAKOUT IN WEEKLY TIMEFRAME ABOVE THIS LEVEL.
Checkout an amazing breakout happened in the stock in Weekly timeframe.
Breakouts happening in longer timeframe is way more powerful than the breakouts seen in Daily timeframe. You can blindly invest once the weekly candle closes above the breakout line and stay invested forever. Also these stocks breakouts are lifelong predictions, it means technically these breakouts happen giving more returns in the longer runs. Hence, even when the scrip makes a loss of 10% / 20% / 30% / 50%, the stock will regain and turn around. Once they again enter the same breakout level, they will flyyyyyyyyyyyy like a ROCKET if held in the portfolio in the longer run.
Time makes money, GREEDY & EGO will not make money.
Also, magically these breakouts tend to prove that the companies turn around and fundamentally becoming strong. Also the magic happens when more diversification is done in various sectors under various scripts with equal money invested in each N500 scripts.
The real deal is when to purchase and where to purchase the stock. That is where Breakout study comes into play.
LET'S PUMP IN SOME MONEY AND REVOLUTIONIZE THE NATION'S ECONOMY!
How to Identify a True Breakout vs. a False Breakout?
Hello Traders! Identifying breakouts correctly is one of the most crucial skills in trading. A true breakout can lead to strong trending moves, while a false breakout can trap traders and trigger stop-losses. Let’s explore how to differentiate between the two and avoid unnecessary losses!
1. True Breakout: Signs to Look For
High Volume Confirmation – A real breakout is accompanied by a significant increase in trading volume, confirming strong buying or selling pressure.
Clear Support & Resistance Levels – The price must break above a key resistance (bullish) or drop below a strong support (bearish) with conviction.
Retest of the Breakout Level – Many true breakouts retest the breakout level before continuing the trend. This pullback provides a great entry opportunity.
Strong Candlestick Formation – A bullish breakout should have a solid green candle closing above resistance, while a bearish breakout should have a strong red candle closing below support.
Trend Confirmation – If the breakout aligns with the overall market trend, it has a higher probability of succeeding.
2. False Breakout: Warning Signs to Avoid
Low Volume Breakout – If the price moves beyond resistance/support without a surge in volume, it’s likely a false breakout.
Quick Reversal After Breakout – If the price immediately returns inside the range, it indicates weak momentum and a possible trap.
Fakeout Candlestick Patterns – Watch for wicks and long shadows at breakout levels, as they suggest a rejection instead of a real move.
No Follow-Through – A breakout should be followed by sustained price movement in the breakout direction. If the price stalls, it could be a fake move.
Breakout Against the Trend – A breakout that goes against the prevailing market trend is more likely to fail.
3. Pro Tips to Trade Breakouts Successfully
Wait for the Retest – Many traders enter after confirmation from a successful retest of the breakout level.
Use Volume Indicators – Tools like OBV (On-Balance Volume) and Volume Profile help confirm if the breakout is valid.
Set Stop-Loss Wisely – Place stop-losses below the breakout level for long trades and above the level for short trades to avoid whipsaws.
Look for Confluence – If the breakout aligns with moving averages, RSI, or Fibonacci levels, it has a higher probability of success.
Conclusion
A true breakout offers great trading opportunities, but recognizing false breakouts is equally important to avoid traps. Always wait for confirmation, use volume analysis, and stick to your risk management plan.
Have you ever fallen for a false breakout? Share your experiences in the comments below! 🔥👇

Amber Enterprises Breaks Out from Double Bottom – Bullish ViewHello Everyone , i hope you all will be doing good in your life and your trading as well. Today i have brought a trading idea on the double bottom chart pattern. Stock name is Amber Enterprises. So let's start guy's
Amber Enterprises (NSE) has given a strong bullish breakout from a double bottom pattern on the daily chart, indicating a potential trend reversal . The breakout has been accompanied by strong volume , confirming buyers’ dominance at current levels. If the stock sustains above the entry zone of 6190-6135, it could gain further momentum towards the first target of 6663, followed by 7171, and a long-term target of 8094. A stop loss should be placed below 5473 to manage risk effectively. This setup presents a good risk-to-reward opportunity for swing traders, but proper risk management is crucial before entering the trade.
Fundamental Ratios
Market Cap
₹ 20,886 Cr.
Current Price
₹ 6,175
High / Low
₹ 8,177 / 2,991
Stock P/E
94.0
Book Value
₹ 624
Dividend Yield
0.00 %
ROCE
10.2 %
ROE
6.74 %
Face Value
₹ 10.0
Industry PE
42.4
Debt
₹ 2,032 Cr.
EPS
₹ 65.9
Promoter holding
39.7 %
Intrinsic Value
₹ 1,819
Return over 5years
33.5 %
Debt to equity
0.96
Net profit
₹ 232 Cr.
Disclaimer: This analysis is for educational purposes only. Please consult a financial advisor before making investment decisions.
If you Found this helpful? Don’t forget to like, share, and drop your thoughts in the comments below.

ONGC I OIL Burning Bright : Inverted H&S Pattern!!Hello Traders,
- ONGC is trading at a place called AOI (Area of Interest) A place from where price usually reverses.
- 218 levels is acting as a strong support pushing prices higher after a intraday low of about 3% making a big pin bar candle on 1D chart
- Inverted head and shoulder on 15m timeframe.
PRO TIP/-
The Entry Line is the Neckline of the inverted Head and shoulder.
Target 1:- 228
Target 2 :-231
Entry Criteria
Strong Close above Entry Line (225) 15mins TF
Stoploss
Entry Candle Low (not more than 0.8%)
Not an Investment Advise

Nifty Price Action 6 March & Special Pattern Trading StrategyI make educational content videos for swing / positional trading

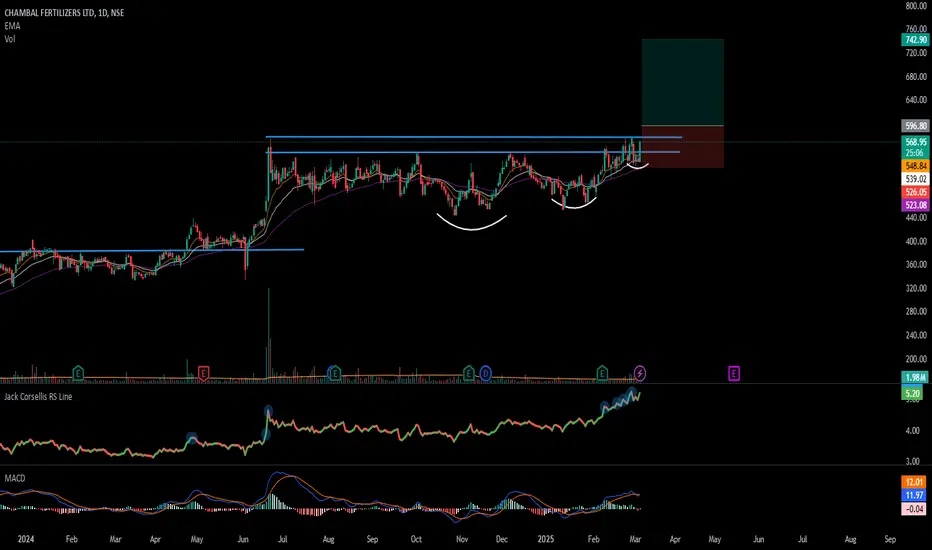
#CHAMBLFERT – VCP Pattern Forming! Keep It on Your Radar! 📊 Script: CHAMBLFERT
Key highlights: 💡⚡
📈 VCP in DTF
📈 Wait BO with Volume in DTF
📈 Wait for consolidation
📈 MACD needs to give a Bounce
📈 Price consolidated for 258 days
📈 One can go for Swing Trade
⚠️ Over All Market condition is bad, Practice paper trading
🟢 If you have any questions regarding the setup, please feel free to leave your inquiries in the comments, and I will respond promptly.
BUY ONLY ABOVE 596 DCB
⏱️ C.M.P 📑💰- 562
🟢 Target 🎯🏆 – 20%
⚠️ Stoploss ☠️🚫 – 10%
⚠️ Important: Always Exit the trade before any Event.
⚠️ Important: Always maintain your Risk & Reward Ratio.
✅#Boost, #Like & #Follow to never miss a new idea! ✅
Disclaimer: I am not SEBI Registered Advisor. My posts are purely for training and educational purposes.
Eat🍜 Sleep😴 TradingView📈 Repeat 🔁 – MMT
Happy learning with MMT. Cheers!🥂
AngleOne Ltd Stock Analysis**GlobalTradeHub | AngleOne Ltd Stock Analysis**
**Fundamental Analysis:**
AngleOne Ltd, a leading brokerage firm in India, has shown strong revenue growth driven by increasing retail participation. The company benefits from a growing client base and rising trading volumes. However, competition from discount brokers and regulatory risks are key factors to watch.
**Technical Analysis:**
The stock is trading in an uptrend but facing resistance near ₹1,900. A breakout above this level could push it toward ₹2,050. Strong support is seen at ₹1,750, with further downside risk if breached. RSI is near 60, indicating bullish momentum but nearing overbought territory.
**Key Levels:**
- **Resistance:** ₹1,900 / ₹2,050
- **Support:** ₹1,750 / ₹1,650
**Conclusion:**
AngleOne Ltd remains a strong player in the brokerage space. A breakout above resistance could fuel further upside, while traders should watch support levels for potential dips.

#CHOLAFIN - VCP / C&H BO in DTF📊 Script: CHOLAFIN
Key highlights: 💡⚡
📈 VCP in DTF
📈 BO with Volume
📈 MACD gave a Bounce
📈 Price consolidated for 85Days
📈 One can go for Swing Trade
⚠️ Over All Market condition is bad, Practice paper trading
🟢 If you have any questions regarding the setup, please feel free to leave your inquiries in the comments, and I will respond promptly.
BUY ONLY ABOVE 1435 DCB
⏱️ C.M.P 📑💰- 1433
🟢 Target 🎯🏆 – 6%
⚠️ Stoploss ☠️🚫 – 2.90%
⚠️ Important: Always Exit the trade before any Event.
⚠️ Important: Always maintain your Risk & Reward Ratio.
✅#Boost, #Like & #Follow to never miss a new idea! ✅
Disclaimer: I am not SEBI Registered Advisor. My posts are purely for training and educational purposes.
Eat🍜 Sleep😴 TradingView📈 Repeat 🔁
Happy learning with MMT. Cheers!🥂

SRF - BREAKOUT TRADE OPPORTUNITYSymbol - SRF
CMP - 2750
SRF Limited, a diversified global player, operates in segments like chemicals, textiles, packaging films, and fluorochemicals. The company is a leader in its respective industries, offering products across industries ranging from automotive to pharmaceuticals. With a strong presence in both domestic and international markets, SRF has built a reputation for delivering innovation and sustainable solutions.
SRF stock has recently broken out of a significant resistance zone that had held for the last 3.5 years, signaling a potential shift in its price action. This breakout is a critical technical event, as it suggests that the stock may now enter a new phase of upward momentum, having overcome a major hurdle. Currently, the stock is in the process of retesting this breakout zone, which is a natural price action behavior that presents an attractive entry point for long positions. The stock is now trading at around 2750, providing a solid opportunity for investors who are looking for a favorable risk to reward setup.
Looking at the broader technical picture, the target for this breakout is 3500, which aligns with past resistance levels and technical projections. Given the strength of the breakout and the current retest of the breakout zone, this suggests that the stock could head toward the target level over the medium term. The stop loss for this trade can be placed at 2500, which provides a reasonable cushion in case the price action reverses.
From a fundamental perspective, SRF's consistent performance across its diverse business segments, strong market positioning, and impressive growth outlook support the case for a potential long-term bullish trend. The company’s fundamentals, coupled with this technical breakout, provide a solid base for investors to initiate long positions at these levels.
In conclusion, SRF’s recent price action and technical breakout suggest a promising opportunity for medium to long term investors. The stock offers a favorable risk to reward ratio at its current price level, and the target of 3500 looks achievable over the medium term. The downside risk appears manageable, with the stop loss placed at 2500
Disclaimer - Do not consider this as a buy/sell recommendation. I'm sharing my analysis & my trading position. You can track it for educational purposes. Thanks!

Amazing breakout on WEEKLY Timeframe - CAMLINFINECheckout an amazing breakout happened in the stock in Weekly timeframe, macroscopically seen in Daily timeframe. Having a great favor that the stock might be bullish expecting a staggering returns of minimum 25% TGT. IMPORTANT BREAKOUT LEVELS ARE ALWAYS RESPECTED!
NOTE for learners: Place the breakout levels as per the chart shared and track it yourself to get amazed!!
#No complicated chart patterns
#No big big indicators
#No Excel sheet or number magics
TRADE IDEA: WAIT FOR THE STOCK TO BREAKOUT IN WEEKLY TIMEFRAME ABOVE THIS LEVEL.
Checkout an amazing breakout happened in the stock in Weekly timeframe.
Breakouts happening in longer timeframe is way more powerful than the breakouts seen in Daily timeframe. You can blindly invest once the weekly candle closes above the breakout line and stay invested forever. Also these stocks breakouts are lifelong predictions, it means technically these breakouts happen giving more returns in the longer runs. Hence, even when the scrip makes a loss of 10% / 20% / 30% / 50%, the stock will regain and turn around. Once they again enter the same breakout level, they will flyyyyyyyyyyyy like a ROCKET if held in the portfolio in the longer run.
Time makes money, GREEDY & EGO will not make money.
Also, magically these breakouts tend to prove that the companies turn around and fundamentally becoming strong. Also the magic happens when more diversification is done in various sectors under various scripts with equal money invested in each N500 scripts.
The real deal is when to purchase and where to purchase the stock. That is where Breakout study comes into play.
LET'S PUMP IN SOME MONEY AND REVOLUTIONIZE THE NATION'S ECONOMY!

Amazing breakout on WEEKLY Timeframe - MAHKTECHCheckout an amazing breakout happened in the stock in Weekly timeframe, macroscopically seen in Daily timeframe. Having a great favor that the stock might be bullish expecting a staggering returns of minimum 25% TGT. IMPORTANT BREAKOUT LEVELS ARE ALWAYS RESPECTED!
NOTE for learners: Place the breakout levels as per the chart shared and track it yourself to get amazed!!
#No complicated chart patterns
#No big big indicators
#No Excel sheet or number magics
TRADE IDEA: WAIT FOR THE STOCK TO BREAKOUT IN WEEKLY TIMEFRAME ABOVE THIS LEVEL.
Checkout an amazing breakout happened in the stock in Weekly timeframe.
Breakouts happening in longer timeframe is way more powerful than the breakouts seen in Daily timeframe. You can blindly invest once the weekly candle closes above the breakout line and stay invested forever. Also these stocks breakouts are lifelong predictions, it means technically these breakouts happen giving more returns in the longer runs. Hence, even when the scrip makes a loss of 10% / 20% / 30% / 50%, the stock will regain and turn around. Once they again enter the same breakout level, they will flyyyyyyyyyyyy like a ROCKET if held in the portfolio in the longer run.
Time makes money, GREEDY & EGO will not make money.
Also, magically these breakouts tend to prove that the companies turn around and fundamentally becoming strong. Also the magic happens when more diversification is done in various sectors under various scripts with equal money invested in each N500 scripts.
The real deal is when to purchase and where to purchase the stock. That is where Breakout study comes into play.
LET'S PUMP IN SOME MONEY AND REVOLUTIONIZE THE NATION'S ECONOMY!

Amazing breakout on WEEKLY Timeframe - SAREGAMACheckout an amazing breakout happened in the stock in Weekly timeframe, macroscopically seen in Daily timeframe. Having a great favor that the stock might be bullish expecting a staggering returns of minimum 25% TGT. IMPORTANT BREAKOUT LEVELS ARE ALWAYS RESPECTED!
NOTE for learners: Place the breakout levels as per the chart shared and track it yourself to get amazed!!
#No complicated chart patterns
#No big big indicators
#No Excel sheet or number magics
TRADE IDEA: WAIT FOR THE STOCK TO BREAKOUT IN WEEKLY TIMEFRAME ABOVE THIS LEVEL.
Checkout an amazing breakout happened in the stock in Weekly timeframe.
Breakouts happening in longer timeframe is way more powerful than the breakouts seen in Daily timeframe. You can blindly invest once the weekly candle closes above the breakout line and stay invested forever. Also these stocks breakouts are lifelong predictions, it means technically these breakouts happen giving more returns in the longer runs. Hence, even when the scrip makes a loss of 10% / 20% / 30% / 50%, the stock will regain and turn around. Once they again enter the same breakout level, they will flyyyyyyyyyyyy like a ROCKET if held in the portfolio in the longer run.
Time makes money, GREEDY & EGO will not make money.
Also, magically these breakouts tend to prove that the companies turn around and fundamentally becoming strong. Also the magic happens when more diversification is done in various sectors under various scripts with equal money invested in each N500 scripts.
The real deal is when to purchase and where to purchase the stock. That is where Breakout study comes into play.
LET'S PUMP IN SOME MONEY AND REVOLUTIONIZE THE NATION'S ECONOMY!

Amazing breakout on WEEKLY Timeframe - SUVENPHARCheckout an amazing breakout happened in the stock in Weekly timeframe, macroscopically seen in Daily timeframe. Having a great favor that the stock might be bullish expecting a staggering returns of minimum 25% TGT. IMPORTANT BREAKOUT LEVELS ARE ALWAYS RESPECTED!
NOTE for learners: Place the breakout levels as per the chart shared and track it yourself to get amazed!!
#No complicated chart patterns
#No big big indicators
#No Excel sheet or number magics
TRADE IDEA: WAIT FOR THE STOCK TO BREAKOUT IN WEEKLY TIMEFRAME ABOVE THIS LEVEL.
Checkout an amazing breakout happened in the stock in Weekly timeframe.
Breakouts happening in longer timeframe is way more powerful than the breakouts seen in Daily timeframe. You can blindly invest once the weekly candle closes above the breakout line and stay invested forever. Also these stocks breakouts are lifelong predictions, it means technically these breakouts happen giving more returns in the longer runs. Hence, even when the scrip makes a loss of 10% / 20% / 30% / 50%, the stock will regain and turn around. Once they again enter the same breakout level, they will flyyyyyyyyyyyy like a ROCKET if held in the portfolio in the longer run.
Time makes money, GREEDY & EGO will not make money.
Also, magically these breakouts tend to prove that the companies turn around and fundamentally becoming strong. Also the magic happens when more diversification is done in various sectors under various scripts with equal money invested in each N500 scripts.
The real deal is when to purchase and where to purchase the stock. That is where Breakout study comes into play.
LET'S PUMP IN SOME MONEY AND REVOLUTIONIZE THE NATION'S ECONOMY!
