LAURUSLABS : Breakout Stock#LAURUSLABS #vcppattern #vcpbreakout #breakoutstock #trendingstock
LAURUSLABS : Swing Trade / Short Term
>> Rally - Base - now ready for RAlly
>> Base = Beautiful Vcp pattern
>> VCP pattern Breakout with Volumes
>> Trending stock in Momentum
>> Good Strength & Volumes
Swing Traders can lock profit at 10% and keep Trailing
Please Boost, comment and follow us for more Learnings.
Disc : Charts shared are for learning purpose only, not a Trade recommendation. Do your own research and consult your financial advisor before taking any position.
Breakoutwithvolume

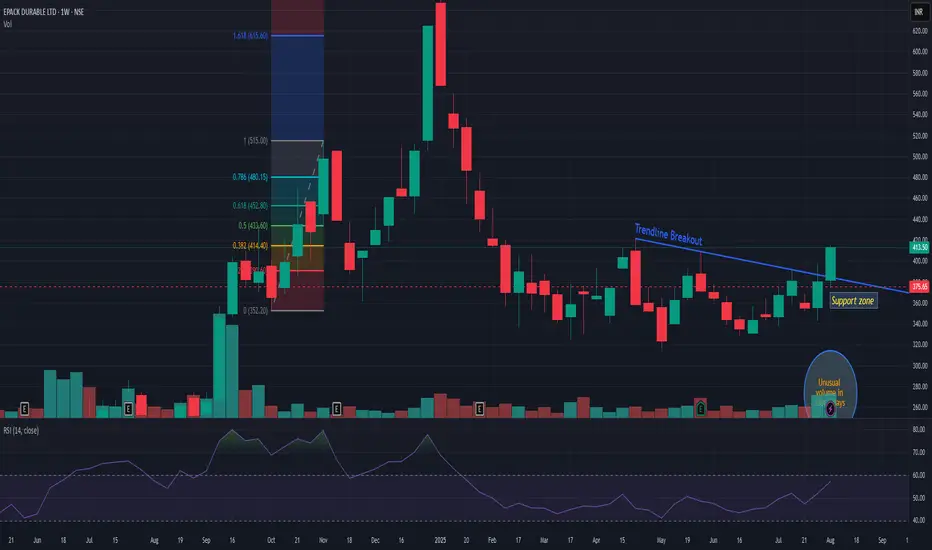
EPACKEPACK showing good strength after long bearish and then consolidation zone. It has been consolidating since February after steep fall from 660 levels. Now 390 is very strong support zone. So closing below it may change my view. On upper side I can see 510/85 resistance zone.
Welspun Corp Ltd - Breakout Trade Setup📌 Trade Plan
📈 Entry: Above ₹892
📉 Stop Loss (SL): ₹758 (Closing Basis) (Risk: ~15% from entry)
🔄 Retest Level to Watch: ₹844 (Wait for a retest for further addition)
📍 CMP: ₹872
📌 Why This Setup is Interesting?
✅ Strong Uptrend – Higher High (HH) & Higher Low (HL) structure intact
✅ Resilient Stock – Minimal decline during market corrections
✅ Base Breakout – Consolidated for 7 months, now breaking out
✅ No Overhead Resistance – Trading in open space with no historical supply
✅ Above Key DMAs – Trading above critical moving averages
✅ Channel Structure – Stock is inside a rising channel; 📌 Channel top might act as resistance
✅ Breakout Volume – Today’s volume confirms strength
📌 Market Context & Risks ⚠️
⚠️ Nifty & Overall Market just closed above the 50 DMA but is still weak. Wait for 200 DMA reclaim for confirmation.
⚠️ Breakouts are risky in a fragile market. FOMO can be costly—trade with patience.
⚠️ Position Sizing is Key! – Do not go all in; start small and scale gradually. If the market corrects and the stock remains strong, add later.
📌 Fundamental Snapshot 📊
Market Cap: ₹22,865 Cr
Stock P/E: 15.4
Book Value: ₹230
Dividend Yield: 0.61%
ROCE: 20.2%
ROE: 19.8%
Face Value: ₹5
📈 Pros:
✔️ Reduced Debt
✔️ Healthy Dividend Payout (34.9%)
✔️ Improving Sales YoY
⚠️ Cons:
❌ Stock trades at 3.51x Book Value
❌ Low ROE (11.5%) over the last 3 years
❌ Earnings include ₹873 Cr of other income
🛑 Disclaimer:
This is not financial advice. Risk management is crucial – ensure proper position sizing & stop-loss discipline. The market is still fragile, and breakouts can fail. Always do your own research before taking any trade. 🚀

Narayana Hrudayalaya Ltd - Trade Setup📊 Trade Plan:
Ideal Entry: ₹1,455 (Breakout level)
Current Entry: Small position above ₹1,701, wait for a possible retest to ₹1,455
Stop Loss: ₹1,290 (Closing basis)
Risk Percentage (From ₹1,701 to ₹1,290): 24.15%
Target: To be assessed post-retest confirmation
📈 Why This Stock?
✅ Strong Volume Spike: Recent breakout was supported by 4x-5x volume surge
✅ Broke Out of Consolidation: Now sustaining above previous range
✅ Resilient to Market Correction: Held strong despite broader weakness
✅ Trading Above Key DMAs: Indicates bullish structure
✅ Trading Inside a Strong Uptrend Channel: Stock has been respecting the trendline consistently
✅ RSI in Healthy Zone: Indicating potential room for further upside
✅ Clear Higher Highs & Higher Lows: Confirms the bullish momentum
📊 Key Fundamentals:
Market Cap: ₹33,616 Cr
Current Price: ₹1,645
52-Week High/Low: ₹1,692 / ₹1,080
Stock P/E: 42.9 (Relatively Low vs Sector Peers)
Book Value: ₹157
Dividend Yield: 0.24%
ROCE: 26.5% (Strong Capital Efficiency)
ROE: 31.4% (Healthy Profitability)
⚠️ Risks Involved:
❌ Deep Stop Loss (24.15%) – Requires high conviction, not suitable for short-term traders
❌ Potential Retest of ₹1,455 – Need to watch for confirmation before aggressive entry
❌ Sector Sensitivity: Hospitals & healthcare stocks can be affected by regulatory changes
🚨 Disclaimer:
⚠️ This is not financial advice. The trade involves high risk (24.15% SL) and we are trading against the broader trend. Ensure you do your own analysis and manage risk appropriately before taking any position. Trade cautiously! 🚀

Persistent Systems: A Promising Opportunity?Persistent Systems is currently trading in an ascending channel, indicating an ongoing uptrend 📈. After correcting nearly 20% from its all-time high (ATH)—which coincided with the channel top—it has now broken above a key trendline with strong volume and a wide-range bullish candle 💪.
📊 Key Technical Analysis:
🎯 Entry: ₹6,365
⛔ Stop Loss (SL): ₹5,538 (closing basis)
🏁 Targets:T1 (Previous ATH): ₹6,790 (+7%)
Positional Target: ₹7,681 (+21%)
Long-Term Target: ₹9,094 (+43%)
📌 Technical Highlights:
1⃣Persistent has bounced back from the 50 DMA, showing strong respect for this critical support level
2⃣Closed above the 50 DMA with a strong bullish candle (minimal upper wick, significant volume).
3⃣Trendline Breakout
4⃣RSI is rising, indicating upward momentum.
5⃣Channel top could act as resistance—keep an eye on price action near T1 levels.
🧮 Position Sizing:Start with 20-30% of your planned allocation at ₹6,365.
If ₹6,790 is broken with volume, consider adding more.
Partial profits can be booked at T1, with the remainder trailed for higher targets.
⚠️ Respect the SL (Stop Loss), as it represents a 12.45% risk.
📈 Why Persistent Systems Looks Attractive for Long-Term Consideration:
1. 🌟 Growth Drivers:
AI Integration: AI is a core focus for Persistent’s growth strategy, with significant investments in AI-driven solutions 🤖.
Strategic Acquisitions: Acquisitions like Starfish Associates (contact center modernization) and Arrka (digital governance and AI cybersecurity) enhance Persistent’s offerings.
📊 Revenue Momentum: The company has reported 18 consecutive quarters of revenue growth, recently achieving a robust 18.4% YoY increase.
🏆 Industry Recognition: Named the fastest-growing IT services brand in the 2024 Brand Finance India 100 report, highlighting its competitive edge.
2. 🛠️ Expansion Plans:
Focused on AI-led, platform-driven services to drive innovative solutions for clients.
Strengthened executive leadership to support non-linear growth through mergers, acquisitions, and large deals.
3. 💹 Respecting Key Support Levels:
Persistent has consistently respected the 50 DMA, a strong indicator of investor confidence and support at this level.
These factors, coupled with the company’s strategic focus on AI and consistent execution, make Persistent Systems an attractive consideration for long-term investment.
🌍 Broader Sector Context:
The IT sector is holding up well despite market volatility, and Persistent’s positioning in emerging technologies like AI ensures it is aligned with future trends 🔮.
💡 Final Thoughts:
This trade is against the trend, so trade light and manage risk effectively ⚖️. The channel top could pose resistance, but the overall structure and long-term prospects are promising. The probability of trades failing is high when the market is in a downward trend. Please keep that in mind.
If you find this analysis insightful, like and share to help others make informed decisions 👍.
Follow me for more educational trading ideas and detailed stock analysis 📚.
❗ Disclaimer: This is for educational purposes only. Please consult with your financial advisor before making any trading or investment decisions.

Zensar Technologies W pattern Breakout. 🚨 Zensar Technologies Trade Alert 🚨
🔍 Setup at a Glance:
Pattern: W-pattern forming within a trading channel 📈
Breakout Level: ₹840
Support Zones:
Channel support
200 DMA (holding since March 2024)
Trend: Overall uptrend, trading above key DMAs ✅
Volume: 🚀 2x-3x higher than previous sessions today!
RSI: Strong and supportive – signaling momentum.
💡 Trading Plan:
Entry: Above ₹840 (start small; e.g., buy just 10% of your usual quantity).
If the stock closes above ₹840, you can consider adding more.
Target (T1): ₹1025 (channel top) – +21% upside potential 🎯
Stop Loss (SL): ₹709 – -16% downside risk 🔻
Risk-Reward Ratio (RR): ⚖️ 1:1.3
⚠️ Key Risks & Considerations:
Market Structure:
Currently in a Lower High - Higher Low (LH-HL) sequence.
This trade goes against the broader trend – a higher probability of failure!
Why Consider It?
Exceptional volume and strong RSI, combined with a well-defined W-pattern and breakout level, make this setup compelling.
🚦 Risk Management Tip:
Example Position Sizing: If you usually buy 100 shares, start with only 10 shares initially.
⚠️ Disclaimer: This analysis is for educational purposes only.
Please assess your own risk tolerance and consult with a financial advisor before trading. 📘
💬 What’s your view on Zensar? Let’s discuss in the comments below! 👇

TRIVENITRIVENI showing very good strength with trend-line breakout along with quaterly highest volume. Seems it may take-off to new zone ahead. And also made a base nr 440-50 levels. Keep it in yr watchlist.

SYMPHONYSYMPHONY has given resistance breakout with decent volume. Showing trend continuation pattern.

CHAMBLFERT CHAMBLFERT has given breakout with decent volume. This time it may come out of long consolidation. Other stocks from fertilizer and chemical sector has also shown momentum.

6 Years Consolidation Breakout in BEPL || (456%) upside possibleHello Everyone, i have brought another stock which has given breakout of long consolidation almost 6 years. Stock name is Bhansali Engineering Polymers Ltd and it is engaged in manufacturing and sale of ABS Resins, AES Resins, ASA resins, SAN resins and their alloys with other plastics in the Indian market.
Its customers include leading companies dealing in Automobiles, Home Appliances, Electronics, Healthcare and Kitchenware.
Technically and fundamentally stock is really good with awesome management.
MACD is giving bullish crossover.
Price is above 200-DEMA.
Breakout already taken place and sustaining above to trendlines.
Everything is suggesting bullish reversal in stock. Stock is good for short term to long term. If anybody is holding stock at least for 1-2 years, we can get returns more than 200-500% returns. I have written all the levels on chart for short term to long term traders, go accordingly.
Business Overview:-
Company manufactures ABS (Acrylonitrile Butadiene Styrene) and SAN (Styrene Acrylonitrile) resins. ABS is used to make light, rigid, molded products such as pipe, automotive body parts, wheel covers, enclosures, and protective headgear. SAN is a plastic copolymer with thermal resistant and chemical resistant nature and its uses including housewares and consumer goods, various compounded products, packaging, appliances (electrical and electronic).
Focus:-
Company is focusing on expanding its presence in the ABS segment with a capacity expansion program. It plans to intensify its efforts to optimize its share of the ABS market segment, especially from the automotive industry with the support of its JV with Nippon.
Market Cap
₹ 3,903 Cr.
Current Price
₹ 157
High / Low
₹ 160 / 81.6
Stock P/E
21.6
Book Value
₹ 37.0
Dividend Yield
2.49 %
ROCE
24.4 %
ROE
18.1 %
Face Value
₹ 1.00
Industry PE
19.6
Debt
₹ 0.00 Cr.
EPS
₹ 7.22
Promoter holding
57.5 %
Intrinsic Value
₹ 106
Pledged percentage
0.00 %
EVEBITDA
14.6
Change in Prom Hold
0.00 %
Profit Var 5Yrs
31.1 %
Sales growth 5Years
-0.05 %
Return over 5years
27.2 %
Debt to equity
0.00
Net profit
₹ 180 Cr.
ROE 5Yr
28.8 %
Profit growth
32.3 %
Earnings yield
7.34 %
Disclaimer:- Please always do your own analysis or consult with your financial advisor before taking any kind of trades.
Dear traders, If you like my work then do not forget to hit like and follow me, and guy's let me know what do you think about this idea in comment box, i would be love to reply all of you guy's.
Thankyou.

Hindustan food limited is on breakout with good volume spikeHello everyone, i have brought a stock which has given a breakout of triangle pattern with huge volume spike on weekly chart, there is higher probability that we will see bullish uptrend momentum in this.
Hindustan Foods Limited is an India-based company, which is engaged in contract manufacturing of various FMCG products including food, home care, personal care, beverages etc. They also do manufacturing of leather shoes and accessories.
Technically stock is looking good as it has given breakout of triangle pattern with good volume
Price is above 200-DEMA.
Macd is also giving bullish crossover.
Morgan stanley has taken position on bulk.
Market Cap
₹ 6,397 Cr.
Current Price
₹ 558
High / Low
₹ 630 / 461
Stock P/E
68.8
Book Value
₹ 56.4
Dividend Yield
0.00 %
ROCE
15.4 %
ROE
18.2 %
Face Value
₹ 2.00
Industry PE
40.5
Debt
₹ 730 Cr.
EPS
₹ 8.12
Promoter holding
63.8 %
Intrinsic Value
₹ 256
Pledged percentage
0.00 %
EVEBITDA
30.9
Change in Prom Hold
-1.04 %
Profit Var 5Yrs
50.9 %
Sales growth 5Years
41.1 %
Return over 5years
43.8 %
Debt to equity
1.13
Net profit
₹ 93.0 Cr.
ROE 5Yr
18.2 %
Profit growth
30.8 %
Earnings yield
2.61 %
Disclaimer:- Please always do your own analysis or consult with your financial advisor before taking any kind of trades.
Dear traders, If you like my work then do not forget to hit like and follow me, and guy's let me know what do you think about this idea in comment box, i would be love to reply all of you guy's.
Thankyou.

IFCI - Cup & Handle patternAll details are given on chart. If you like the analyses please do share it with your friends, like and follow me for more such interesting charts.
Disc - Am not a SEBI registered analyst. Please do your own analyses before taking position. Details provided on chart is only for educational purposes and not a trading recommendation

Hindustan UnileverThis stock has given good breakout from cup-n-handle chart pattern on hourly and inverted head and shoulder chart pattern on daily, along with good intensity of volume.
As per previous price actions support and resistances areas & depth of cup pattern and also depth of head pattern, all are co-incidentally matching with trend based fib extension target levels up to 2750-2900.
One can go long at current levels or in dips (yes possible)
On the way down 20DMA and RK's stop line can provide good support now, which are pegged near 2278 - 2280 areas.
Inverted head and shoulder chart pattern breakout on daily chart
price action scenario along with Fibonacci extension levels
Breakout with good intensity of Volume
Cup n handle pattern breakout on weekly RSI
cup-n-handle chart pattern breakout on hourly chart
Price support resistance areas and trend based fib extension levels
RSI double breakout on daily chart and now above 60 & 70 levels.
RSI double Breakout on weekly chart and now above 60 levels.
MACD in weekly positive and now above zero line.
MACD in daily chart positive and now above zero line.
Most investors treat trading as a hobby because they have a full-time job doing something else.
However, If you treat trading like a business, it will pay you like a business.
If you treat like a hobby, hobbies don't pay, they cost you...!
Disclaimer.
I am not sebi registered analyst.
My studies are for educational purpose only.
Please Consult your financial advisor before trading or investing.
I am not responsible for any kinds of your profits and your losses.

BUY TEXMOPIPES (a micro-cap company with good fundamentals)Its a micro cap company, don't invest more than 4-5% of your capital.
PROS (as per screener.in) -
- Company has reduced debt.
- Company is almost debt free.
- Stock is trading at 0.74 times its book value
- Company is expected to give good quarter
- Company has delivered good profit growth of 29.09% CAGR over last 5 years
- Debtor days have improved from 53.85 to 38.54 days.
CONS (as per screener.in) -
- Though the company is reporting repeated profits, it is not paying out dividend
- Company has a low return on equity of 2.89% for last 3 years.
- Company's cost of borrowing seems high
Buy at 55-60 (Stock is in upper circuit)
Target as per Fibonacci: 80, 100, also can keep for long term
SL: 45
Follow me on tradingview @arsalanansari17

Zomato - 4 mth breakout post resultsBUY GUIDANCE:
Never buy before 3PM (for positional trading). I have been burnt many times over. Try to buy between 3:15 - 3:30PM, later the better.
SL: Depending on your risk appetite: Below Weekly BO Candle / Below Daily BO Candle / 50% of Weekly BO candle / Below 20DMA
TGT: After a 10-15%+ vertical move, breakdown of 20DMA (on a daily close basis)
SELL GUIDANCE:
Selling in Profit:
Sell earlier in the session when the prices are higher, around 11AM.
Selling at SL:
Give your stock a chance to recover by end of session. If it doesn't recover, sell anywhere between 3:00 - 3:30PM.
Note:
The breakout levels are derived from the weekly line chart which is respected much more by smart money.
DISCLAIMER:
I reserve the right to be wrong.
I am not a SEBI registered analyst. Please consult your financial advisor before investing.
ZLong

DLF Looking bullishBreakout & retesting of handle in Cup & Handle pattern. Add DLF at CMP till 290 for the first target of 346 and then next target could be 396. 323 level is going to be a crucial level, stock can see some resistance or consolidation at this level. Beyond this 323 level, first target is a easy hit. Also stock is trading above all the major EMAs as well.
Note: This is strictly for education purposes. I'm still learning the concepts of stock market. I'm not responsible for your profit or loss. Do your own analysis before taking any positions.

Biocon Bullish (W Pattern)Chart is self explanator, Can add near 390-395 levels for swing trades.
Note: This is strictly for education purposes. I'm still learning the concepts of stock market. I'm not responsible for your profit or loss. Do your own analysis before taking any positions.

Double Crossover Breakout Possible ! Dear traders , IOC can shoot like a rocket if this double trend line crossover is broken. A good breakout with volumes can make this stock multi-bagger as this is weekly chart so target levels will be high.
This chart analysis was done by me only for educational purpose. Feel free to share your feedback/queries.
