BTCUSDT – Selling Pressure is IncreasingThe price is retesting a strong resistance zone around 110,464 USDT, where heavy selling pressure previously emerged.
The likely scenario is that the price forms a Lower High pattern and then breaks the uptrend line → confirming a bearish trend.
Potential support area: 101,236 USDT, where price previously reacted.
Strategy:
Priority is to wait for sell opportunities around the 110,000–110,500 zone if a clear reversal signal appears.
Target at 101,200 USDT. Stop-loss placed above the resistance zone at 111,700 USDT.
News Supporting the Bearish Outlook:
The SEC has delayed approval of the spot Ethereum ETF, triggering negative sentiment in the crypto market.
Capital is flowing out of the market due to expectations that the Fed will maintain high interest rates for a longer period.
BTC-D

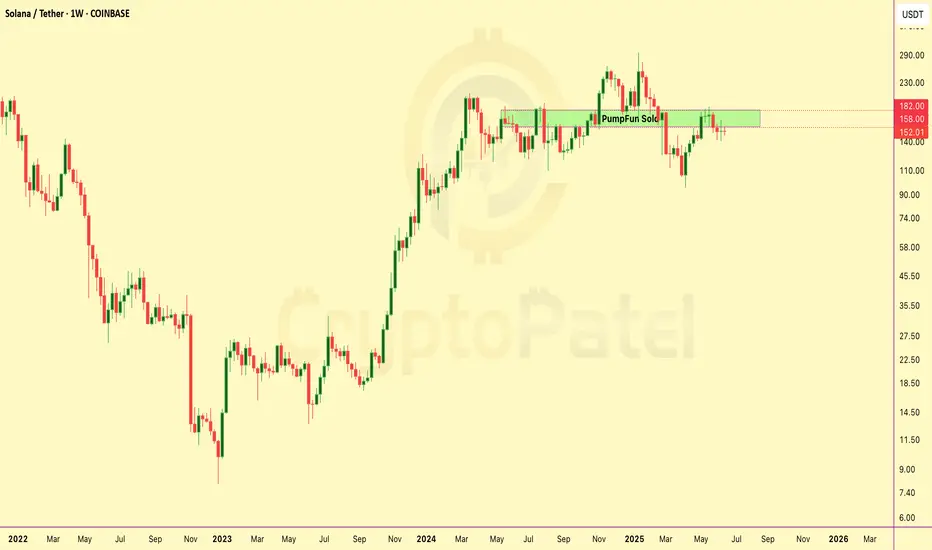
Pump.fun Sells $741M in SOL After X Suspension – What’s Really?Pump.fun Sells $741M in SOL After X Suspension – What’s Really Happening?
PumpFun (@pumpdotfun), a popular Solana-based meme token launch platform, was recently suspended from X — but they’ve been making major moves behind the scenes.
Since May 19, 2024, the platform has sold around 4.1 million SOL, worth nearly $741 million, at an average price of $180.
Here’s the full breakdown:
🔹 264,373 SOL sold for $41.64 million USDC at $158
🔹 3.84 million SOL, worth $699 million, sent to Kraken at $182
Why is Pump.fun selling so much?
Is this an exit strategy, or are they just managing risk?
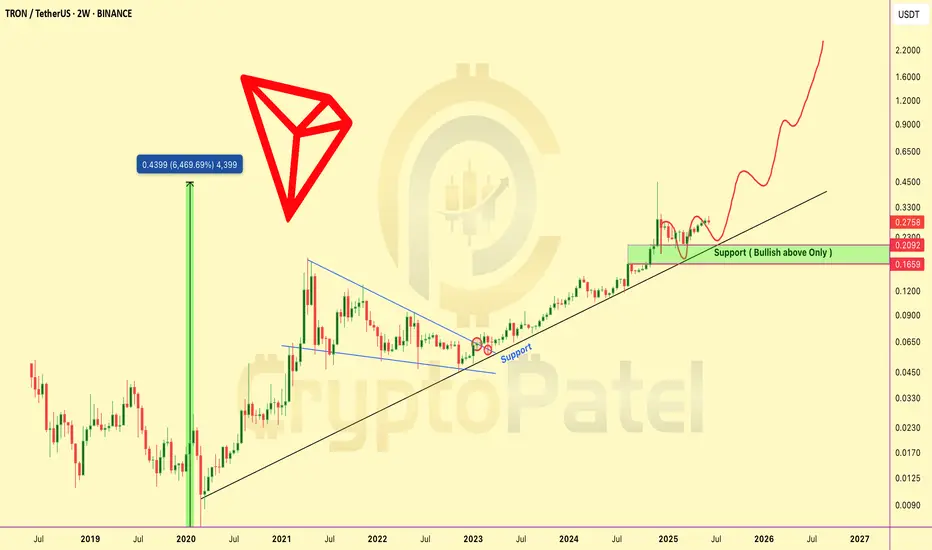
TRX NEXT EXPLOSION INCOMING? TRX NEXT EXPLOSION INCOMING?
TRX is showing a strong bullish setup after breaking out of a long-term consolidation pattern.
🔹 Price has cleanly broken out of a multi-year descending structure
🔹 Retested the key support zone around $0.21–$0.23
🔹 Still respecting the long-term ascending trendline from 2020
🔹 Historical move: 6,469% rally in the previous cycle — current structure suggests similar potential
Key Technical Levels to Watch:
🟩 Support Zone: $0.209–$0.230
🟩 As long as TRX holds above this level, bias remains bullish
🟩 This is a breakout + retest scenario.
🟩 Potential Upside Targets: $0.65 → $1.20 → $2.20+
The chart structure is indicating the possibility of a strong uptrend continuation, with bullish momentum building on higher timeframes.
TRX is technically strong and could be gearing up for a major leg higher if key support holds.
Add it to your watchlist. NFA & DYOR
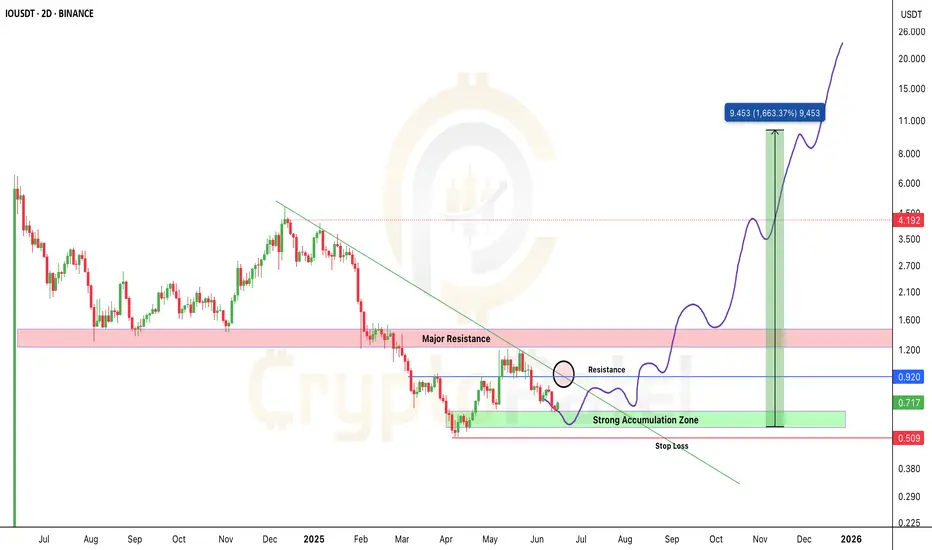
$IO Could Be the Next 100x AI Coin?SEED_ALEXDRAYM_SHORTINTEREST2:IO Could Be the Next 100x AI Coin — Don’t Miss This Supercloud Revolution
SEED_ALEXDRAYM_SHORTINTEREST2:IO is showing early signs of strength after bouncing from the key accumulation zone ($0.51–$0.73).
Structure still bullish.
A breakout above $0.92 = confirmation for next leg up.
If volume kicks in, SEED_ALEXDRAYM_SHORTINTEREST2:IO has macro breakout potential.
▶️ Entry Zone: $0.51–$0.73
▶️ Breakout Trigger: $0.92
▶️ Resistance Zone: $1.20–$1.60
▶️ Target: $5/$9/$15/$20
▶️ ROI Potential: 10x / 20x
❌ Invalidation: Break below $0.50
🔥 Long-term holders and breakout traders — don’t miss this.
io.net is turning idle GPUs into a supercloud to power AI, ML & big data — without relying on AWS or GCP.
✅ 90% cheaper than trad cloud
✅ 16,000+ GPUs live
✅ Built on Solana
✅ Backed by Multicoin, Delphi, Solana Ventures
🔰 Token Utility: Pay for compute | Staking rewards | Governance rights
This is DePIN + AI — a powerful combo. If adoption scales, SEED_ALEXDRAYM_SHORTINTEREST2:IO could be massive.
📢 If this analysis helped you, please RT & drop your thoughts in comments 👇
Let’s spread the alpha.
NFa & DYOR
ZKJ COIN DUMPING HARD — What’s REALLY Going On?ZKJ COIN DUMPING HARD — What’s REALLY Going On?
The price of Polyhedra Network’s $ZKJ has dropped sharply — falling over -87% in just a few days. But what’s really causing this?
A big reason is the token unlock on May 19 — over 15.5 million ZKJ tokens (worth around $30 million) were released into the market. That’s a lot of new supply, and many holders started selling.
At the same time, trading volume fell by 40%+, meaning fewer buyers and more pressure on price.
In total, ZKJ is down about 95% from its all-time high — and panic selling made things worse.
But here’s something most people are missing:
The project itself is still strong.
They have partners like Google Cloud, Revolut, Bima
zkPyTorch is live
📅 Heads up: Another big unlock is coming on June 19, so stay alert!

BTC Decision Point – Are You Watching This?BTC Decision Point – Are You Watching This?
Bitcoin is reclaiming momentum after sweeping liquidity at $102.7K. It's now pushing toward major resistance at $106.1K.
But the real battle? The bearish OB at $107.2K–$108.9K — where price nuked last time.
✅ Break above = clear skies toward new ATHs
❌ Rejection = another trip to $102K or even Under $100K
🔁 Retweet if this helped
💬 Drop your bias below: Long or short?👇

BTC Near $100K – Breakdown or Bounce?BTC Near $100K – Breakdown or Bounce?
BTCUSD – Will Bitcoin Hold ₹100K Support Equivalent? Signs of Weakness Amid Global Caution
🧭 Global Market Context
Bitcoin is facing some serious resistance after failing to hold above the $108K zone. And just as Indian markets react to global cues, BTC is showing signs of stress too.
🔺 US bond yields are climbing again – bad news for crypto risk appetite
🧊 Spot Bitcoin ETFs continue to attract inflows, but not strong enough to push new highs
💵 The US Dollar (DXY) is gaining strength again as investors flee risk — and that puts pressure on Bitcoin
Add to that the recent institutional sell-off, and it’s clear: BTC may need to “cool off” before another rally.
📉 Technical Picture (1H)
Bitcoin is showing a classic lower-high, lower-low pattern. A clear downtrend is in motion:
Price is below all key EMAs (34/89/200), with every rally being sold off
Important resistance sits at 106,000 – 107,000
Major support levels are now at 102,821, then 101,539, and if pressure continues — 100,419 (₹83+ lakh level for reference)
Momentum indicators like RSI are flat. No strength yet. And without a solid bullish candle from support, buyers may stay away.
🔎 Strategy Plan for Indian Traders
🔻 Short-term SELL Setup
Entry: 106,000 – 107,000
SL: 107,500
Targets: 102,821 → 101,539 → 100,419
🧠 Ideal for short-term traders looking to follow the trend
🔹 Medium-term BUY Setup (only if price reacts from 100K zone)
Entry: 100,500 – 100,800
SL: 99,800
Targets: 102,800 → 104,400 → 106,000
⚠️ Wait for bullish confirmation — avoid bottom fishing blindly
📌 Final Thought
Bitcoin is in a danger zone right now. If it loses grip on $100K support, we may see panic selling from leveraged traders. But this zone also holds opportunity — a strong bounce could spark a fresh rally.
🧘 Trade with patience. Don't chase. Let the market come to you.

BTCUSDT – Rebound from 104,200, recovery opportunity emergingBTCUSDT has bounced back from the 104,200 support zone with a potential double bottom pattern, signaling the return of buying pressure. The price is consolidating around the 106,000–107,000 area. If this zone holds, the probability of retesting the previous high at 110,500 is high.
The EMA34 and EMA89 are narrowing – a sign of weakening selling pressure.
Supporting news:
The Fed kept interest rates unchanged, U.S. CPI slightly declined, and capital inflows from ETFs like BlackRock are returning to the market, creating momentum for recovery.

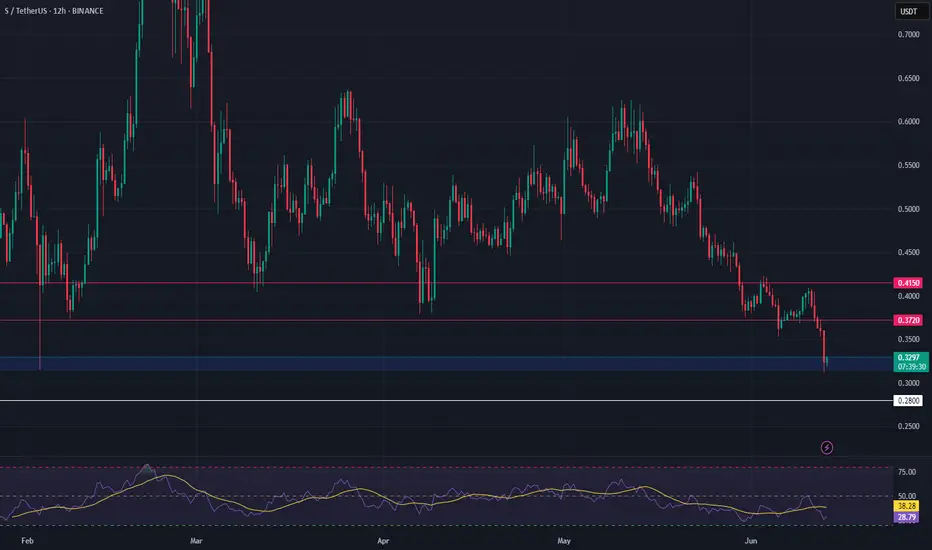
S Long Swing Setup – Retest of February Lows at Key SupportS is pulling back and now approaching a critical support zone, testing the February 2025 lows near $0.31. This area marks a key level for potential accumulation, offering a favorable long setup.
📌 Trade Setup:
• Entry Zone: $0.315 – $0.330
• Take Profit Targets:
o 🥇 $0.372
o 🥈 $0.415
• Stop Loss: Daily close below $0.280
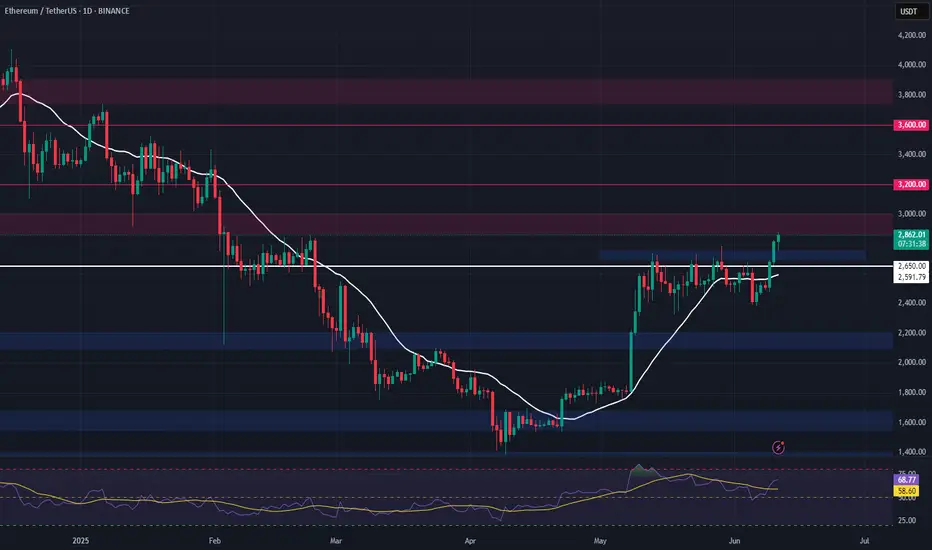
$ETH BLOODBATH: -15% Dump! Next Stop $2100? CRYPTOCAP:ETH BLOODBATH: -15% Dump! Next Stop $2100?
I shorted right from $2862 — nailed the move.
Now trading below critical $2550 support.
👉 Hold $2550? Reversal towards $3000-$4000 possible.
👉 Lose it? We likely fill $2100-$2200 FVG — 0.618 fib at $2116.
$2860 remains THE level to watch for a New ATH.
💬 Comment your ETH target!
🔁 Retweet if this helps your gameplan.

BITCOIN ANALYSIS UPDATE — READ THIS CAREFULLY!🚨 BITCOIN ANALYSIS UPDATE — READ THIS CAREFULLY! 🚨
Hope you followed our last BTC analysis — and DID NOT open any longs at the top.
If you followed: Congrats — you either made big profits on the short, or at least saved your money by not longing.
✅ We clearly warned when BTC was around $110K — more correction was coming.
Result? Bitcoin is now 7% DOWN since that call.
❗ Now the situation is DANGEROUS:
👉 BTC broke my Bullish Order Flow at $105K.
👉 If this $105K support doesn’t hold soon → we may see a deep correction towards $90K.
$105K is the level to watch like a hawk.
👉 Iran-Israel news just accelerated the fall — but we already predicted this move before the news.
🚫 NEVER gamble with your hard-earned money.
✅ Always wait for solid confirmation before entering trades.
👉 Stay smart. Stay safe. Stay patient.
💬 Comment your thoughts below.
🔁 Forward this to your crypto friends — they NEED to see this!
BITCOIN ANALYSIS UPDATE — READ THIS CAREFULLY! BITCOIN ANALYSIS UPDATE — READ THIS CAREFULLY!
Hope you followed our last BTC analysis — and DID NOT open any longs at the top.
If you followed: Congrats — you either made big profits on the short, or at least saved your money by not longing.
We clearly warned when BTC was around $110K — more correction was coming.
Result? Bitcoin is now 7% DOWN since that call.
Now the situation is DANGEROUS:
👉 BTC broke my Bullish Order Flow at $105K.
👉 If this $105K support doesn’t hold soon → we may see a deep correction towards $90K.
$105K is the level to watch like a hawk.
Iran-Israel news just accelerated the fall — but we already predicted this move before the news.
🚫 NEVER gamble with your hard-earned money.
✅ Always wait for solid confirmation before entering trades.
Stay smart. Stay safe. Stay patient.
Comment your thoughts below.
Forward this to your crypto friends — they NEED to see this!

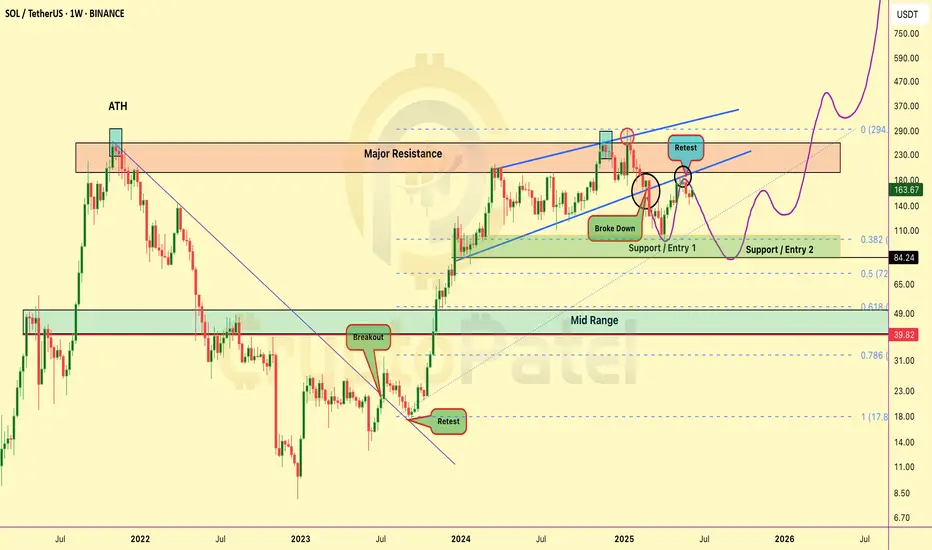
Is $SOL about to DUMP… or set up a MASSIVE BUY ZONE?Is CRYPTOCAP:SOL about to DUMP… or set up a MASSIVE BUY ZONE?
Solana is now at a critical level on the higher timeframe chart:
✅ After a breakdown, SOL is now retesting the bearish retest zone
✅ Strong resistance seen at $170–$180
✅ If rejected → price could dip toward the $100 range
But here’s the key: A dip to $100 would be a massive long-term buying opportunity for many investors (including me).
Long-term targets? I’m still eyeing $500 → $1000 if the macro trend plays out.
👉 Keep a close eye — the next few weeks could set up the next big move for $SOL.
Are you ready? Will you be buying the dip? Comment below! 👇
NFA & DYOR
ETH Long Swing Setup – Breakout Retest of Key ResistanceETH has broken above the critical $2,750 resistance, signaling bullish momentum. We’re now watching for a retrace into the $2,700–$2,750 zone, which is expected to act as support for a continuation higher.
📌 Trade Setup:
• Entry Zone: $2,700 – $2,750
• Take Profit Targets:
o 🥇 $3,000
o 🥈 $3,200
o 🥉 $3,700
• Stop Loss: Daily close below $2,650
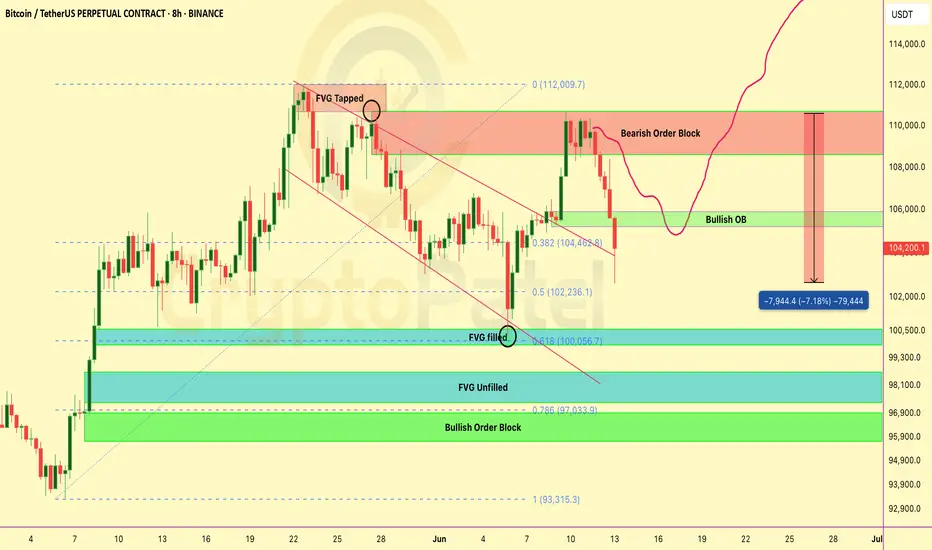
This BTC Pullback Could Be The Last Dip Before $120K+ — Are You #Bitcoin has just delivered a textbook breakout — but what comes next might surprise you. Let’s break it down: 👇
🔸 Bearish Order Block @ $109K–$110K
Price tapped into this zone and is currently reacting. Expect short-term volatility here.
🔸 FVG (Fair Value Gap) Filled + Tapped
A clean move back up filled the previous FVG — this typically signals strength but also invites sellers at OB zones.
🔸 Key Bullish Order Block @ $106K
If BTC pulls back, this zone will be crucial. A strong defense here could ignite the next leg up.
🔸 Fib Levels Aligned:
0.382 Fib @ ~$104.5K
0.5 Fib @ ~$102.2K
0.618 Fib & Bullish OB cluster @ ~$100K ( Filled )
Possible Play Ahead:
A dip toward $106K–$104K is healthy → watch for buyer reaction.
If CRYPTOCAP:BTC holds the $106K OB and bounces, a move back toward $112K+ ATH retest is very likely.
Big Picture:
The breakout from the descending channel + OB retest gives BTC strong bullish structure — as long as the $106K zone holds.
Are you ready for the next BTC move?
📈 Comment below: BULLISH or BEARISH?
🔄 Retweet to keep others in the loop!
NFA & DYOR

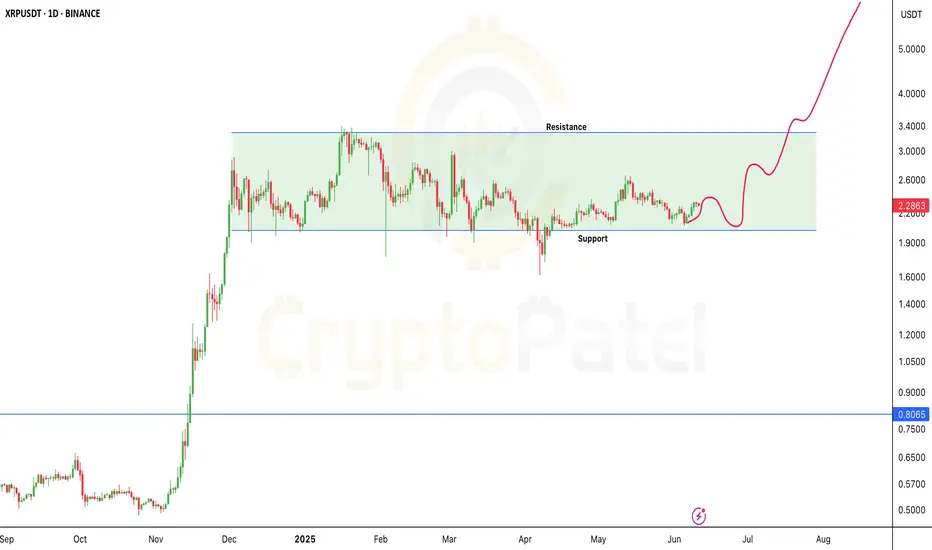
XRP Breakout Watch — Will June 16 Trigger a Bull Run?🚨 XRP Breakout Watch — Will June 16 Trigger a Bull Run? 🚨
CRYPTOCAP:XRP is holding above the key $2 support.
👉 A breakout above $2.65 → $3.00 is in play.
👉 Whale accumulation rising. Volume tightening.
👉 Ripple vs SEC ruling expected soon.
Targets if bullish: $3 → $8 → $13 🚀
Downside risk: Below $2 → $1.50 or lower.
Note: NFA & DYOR
BTCUSDT – Strong rebound, waiting to break previous highsBitcoin is maintaining a fairly positive uptrend after bouncing from the support zone around 105,245 USDT – a confluence area of the EMA89 and previous lows on the 8H chart. Currently, the price has approached the key resistance area between 110,192 and 111,931, which has previously rejected bullish attempts twice.
Price action suggests that BTC may temporarily pull back to gather momentum before continuing to test the green resistance zone around 113,331. A short-term accumulation pattern is forming with a higher-low structure – a good sign for buyers as long as the price holds above the 106,000 area.
On the news front, investor sentiment has improved following weaker U.S. jobs data, reinforcing expectations that the Fed may cut interest rates sooner. This has prompted a return of safe-haven flows to the crypto market, adding fuel to BTC’s upward momentum.

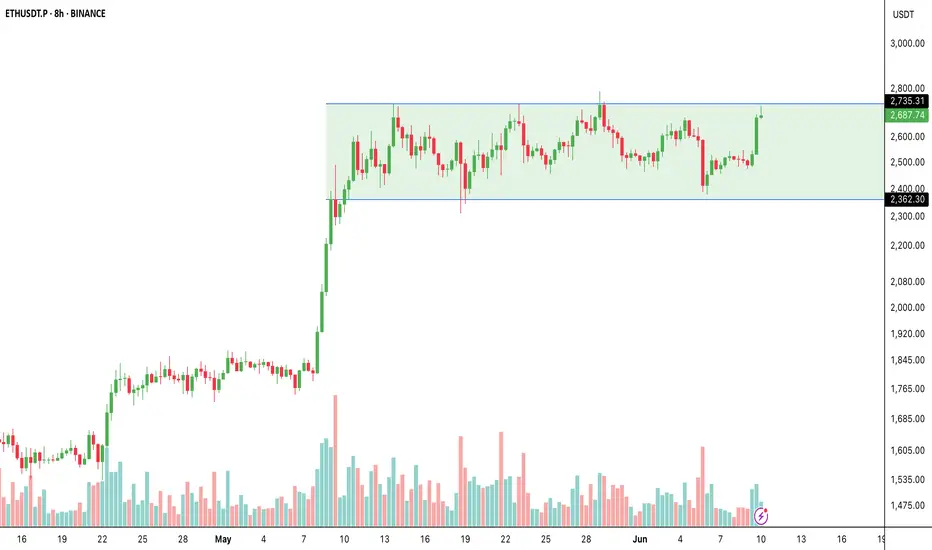
Ethereum Breakout Imminent?🚨 Ethereum Breakout Imminent?
CRYPTOCAP:ETH has been trading in a wide range:
👉 Support: ~$2,362
👉 Resistance: ~$2,735
Now ETH is once again testing this critical resistance zone with higher lows and rising volume — a classic breakout setup in play.
What to watch:
✅ Break & close above $2,735 → $2,800 → $2,900 → $3K
❌ Rejection → back to $2,400–$2,500 range.
Summary:
Ethereum is building momentum → next move could be explosive.
Will it break out or rotate? Stay sharp!
NFA & DYOR
Bitcoin is just 2% away from a new all-time high —will it break?Bitcoin is just 2% away from a new all-time high — will it break or fake? 🚀
BTC is currently trading near $109K–$110K, only 2% below the $112K ATH level.
Strong supports: $94,000 / $80,000
Bullish Case:
If BTC breaks $110K–$112K with strong volume + a bullish weekly close → we could see a rally toward: $135K → $150K
Bearish Case:
If BTC rejects at $110K–$112K, a deep retracement below $100K is possible. Watch for strong support at $100K and $80K levels.
My Personal Take:
I'm bullish overall — but since we’re this close to ATH, I’m opening a short trade with 3% stop loss targeting near $100K.
👉 Not financial advice — do your own research. The crypto market is highly volatile.
Watch this level closely — next big BTC move may be starting NOW. 👀

Why Is Hamster Kombat ($HMSTR) Dumping Hard?Why Is Hamster Kombat ($HMSTR) Dumping Hard? Here’s What’s Happening 👇
Hamster Kombat ($HMSTR) was one of the most anticipated airdrop tokens this year — but after going live, the token is now seeing a steep decline.
Here are the main reasons behind this big dump:
▶️ Massive Airdrop Sell Pressure
→ Over 131M users received free tokens
→ Many are selling immediately to lock in profits
→ Top wallets (insiders) are also unloading heavily
▶️ Weak Tokenomics
→ Circulating supply ~64B, max 100B
→ More tokens set to unlock = more selling expected
▶️ Community Frustration
→ Many users reported unfair airdrop mechanics
→ Only 88.75% unlocked at launch
→ Trust in the project took a big hit
▶️ Technical Issues
→ Telegram wallet & TON blockchain faced glitches during trading
→ Early trading experience was poor → More sell pressure
▶️ Tap-to-Earn Model Fatigue
→ The tap-to-earn hype is fading
→ Most players are cashing out, not holding or building
▶️ Bearish Chart Structure
→ Broke key support (~$0.00235)
→ No bullish signals yet — latest low ~$0.001214
Bottom line:
Right now, $HMSTR is following the typical pump & dump cycle we’ve seen with other tap-to-earn tokens. Until trust is rebuilt and real utility emerges, expect cautious trading ahead.
👉 Are you holding $HMSTR or watching from the sidelines?
#HamsterKombat #HMSTR #CryptoNews #CMC #Altcoins

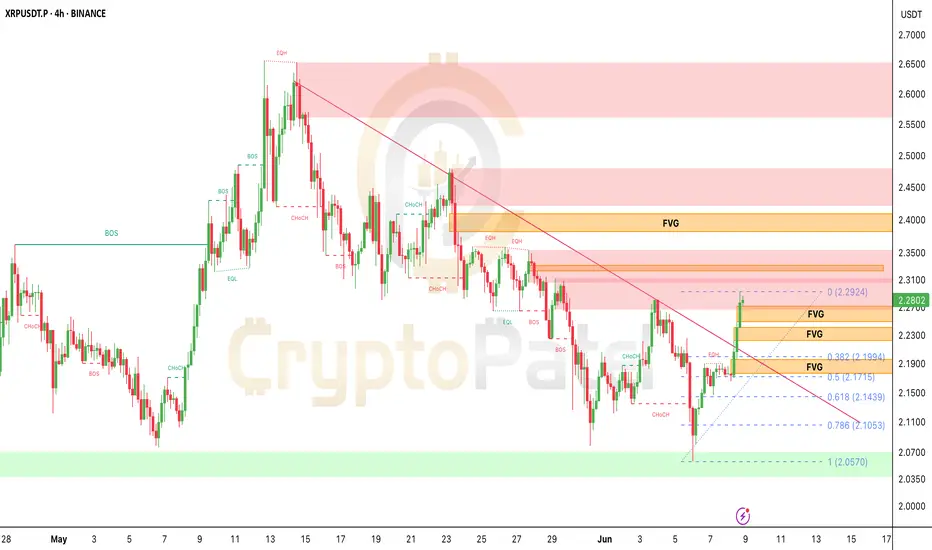
XRP/USDT 4H — Major Breakout Alert! 🔥 XRPUSDT 4H — Major Breakout Alert! 🔥
Here’s what I’m seeing right now on the XRP 4H chart:
✅ Bullish CHoCH + BOS → trendline broken → market flipped bullish.
✅ Testing $2.29 FVG → buyers pushing strong.
✅ Volume confirms true breakout.
🎯 Next upside targets → $2.36 → $2.42 (supply zone).
Best buy zone on pullback → $2.17-$2.14 (confluence of FVG + 0.618 Fib + demand).
Bias: Bullish → Only flips neutral if $2.14 breaks down.
Pro Tip: Wait for pullback if not in yet → better R:R at $2.17-$2.14 zone.
What’s your target for CRYPTOCAP:XRP this week? Comment below! 🚀
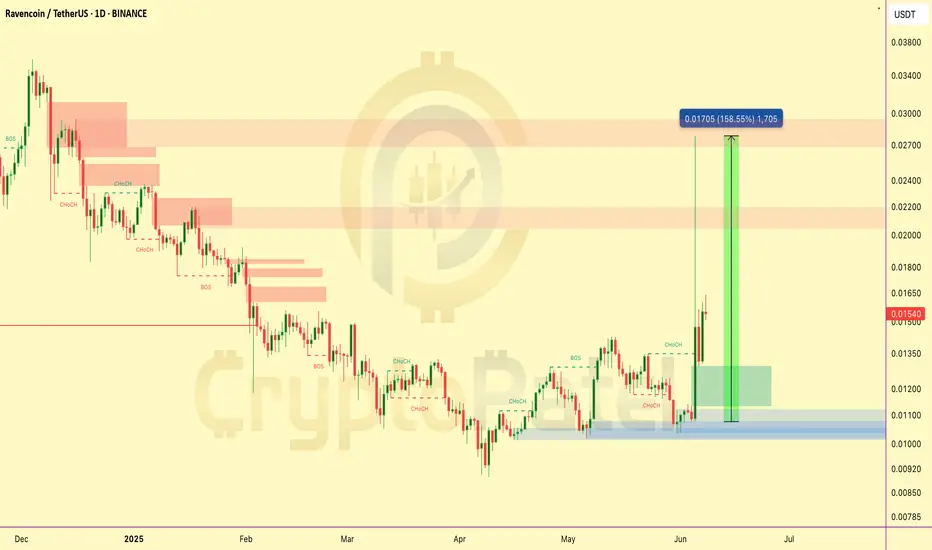
RVN/USDT Just Flipped Bullish —But Caution:High Volatility AheadRavencoin ( NGM:RVN ) pumped 158% within the last 4 days, but after the rally, it dumped -42% — showing a classic highly volatile pump & dump behavior.
👉 This type of move signals caution — it’s best to avoid blindly entering such setups.
✅ The upside rally tapped all key Bearish Order Blocks — leading to the sharp rejection.
✅ Despite the drop, RVN is still trading +45% above the recent 4-day bottom — volatility remains very high.
Current downside FVG (Fair Value Gap) → $0.01132–$0.01296
→ If price taps this zone, it could offer a better risk/reward entry — but only for experienced traders watching closely.
Summary: The chart currently does NOT look ideal for fresh entries — stay patient and let the structure develop.
👉 Save this post to stay updated — I’ll share if a new safer entry emerges!
NFA & DYOR
Bitcoin Bulls vs Bears — Battle Zones Mapped Out#Bitcoin Bulls vs Bears — Battle Zones Mapped Out
🔰 $105K–$106.7K = Bearish Order Block:
Below this zone = CRYPTOCAP:BTC stays bearish unless HTF closes above $106.7K
🔰 Next Moves:
▪️ Likely retest $105K–$106K before next leg ↓
▪️ Target: $97K–$95K zone
🔰 Key Levels:
✅ Holding 0.618 Fib (support)
✅ Unfilled FVG: $97K–$98.3K
✅ Bullish OBs: $95.7K–$97K | $93.5K–$94.7K
If $97,000 holds strong → Expect BIG bounce!
