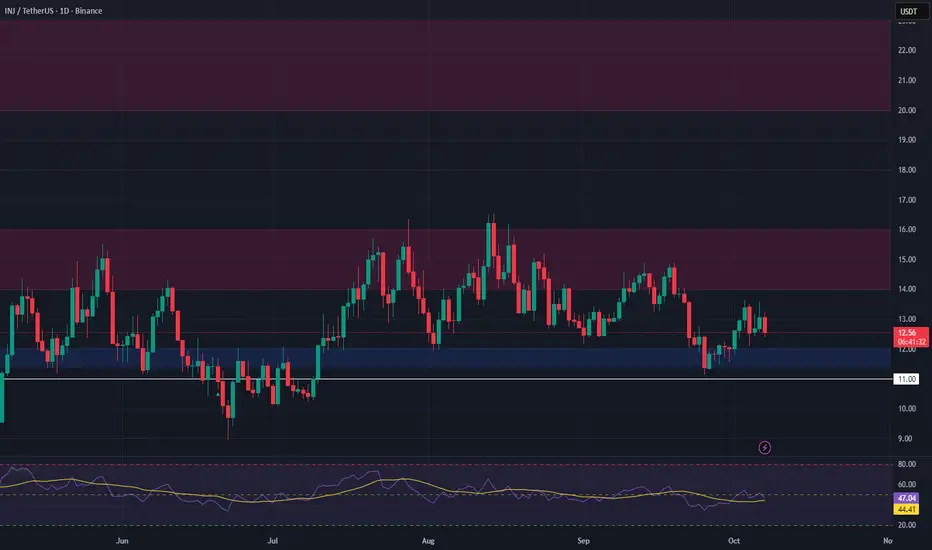
INJ Spot Trade Setup – Waiting for PullbackINJ has been rejected at resistance, and we are now watching for a pullback into the $11.40 – $12.00 support zone. This level has acted as a strong support area in the past and may offer a good entry point for a long spot position.
🔹 Entry Zone: $11.40 – $12.00
🔹 Take Profit Targets:
• TP1: $14.00 – $16.00
• TP2: $20.00 – $23.00
🔹 Stop Loss: Below $11.00 (conservative SL placement)
BTC-D
LINKUSD – Waiting for Pullback to Support Before Long EntryLINK was recently rejected at resistance, and we’re now watching for a pullback to confirm support before entering a long spot trade.
🔸 Trade Setup
We are targeting a long spot entry around $21.00 – $21.50, which aligns with prior structure and potential buyer interest. This zone could provide a strong foundation for a rebound if confirmed with price action or volume.
🔸 Targets & Risk Management
Take Profit 1: $27.00 – $31.00
Take Profit 2: $38.00 – $43.00
Stop Loss: Below $19.50
A clean bounce off support with a bullish structure would trigger the setup. Waiting for confirmation is key. As always, manage risk carefully.

BNB 400% up from our Entry People laughed when I said CRYPTOCAP:BNB will hit $2000–$3000.
but people still doubt my $2000–$3000 targets? 🤔
From 1st Entry of this bull run: +400% ( TP1 ✅ )
From $500 re-entry: +120%
You can doubt targets, but not momentum.
Just don’t forget — book profits.
Because trading without a safe zone = casino mode.
Not Financial Advice

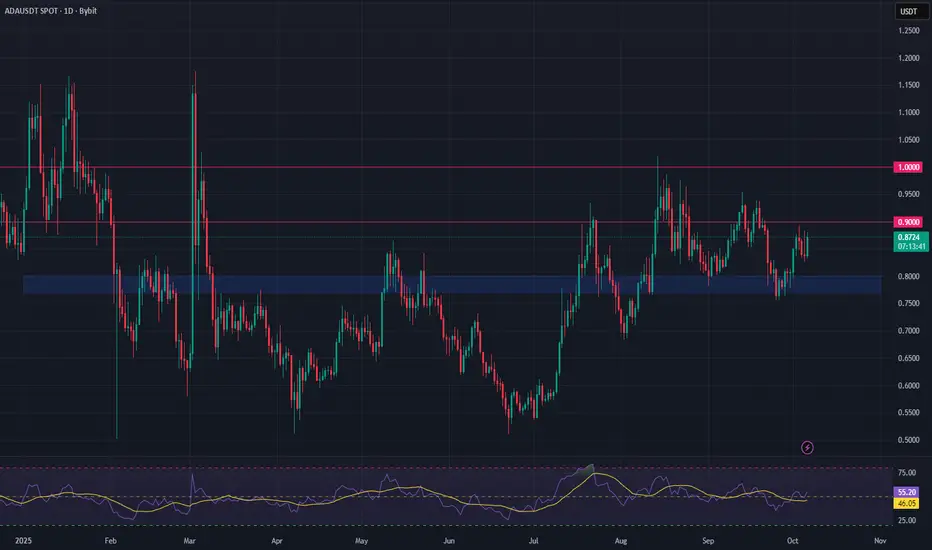
Cardano (ADA) – Bulls Regain Control, Eyes on $0.90 BreakoutCardano had a strong week, managing to hold above key support at $0.77 and closing with a bullish weekly candle. This price action signals a shift in momentum, with buyers back in control.
However, ADA now faces a critical test: the $0.90 resistance level. So far, bullish momentum hasn't been strong enough to force a breakout, but with the broader market showing strength, this level may not hold for long.
A confirmed breakout above $0.90 would be significant, opening the path for a potential move above $1 — a level not seen since mid-2022.
Looking forward, October has started with a strong bullish tone across the crypto market. If this continues, Cardano could be positioned for a fresh rally, provided bulls can take out the $0.90 resistance.
📌 Key Levels to Watch:
Support: $0.77
Resistance: $0.90
Target if breakout confirms: $1+
🟢 Bias: Bullish above $0.77
🔴 Risk: Failure at $0.90 could lead to a retest of support
XRP Breaks Above $3 – Bullish Momentum BuildsOverview:
XRP has officially closed the week above the $3 mark, a psychological resistance now turning into support. This is a major technical shift suggesting renewed bullish control.
🔑 Key Levels to Watch:
Support: $3.00
Short-Term Target: $3.20
Major Resistance / Magnet: $3.60 (All-Time High)
📊 Market Structure:
XRP appears to be breaking out of a consolidation zone between $2.70 and $3.00. This range held for several weeks, and a clean breakout could fuel a strong continuation toward previous highs.
🐂 Bullish Scenario:
Continued higher highs with volume could open the path to $3.20 and eventually $3.60.
A successful retest of the $3 level as support would further validate the breakout.
⚠️ Risk Note:
Watch for any fakeouts or low-volume rallies. A drop below $3 would negate the breakout and put the $2.70 support back in play.
📅 Outlook:
With Q4 2025 underway, a rally toward the ATH at $3.60 could be driven by both technical momentum and market sentiment.
💬 What’s your take? Are we heading for a new ATH this quarter?
📌 #XRP #Crypto #Altcoins #Breakout #TechnicalAnalysis #Q4Outlook

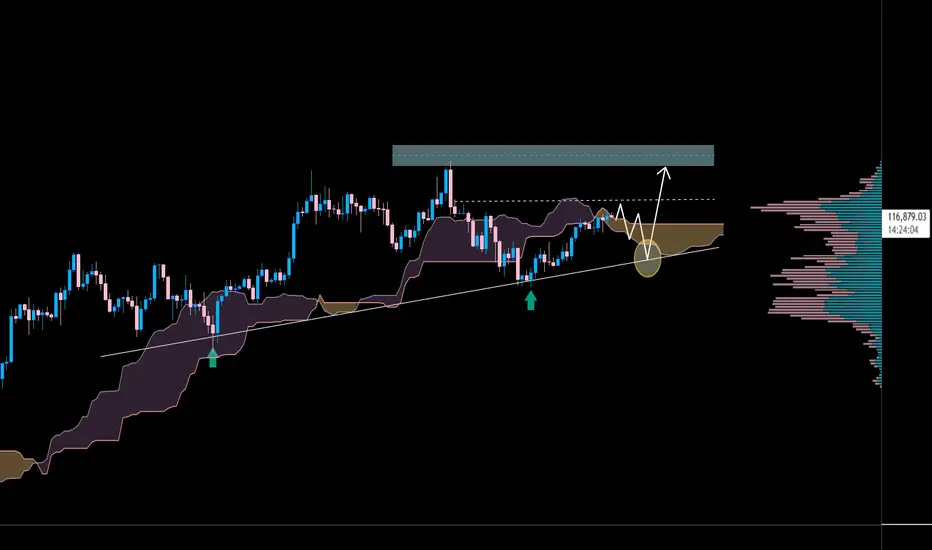
All The Target DoneHere's a breakdown of what the chart shows and why "target done" is applicable:
• The Movement: The chart displays a significant V-shaped recovery and surge starting around September 27th or 28th and continuing up to the current date (October 4th).
• The Target Area: The large green shaded box highlights the upward trajectory and covers the area where the price has been moving. The upper limit of this green box and the price levels around the $122,000 to $123,000 mark appear to be the region of the achieved target.
• Current Price Action: The current price is displayed as $122,506.9, which is at the upper end of the recent upward movement and well into the highlighted green zone.
• Inferred Trading Context: In a trading context, it suggests that a long (buy) position was likely entered near the bottom of the V-shape, perhaps around the $110,000 to $112,000 area, with a profit target set near the current price level. Since the price has reached or exceeded that upper range, the objective has been met, hence "target done."
In short, the chart clearly illustrates a successful, powerful move to the upside, indicating that the profit goal (target) for that particular trade setup has been achieved (done).

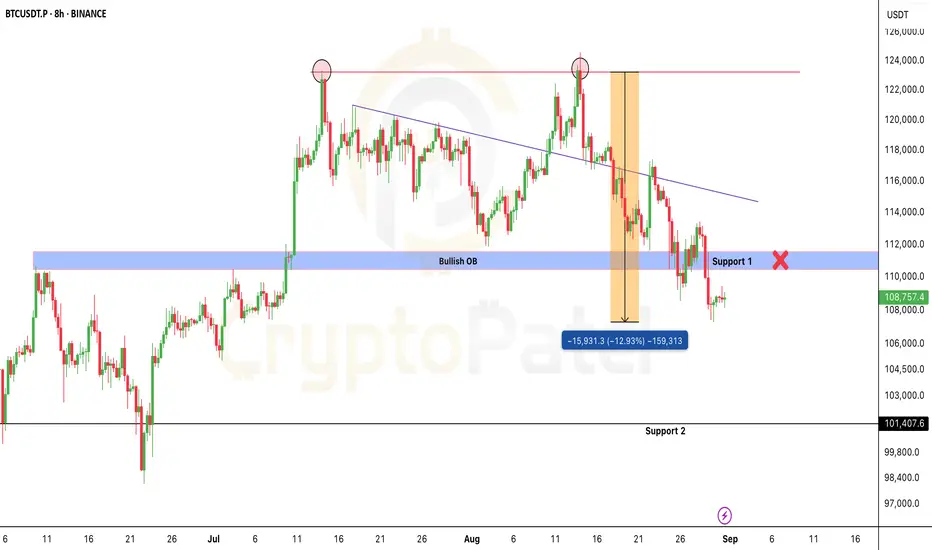
BTC Market Update – Bullish Trend RebuildingBTC Market Update – Bullish Trend Rebuilding
The market structure on Bitcoin highlights a sequence of expansion, consolidation, and sharp corrective phases. After reaching a peak around 115,000, the price shifted into a prolonged sideways phase, where liquidity built up before a decisive breakdown. This breakout introduced stronger bearish momentum, driving price toward lower ranges.
Currently, Bitcoin is stabilizing around 109,500 after the decline, with price action suggesting a potential extension into deeper liquidity zones near the lower range before regaining upward momentum. The projected flow reflects a scenario where downside movement acts as a liquidity sweep, providing the conditions for buyers to re-engage.
The broader outlook remains constructive. Even with short-term pressure favoring the downside, the long-term structure still supports recovery potential. A strong reaccumulation phase could lift Bitcoin back toward the 115,000 zone, aligning with the market’s tendency to reclaim imbalance after periods of sharp displacement.

BTC Crashes to 3-Week Low: A True Nerve Test for TradersHello fellow traders, Bitcoin has entered an extremely tense phase!
BTC has slipped below 109,000 USD, marking its lowest point in three weeks. The main pressure comes from the looming expiry of a massive 22-billion-USD options contract at the end of the month, which is driving strong short-term selling.
On the daily chart, prices keep getting rejected at the downtrend line and the Ichimoku cloud, confirming that bears still hold the upper hand.
The current scenario points to further downside, with key support zones at 104,000 USD (TP1) and 98,900 USD (TP2).
These are the critical “do-or-die” levels to watch closely — only if BTC manages to hold above them can we expect a recovery once the options-driven selling pressure eases.
In short: Bitcoin is at a make-or-break moment. Traders, keep your stops tight and stay alert!

BTC LONG SETUPBTC/USDT – 1H Long Setup Analysis
🔹 Current Price: 111,653 USDT (Bitget Perpetual)
🔹 Trend: After a sharp drop from recent highs, BTC is showing signs of forming a base with a possible rebound setup.
⸻
Key Observations:
1. Support Zone:
• Strong support is visible around 110,744 – 110,747 USDT, marked by previous demand and horizontal structure.
• Below that, deeper support lies near 109,383 – 108,534 USDT.
2. Resistance Levels / Targets:
• TP1: ~115,078 – 115,980 USDT
• TP2: ~117,340 – 118,165 USDT
• Higher extension target: ~119,810 USDT
3. Trend Structure:
• Price broke a rising channel but has bounced back after a correction.
• Current pullback is retesting demand, indicating potential continuation to the upside if bulls defend the base.
4. Indicators:
• EMA 9 (blue) is currently under pressure, suggesting short-term weakness, but if reclaimed, momentum could shift bullish.
• Volume shows increased activity at recent lows, hinting at accumulation.
⸻
Long Trade Plan (Swing Bias):
✅ Entry Zone: Between 111,000 – 111,700 USDT (current price zone, near support)
✅ Stop-Loss: Below 110,744 USDT (to avoid fakeouts)
✅ Take Profit Targets:
• TP1 → 115,078 – 115,980 USDT
• TP2 → 117,340 – 118,165 USDT
• Extended TP → 119,810 USDT
📊 Risk-Reward Ratio: Favorable (approx. 1:3+ if targeting TP2).
⸻
Summary:
BTC is consolidating above a strong support base. If bulls hold the 111K–110.7K zone, upside targets remain valid towards 115K–118K. A break below 110.7K would invalidate this setup and could push price toward 109K or lower.

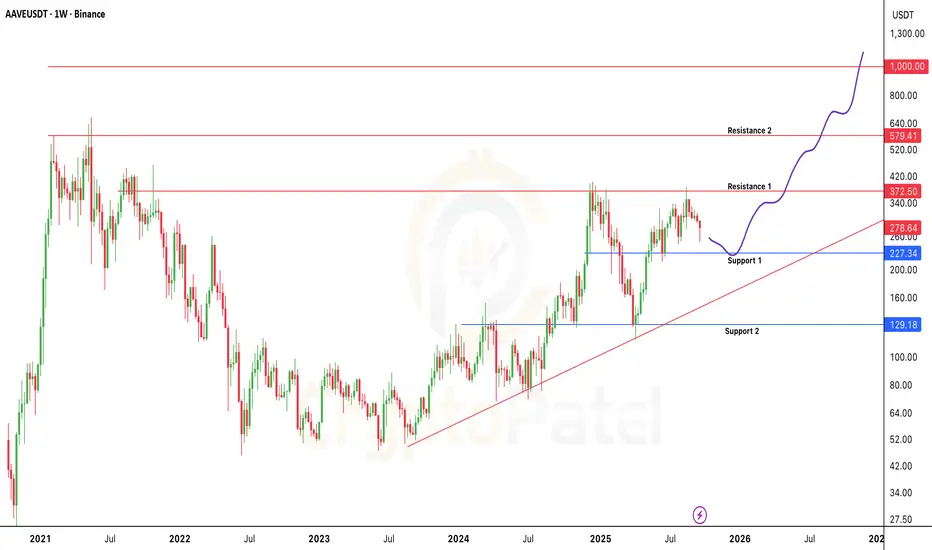
AAVE/USDT Potential to hit $1000Why CRYPTOCAP:AAVE could hit $1000 🚀
V4 launch: Major upgrade boosting fees, TVL & adoption
GHO stablecoin grows, adding revenue
Buybacks + more liquidity driving value
Bear Case:
If Market crash then We can see $200-$150
AAVE has the potential to explode, but watch these risks.
NFA & DYOR
BTCUSDT Set to Explode: Strong Uptrend Ahead!Hello everyone, today we’ll analyze an exciting opportunity with BTCUSDT, evaluating its strong uptrend and the potential to reach new highs.
BTCUSDT is trading on a strong upward trendline , with support levels at 110,500 and a high target of 123,700. The chart shows a breakout from an important resistance zone, with the price also positioned above the Ichimoku cloud , reinforcing the bullish trend.
Capital inflows into Bitcoin ETFs and the Fed’s decision to cut interest rates have created a favorable environment for Bitcoin , making the possibility of reaching new highs even stronger.
With favorable technical signals and macroeconomic factors , BTCUSDT is likely to continue its strong upward movement. However, always check support levels to manage risk effectively.
Wishing you successful trading!
Bitcoin Market Report – Liquidity Grabs Before Next ExpansionThe market is showing clear signs of engineered volatility, with strong impulsive moves followed by rapid retracements. This behavior reflects liquidity targeting, where price sweeps both sides before resuming its broader path.
Current conditions suggest Bitcoin is in a redistribution stage, with momentum alternating to trap short-term participants. The repeated liquidity grabs signal that larger players are accumulating positions while clearing out weaker hands.
The overall structure points to continued testing of lower liquidity pools before any major directional expansion. Once this phase is complete, the market is likely to enter a more decisive trend, supported by the buildup of institutional flow and reduced volatility pockets.
In short, Bitcoin is cycling through liquidity collection and preparation, positioning itself for a larger move as market balance shifts.

Btc 1H long ideaHere's a detailed description of the information presented:
• Financial Instrument: The chart is for Bitcoin (BTC) priced against USDT (Tether), a stablecoin. The "Perp Perpetual Mix Contract" suggests this is a futures or derivatives contract that doesn't expire.
• Timeframe: The chart is set to 1-hour (1H), meaning each candlestick represents one hour of price movement.
• Trading Position: A long position is currently open, indicated by the green and red boxes. A long position is a bet that the price will increase.
• Entry Point: The white horizontal line marks the entry price at 116,980.2.
• Take-Profit Target: The top of the green box, labeled "Target," is at 119,810.0. The potential profit for reaching this target is 3,517.2 USDT, which is a 3.02% gain.
• Stop-Loss: The bottom of the red box, labeled "Stop," is at 114,658.0. This is the price level where the trade will automatically close to limit losses. The potential loss is 1,646.4 USDT, or a 1.42% drop.
• Risk/Reward Ratio: The text "Risk/Reward Ratio: 2.14" indicates that the potential profit is 2.14 times greater than the potential loss. This is a key metric used by traders to evaluate if a trade is worth the risk.
• Price and Indicators:
• The current price is shown as 117,210.1.
• The chart includes various indicators and tools, such as moving averages (the blue and yellow lines moving with the price) and a volume histogram at the bottom (red and green bars).
• There are also horizontal white lines that likely represent significant support and resistance levels.
In summary, the image provides a clear visualization of a planned crypto trade, outlining the specific entry, stop-loss, and take-profit levels, as well as the associated risk/reward profile.

BTC Price Action: Bulls vs BearsBTC Price Action: Bulls vs Bears
Bitcoin has shown a gradual recovery after a prolonged corrective phase, with market structure leaning toward a constructive buildup. Fundamentally, sentiment is influenced by global macro conditions—investors are watching U.S. monetary policy signals, while stable demand from institutions and long-term holders continues to provide a supportive backdrop. On-chain activity remains steady, with balanced exchange inflows and outflows suggesting no extreme directional pressure in the near term.
From a technical perspective, the market has shifted momentum from bearish flows into a developing bullish sequence. The recent break of structure on the 4H timeframe highlights strengthening upside intent, though price is still moving within a broader accumulation phase. Current flows suggest the possibility of a short-term dip for liquidity before continuation to higher levels, aligning with the overall constructive weekly outlook.

BTC LONG AND HAVING SUPPORT OVER THE CHANNEL Chart Overview
• Pair/Timeframe: BTC/USDT – 4H
• Exchange: Bitget
• Pattern: Breakout from a falling wedge / descending channel, shifting momentum bullish.
• Indicators:
• EMA 9 (yellow) and EMA 20 (blue) are crossing bullishly.
• Volume spike supports the breakout.
⸻
Price Action
• BTC broke out of the descending trendline (blue) and retested support before moving higher.
• Currently trading at 110,780 USDT (+1.46%).
• Strong bullish momentum is visible with higher lows forming since Aug 31.
⸻
Trade Setup
• Entry: Around breakout zone (near 110,000 – 110,500).
• Stop Loss (SL): Below 108,500 zone (highlighted red zone).
• Targets:
• TP1: 114,658 USDT
• TP2: 115,980 USDT
⸻
Key Levels
• Immediate Support: 109,383 – 108,534
• Major Support Zone: 107,200 – 107,386
• Immediate Resistance: 111,998 – 113,217
• Target Resistance: 114,658 (TP1) and 115,980 (TP2)
• High Reference: 117,340 – 117,345
⸻
✅ Summary: BTC has broken out of a falling wedge on the 4H chart with strong bullish confirmation. If price sustains above 110k, it could move toward 114.6k (TP1) and 116k (TP2). Losing 108.5k support would invalidate this bullish setup.

Btc long 1H TimeframeKey Observations:
1. Chart Type & Indicators:
• Timeframe: 1 Hour (1H)
• Indicators: EMA 9 (yellow), EMA 20 (blue) for short-term trend tracking.
2. Price Action:
• Current Price: 109,260 USDT
• Recently bounced sharply after a strong dip, showing bullish recovery.
3. Pattern:
• There’s a visible ascending triangle (orange lines), which usually indicates bullish continuation if price breaks upward.
• Price has broken out of the small ascending trendline with momentum.
4. Trade Setup (Long):
• Entry Zone: Around 109,260 USDT
• Target (TP):
• First resistance near 111,998 USDT
• Next major resistance around 113,217–113,431 USDT
• Stop Loss (SL): Around 107,200–107,386 USDT
5. Volume:
• Noticeable increase in buy volume at the breakout, confirming bullish pressure.
⸻
✅ Summary:
This is a long position setup based on breakout from an ascending structure. If BTC holds above the 109,000–108,500 support zone, it has potential to test 112k–113k levels. Stop loss is placed below the recent swing low (~107.2k).

Bitcoin Chart Analysis And Bearish overview #BTC Bearish Outlook
Bitcoin stays bearish below $113,400.
No H4 close above = downtrend intact, targeting the $100K psychological level.
Break $100K support, and liquidity near $90K becomes the next magnet.
Key levels:
$113,400 → HTF resistance
$100,000 → Psychological support
$90,000 → Demand zone
Already 13% down from our short entry, hope you caught the move. 🫡
NFA & DYOR
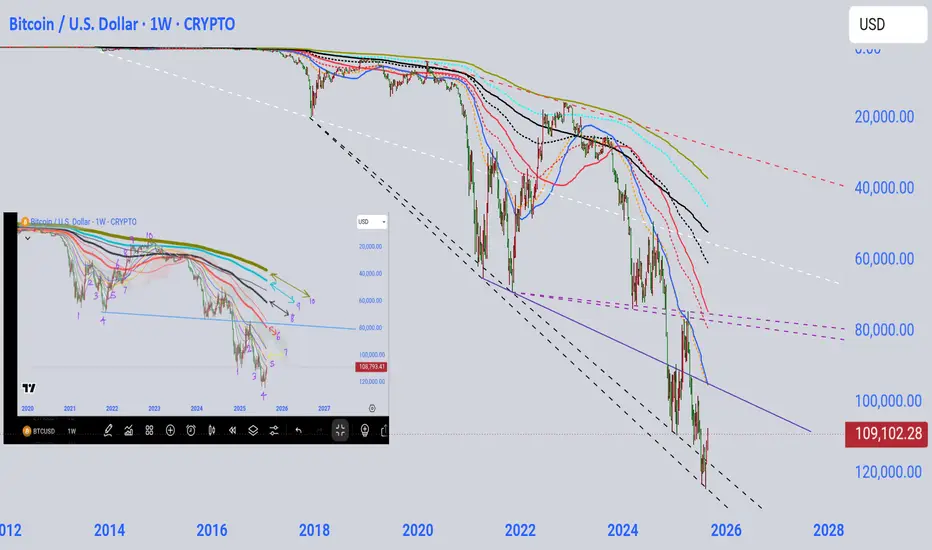
Btc heading towards 79k, cycle's bottom reversal below thatBtc's this bear moves seems started
And on approx, half of this cycle's top or ATH has to be taken into consideration for a rough calc
However 80k & 79k are psychologically confident values and btc looks like heading towards there
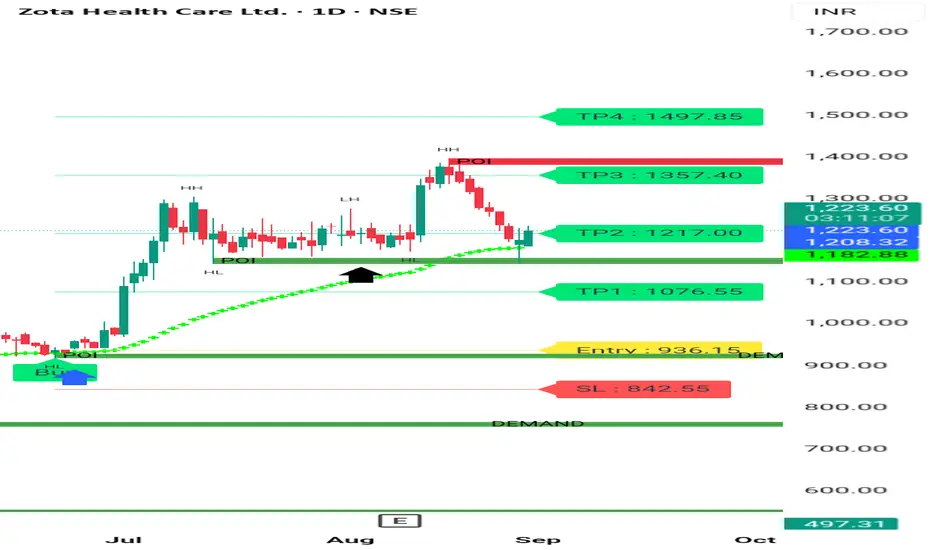
ZOTA HEALTHCARE BULLISH CHART Zota healthcare is good Growth company. It's a good buy at cmp for swing trading of 5%-6% profit. It's taking Reversal after Retracement. U can look into this. Thanks .
Consult your financial advisor before making any position in stock market.
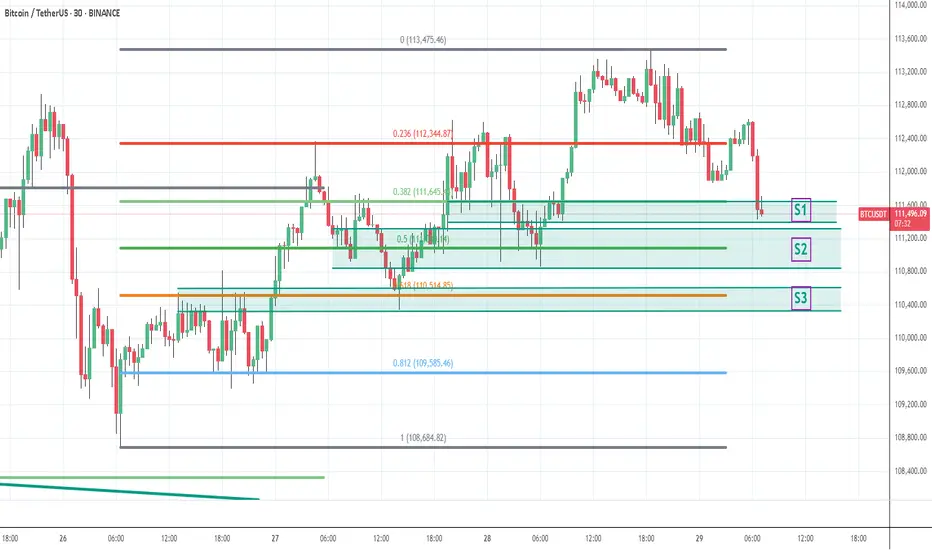
BTC - 29th Aug - collect more qty on every dipswe have monthly expiry and max pain at the top around 117K not sure exactly as it keeps changing some times. I expect any of the mentioned support levels to hold since it went up with demand followed by good data from US and positive equity... long BTC with required enough enough margins so no one can liquidate even during sleeping... weak hands loose btc to whales during dips... collect btc qty on dips... take care, cant predict the exact support levels big players thinking .... But every big players buy every dip when good volume seen for sure
BTCUSD Long Setup – Trend Continuation Play📌 Trade Details
Entry: 113,256.5
Target: 115,317.7
Stop Loss: 111,874.4
📊 Trade Rationale
✅ Trend Continuation: Price has respected the ascending trendline multiple times, indicating strong buyer interest.
✅ Break of Structure: Recent higher highs and higher lows confirm bullish momentum.
✅ Support Flip: Zone around 113,050 acted as resistance earlier and is now being retested as support.
✅ Volume Confirmation: Rising volume supports the bullish continuation bias.
✅ Clean Risk–Reward: With SL below structure and TP near major resistance, this setup offers a favorable RRR.
🎯 Target Zone
The target aligns with the next strong supply zone at 115,300+, where sellers may re-enter.
⚠️ Risk Management
Always size positions wisely, as crypto remains highly volatile. Protect your capital first.
Disclaimer:
This idea is for educational purposes only and not financial advice. Do your own research before entering any trade.

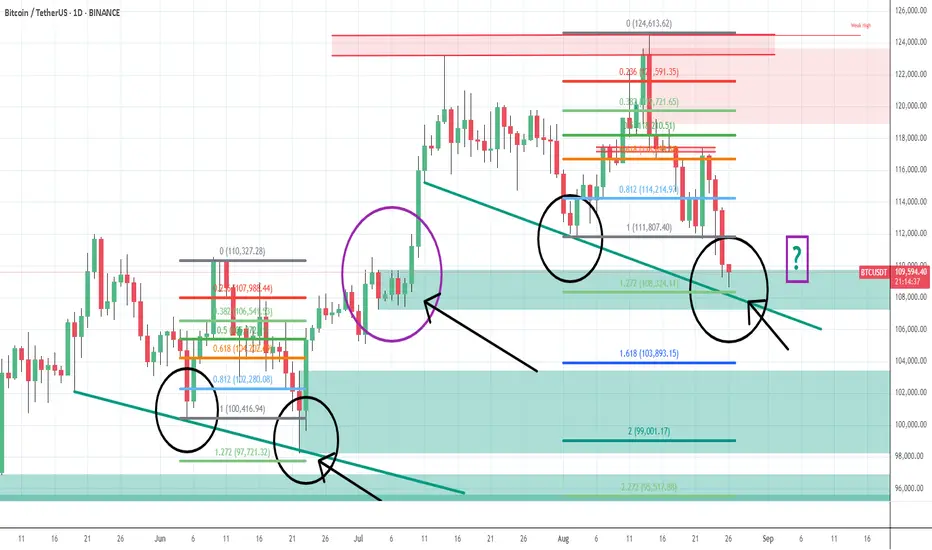
BTC - will bounce and move up only from today low - 26th AugBTC price has reached a crucial technical area from where price will most likely bounce and move up only and wont fall further much. explained in chart with fib levels and what happened in history
Buy BTC for 10K up move - Price Action confirmationLast few days multiple false news were spread in middle of correction.
Deliberate sell off by big players to trap the retailers etc etc
joined with US FOMC meetings etc only played down side which is
not technical.
I predict price tracing back to 124K asap.
Bitcoin is Digital Gold. At the same time keep long qty with liquidation level as
low as 105 or 100 or 95 K so no one can liquidate you....
Keep Booking profits and re enter at every dip.... rock it my friends
