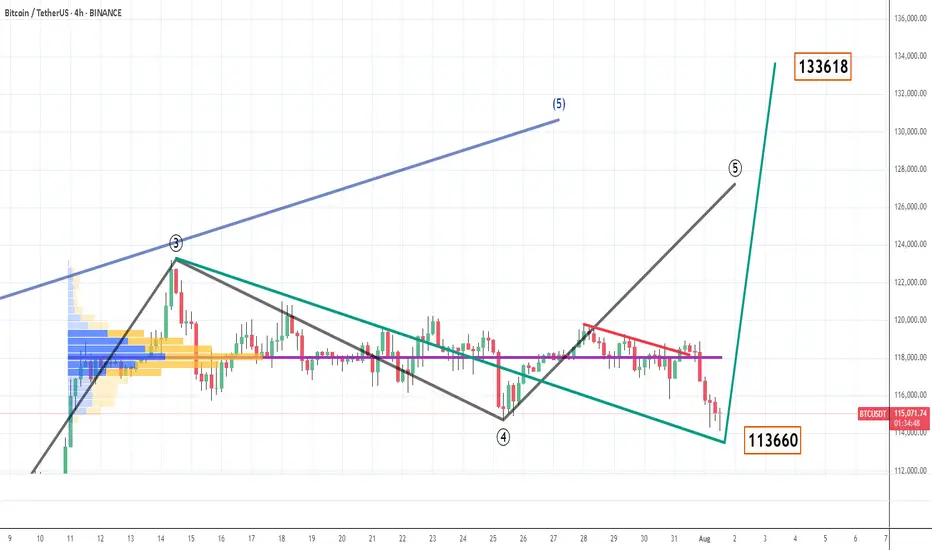
BTC - 1st Aug view - 4th wave revised and new TP - 133KBig players played a false move to shake weak hands when US data, trade deals, crypto policy etc etc favoring continuation of impulsive move. But its big players deliberate move to generate liquidations and get bigger qty of bitcoins.
Now
As per revised 4th wave shown in green line and black was earlier given wave counts.
There is no 100% accurate levels and its based on demand and supply when ever big players and algo wants to move the price either side.
In case price move above 116030 then i wish to consider 4th wave is done and we move towards 133K even if its not going to happen then also mean revision or rejection comes above 118K only and risk to reward Favours buying this dip or hold with money management.
Tariff news is not at all a impacting factor for economy as US customers going to choose the better deals and move on. every day importers and exporters compete with each other. countries compete with each other. why BTC which gets higher price due to fiat money printing get impacted now. its all big player games i think
Btcusdanalysis
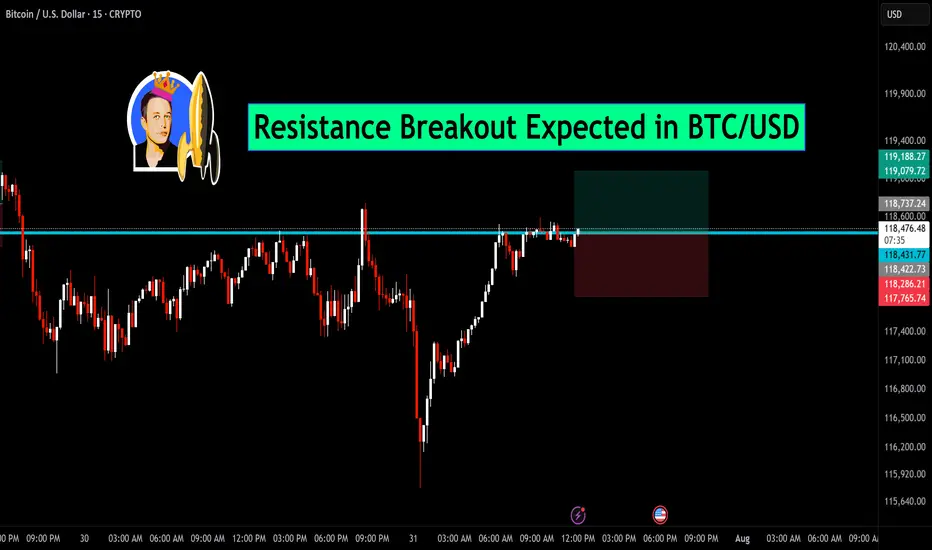
Resistance Breakout Expected in BTC/USDBitcoin is currently testing a key horizontal resistance near the $118,600 zone. After a sharp recovery from recent lows, the price is consolidating just below this level, indicating a potential breakout.
🔍 Chart Insights:
Price action forming higher lows, showing strength.
Breakout above the marked resistance may trigger a strong bullish move.
Tight consolidation near resistance suggests bulls are preparing for a push higher.
📈 Trade Setup:
Entry: Above $118,600 breakout
Target: $119,188 and beyond
Stop-loss: Below $118,200
If price sustains above resistance with volume confirmation, BTC/USD could witness fresh momentum on the upside. Stay alert for the breakout candle.
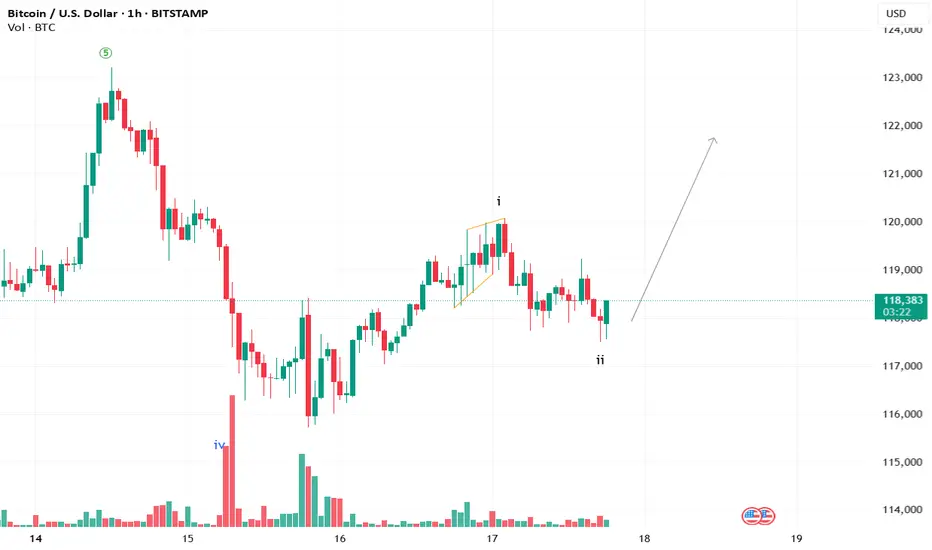
BTC ready to move up?An impressive wave 2 structure is about to be completed. We may observe the next wave 3 on the upside.
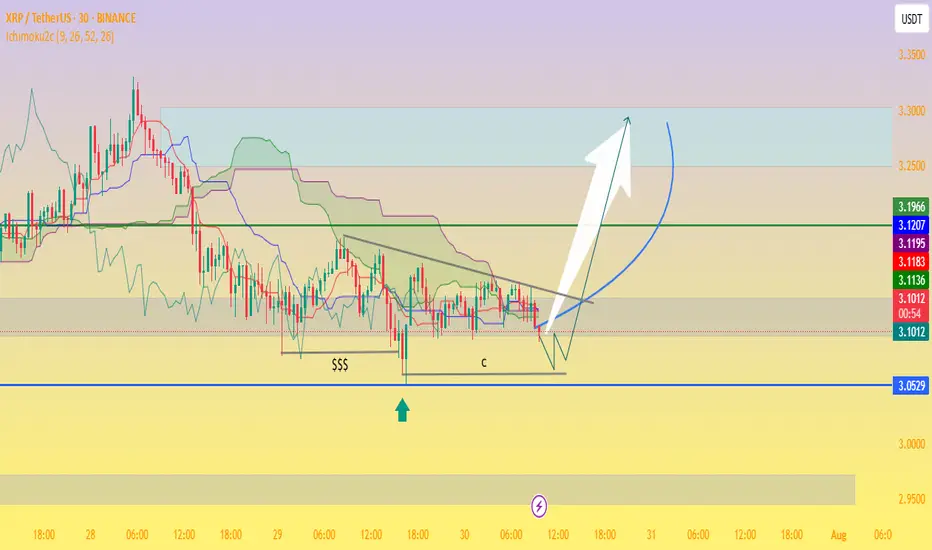
XRP/USDT Potential Reversal Zone — “Bottom Tested, Bullish!📉 Chart Analysis Summary
The divided chart indicates XRP trading between a critical support zone near $3.05–$3.09 and overhead resistance around $3.19–$3.23, forming what could be a bullish pennant or descending wedge setup on the 30-minute timeframe:
Support Zone (~$3.05–$3.09):
Price retested this level multiple times (labeled as “$$$” and “c”), clearly identifying a demand zone.
Ichimoku cloud support lies nearby, adding technical relevance to the floor.
Resistance Trendline & Green Line (~$3.19–$3.23):
A descending trendline is visible, showing lower highs and building compression.
A breakout above this resistance zone is necessary to signal bullish continuation.
Projected Path:
The schematic arrow suggests a bounce off support, followed by consolidation, and then a breakout above resistance, targeting the $3.25–$3.30+ zone and potentially higher.
🔍 Context from Recent Market Commentary
Support Holding Above $3.11–$3.15: Analysts highlight strong support around $3.11–$3.15, where institutional and retail interest appears concentrated
TradingView
+13
TradingView
+13
CoinCentral
+13
.
Resistance & Consolidation at $3.30: While XRP briefly surpassed $3.30, it encountered rejection and remains rangebound. A confirmed break beyond this level could validate the bullish carry-forward
CryptoPotato
CoinDesk
.
Wave-Elliott Bull Case: Various Elliott Wave scenarios forecast targets as high as $5.25, $6.85, or even $10–$15 should Wave 5 materialize, though this depends on market strength and momentum
CoinCentral
.
✅ Trading Outlook
Bullish Scenario:
Bounce off $3.05–$3.15 support.
Break above $3.23–$3.30 resistance.
Potential upside targets:
Near term: $3.30–$3.40.
Medium term: $4.64 or $5–$6, with strong case for $6.85 if momentum and on-chain demand strengthen
CryptoPotato
+15
TECHi
+15
CoinGape
+15
.
Bearish Scenario:
Failure to hold $3.05–$3.11 risk retest toward $2.95 or lower zones ($2.30–$2.70)
TECHi
.
🧭 What to Watch
Key Level Role
$3.05–$3.11 Critical support/demand zone
$3.19–$3.23 Short‑term resistance/framing compression
~$3.30+ Confirm bullish breakout — key trigger for Wave 5 and higher targets
🧠 Overall Take
This chart is painting a classic consolidation near strong support with a visible descending upper boundary. If XRP holds the ~$3.05 zone and breaks above $3.23–$3.30 with conviction, it could initiate a bull move toward $3.40–$4.00, and potentially even $5–$6+ depending on volume and momentum.
However, breaks below $3.11 may open deeper downside risk. For many traders, this is a simple risk-reward setup: entry near the lower channel with a stop under $3.05 and initial profit targets at $3.30–$3.40.
BTC - TP 127200 confirmed coming !!! 29th july viewEveryone are in same page with respect to wave 5 is in progress and we will be seeing new high.
Inner waves of 5th wave is clear now with support formed and ABC corrective move of 2nd wave seems to be completed price moving up. when price respect fib levels and align with wave theory then we can predict the targets. 3rd, 4th and 5th are plotted based on the first 2 move and this will happen for minimum possibilities. so with this data points I am predicting TP of 127200 for BTC very soon in short term.

BTC - TP 120600 based on Cup & Handle - 29th July 2025price seems to have completed minor second wave of the major 5th wave up move now.
and chart clearly showing cup and shoulder pattern and once price sustain above neck line and start moving price will hit and may move above 120600 level as per this pattern which mostly work.
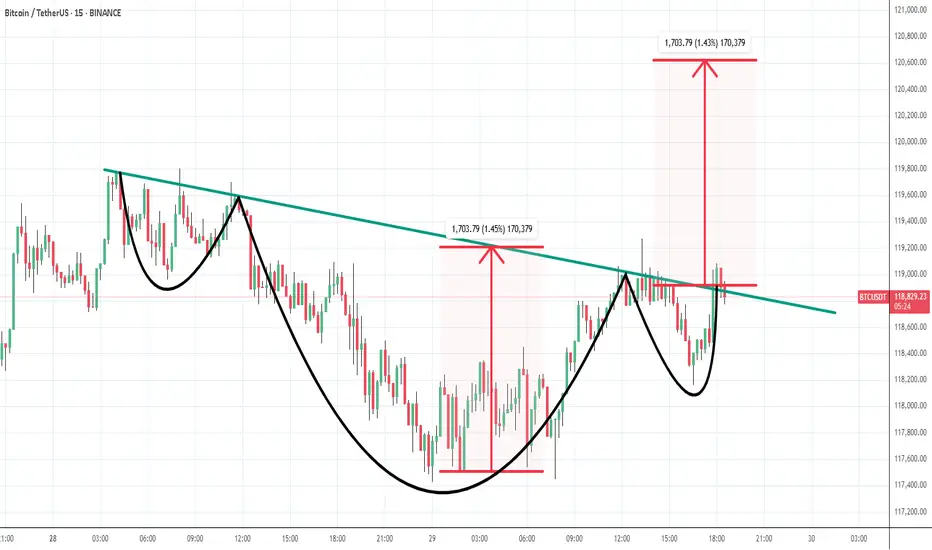
BTCUSD - Consolidation Breakout & RetestBitcoin has successfully broken out of its consolidation zone on the 15-minute chart. After a strong breakout above the horizontal resistance, we are now seeing a textbook retest of the breakout level, which may act as a fresh support.
✅ Bullish confirmation if price sustains above the breakout zone
📍 Resistance turned support at ~118,700
🎯 Upside momentum likely to continue if this retest holds

Buy BTC @ 117250 area - FIB LevelEvery one know BTC is in 5th main wave and in that it has done first wave and now second correction wave which is mostly 50% FIB level of first level coming at 117250 area where i strong suggest every one to buy long positions again in BTC

Renderwithme | Bitcoin at resistance Bitcoin Price Analysis for Next Week (July 14–20, 2025)Predicting Bitcoin's price for the
upcoming week involves analyzing current market trends, technical indicators, and macroeconomic factors. Based on recent data, here’s a concise analysis for Bitcoin (BTC) for the week of July 14–20, 2025. Note that cryptocurrency markets are highly volatile, and predictions are speculative. Always conduct your own research before making investment decisions.Current Market OverviewCurrent Price: As of July 7, 2025, Bitcoin is trading around $108,000–$109,420.41, with slight variations across sources.
Recent Performance: Bitcoin has shown a modest upward trend, with a 0.56% increase over the past week and a 4.38% gain over the last month. It reached an all-time high of $112,000 on May 22, 2025, but recently pulled back from $110,000 due to whale transfers and macroeconomic uncertainty.
Market Sentiment: Sentiment is cautiously optimistic, with the Fear & Greed Index in the Neutral zone, indicating investors are accumulating during dips. Technical indicators suggest a bullish outlook, though short-term volatility is expected.
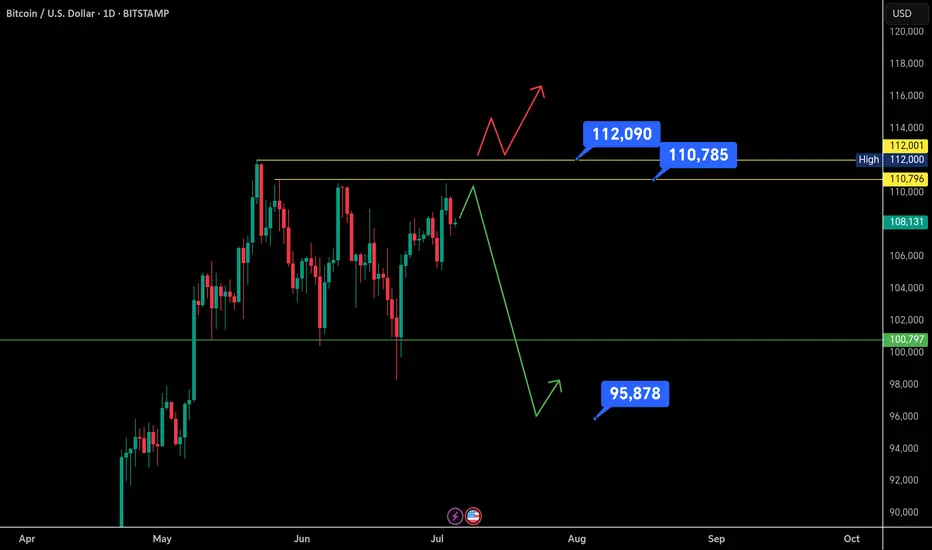
Technical AnalysisPrice Levels and Trends:Bitcoin is trading above key support levels at $106,700 and $103,709 (20-day and 50-day EMAs), with resistance at $109,800–$112,000. A weekly close above $109,000 could confirm a breakout, potentially targeting $113,500 or higher.
A descending triangle pattern is noted, with a potential breakout by early August. If bullish momentum persists, $110,000 is a key resistance to watch. Failure to hold above $99,000 could lead to a retest of $94,000–$96,000.
Disclaimer --
This analysis is based on recent technical data and market sentiment from web sources. It is for informational purposes only and not financial advice. Trading involves high risks, and past performance does not guarantee future results. Always conduct your own research or consult a SEBI-registered advisor before trading.
#Boost and comment will be highly appreciated

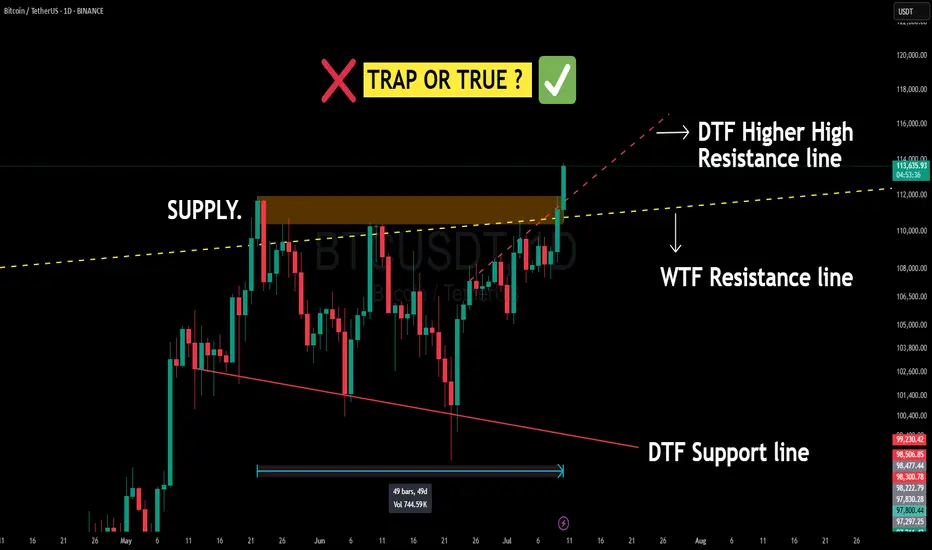
BITCOIN Just Smashed a 50-Day Supply Wall — Breakout or Fakeout Bitcoin (BTC/USDT) on the Daily & Weekly Timeframe just pulled off something BIG:
✅ Broke out of a 50-day consolidation range
✅ Closed above a strong Daily supply zone
✅ Cracked both DTF & WTF resistance lines (including a higher-high dynamic DTF resistance)
✅ Volume confirmation with a strong green candle
📌 This is an extremely bullish structure for short-term scalping ideas.
But Wait — What’s Happening Technically?
Supply Zone: This orange box is where BTC got sold off multiple times before. Breaking above this = strong bullish intent.
⚠️ Caution: Bitcoin is the King of Fakeouts 👑🐍
BTC has a notorious nature for false breakouts, trapping both bulls and bears. That’s why:
🧠 Best Strategy = Trap Trading OR
⏳ Wait for a pullback and retest of broken zones on higher timeframes . Plan your trade - trade your plan .
Don't chase — let price come to you.
💬 Drop your thoughts / doubts in comments.
📌 Not financial advice — just me and my Emotions
$BTC Potential Longing OpportunityWe’ve successfully opened our previous long position at $105,398.80.
What’s next?
I’m currently eyeing the $106,335.70 – $106,716.90 range as a potential zone for the next long entry. Price may retest this area before continuing its move to the upside.
This is not financial advice. Always trade at your own risk.

BTC/USD Bullish Reversal Breakout Pattern BTC/USD Bullish Reversal Breakout Pattern 🚀
Technical Analysis:
🔹 Trend Reversal: The chart shows a clear inverse head and shoulders pattern highlighted with orange circles — a strong bullish reversal signal after a downtrend.
🔹 Breakout Zone: The neckline resistance around 108,000 USD has turned into support (marked as “SU00QT” due to a typo, assumed to be “SUPPORT”). Price action is consolidating just above this zone.
🔹 Trendline Support: The upward blue trendline confirms bullish structure, with price forming higher lows. Recent price action is bouncing off this trendline, showing strength.
🔹 Bullish Confirmation: Green arrows indicate strong bullish rejections from key levels, aligning with breakout retests.
🔹 Target Projection: The measured move from the inverse head and shoulders pattern projects a target towards the 114,000 USD resistance zone 📦 highlighted above, suggesting a potential 5-6% upside move 📊.
Conclusion: As long as price holds above the 108,000 support zone and the ascending trendline, BTC/USD remains bullish with potential continuation towards 114,000 USD. A breakout above minor consolidation could trigger a strong bullish rally 💥.
🛑 Invalidation: A sustained break below 106,000 USD would invalidate the bullish structure and may lead to further downside.

$Btc Summer Scenarios: Breakout or Breakdown?Bitcoin is currently forming higher lows, indicating bullish intent — but strong resistance around $110.6K continues to hold.
There are 3 key scenarios developing:
1. Double Top Formation: If BTC faces rejection again near $110.5K, a double top may form, leading to a potential drop.
2. Bullish Breakout: A successful breakout above both resistance levels could push BTC toward $116K–$120K.
3. Bearish Breakdown: If rejection happens earlier without retesting, BTC might crash directly to a lower low around $95K–$96K.
RSI indicates underlying strength, but until a decisive breakout or rejection confirms, traders should remain cautious and patient.
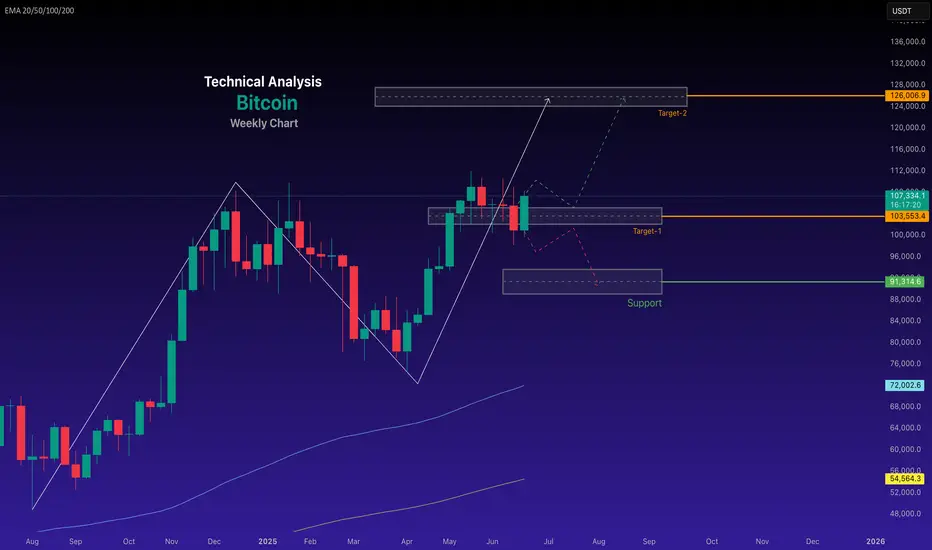
BTC - new ATH will happenIn the month of April, I clearly pointed out BTC will take support and will move upside only and all news are favorable for up move. In less than 3 months we are seeing the expected up move. From July first week I am expecting BTC to make new ATH and T1 is near 118K and T2 is around 130K and BTC could even see 145 K easily in this year 2025. All the news coming from US are only indicating higher levels for BTC. Avoid all other Alt coins and stay long in BTC for few more weeks to see the biggest profits in 2025.

Bitcoin Technical Analysis for the Week of 29, June - 07, July
Here's a Bitcoin price analysis for June 29, 2025, based on available data and technical indicators from recent sources:
#Current Market Overview
Price: Bitcoin is trading around $107,331.08 as of June 28, 2025, with a slight 24-hour decrease of approximately 1.99%.
#Market Sentiment: The market shows a neutral to bullish sentiment. The Fear & Greed Index is at 65 (Greed), indicating optimism but not extreme euphoria. Technical indicators suggest a 67% bullish sentiment, with 25 bullish signals versus 5 bearish signals.
Trading Volume: 24-hour trading volume is around $43.1 billion, slightly below recent averages, suggesting cautious trading amid volatility.
~~ Technical Analysis ~~
Price Trends:
Bitcoin is currently testing support at the 20-day EMA ($106,211), with additional support at the 50-day EMA ($103,110) and 100-day EMA ($98,807). The 200-day EMA ($93,092) serves as a key macro support level.
The 50-day moving average is rising and remains above the 200-day moving average, forming a golden cross, a bullish indicator.
Bitcoin is within a descending triangle pattern, which could resolve by July 1, 2025. A breakout above $110,000 could signal a new bull run, while failure to hold $102,000–$104,000 may lead to a drop toward $95,000–$98,000. even to $90,000.
Key Levels:
Support: $100,000 (recently held), $98,000 (psychological), $95,000 (flag pattern lower border).
Resistance: $108,700 (recent high), $110,000 (key psychological level), $112,000 (all-time high from May 2025)
Trend Bullish - Chart for your reference
-- Disclaimer --
This analysis is based on recent technical data and market sentiment from web sources. It is for informational purposes only and not financial advice. Trading involves high risks, and past performance does not guarantee future results. Always conduct your own research or consult a SEBI-registered advisor before trading.
#Boost and comment will be highly appreciated
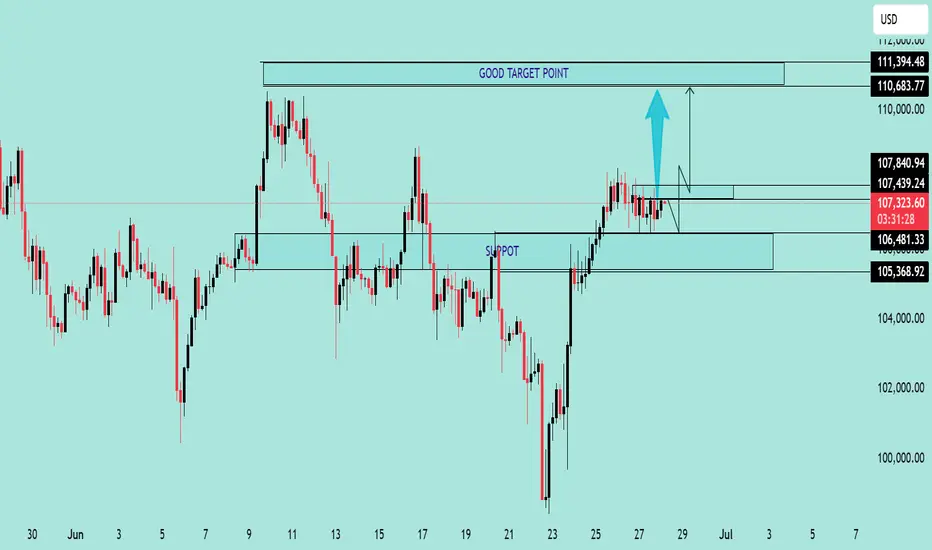
BTC/USD Consolidation Breakout SetupChart Overview:
The BTC/USD chart shows a strong bullish impulse followed by a consolidation phase just below a key resistance level, suggesting a potential bullish continuation.
🔹 Key Technical Zones:
📍 Support Zone:
105,368 – 106,481 USD
This area acted as a strong demand zone where price reversed aggressively.
📍 Resistance Level:
107,439 – 107,840 USD
Price is currently consolidating just below this resistance, indicating a buildup for a breakout.
🎯 Target Zone:
110,683 – 111,394 USD
A clean breakout above resistance could push price into this target area.
🔹 Technical Signals:
✅ Bullish Flag Formation:
After a strong impulse move, BTC is forming a sideways range, indicating bullish accumulation.
⬆️ Breakout Potential:
A confirmed breakout and retest above 107,840 could validate a move toward the 111K region.
⚠️ Invalidation Point:
A drop below 106,481 would invalidate the bullish bias and may trigger a deeper pullback.
📌 Conclusion:
As long as BTC holds above the 106,481 support and breaks above the 107,840 resistance, bullish momentum is expected to continue toward the 111K zone. Traders should watch for a breakout confirmation and manage risk accordingly. 💹
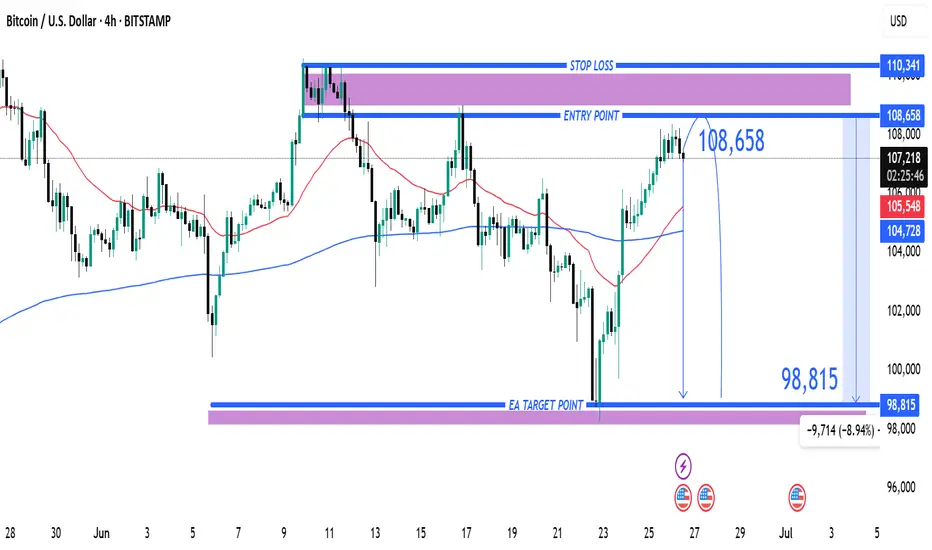
Entry at $108,658 with Target at $98,815 and Stop Loss at $110,31. Entry Point: 108,658
This is where the trader expects to enter a short position.
Price is projected to reverse near this level.
2. Stop Loss: 110,341
Located above the entry point.
If price hits this level, the short trade is invalidated, limiting losses.
3. Target (Take Profit): 98,815
This is the EA Target Point, about 9,714 points (~8.94%) below the entry.
Represents a favorable risk-reward ratio.
---
🔄 Trade Idea Summary
Trade Type: Short (Sell)
Risk: ~1,683 points (110,341 - 108,658)
Reward: ~9,843 points (108,658 - 98,815)
Risk-Reward Ratio: ~1:5.85 (which is strong)
---
📊 Technical Indicators in Use
Moving Averages:
Likely 50-period (red) and 200-period (blue) MAs.
The 50 MA is below the price, indicating short-term bullishness.
However, the trade idea goes against this short-term trend, suggesting a reversal strategy.
---
🔍 Interpretation & Strategy
This chart implies the trader expects resistance near 108,658, possibly due to historical highs or supply zones.
The bearish outlook expects a significant drop to 98,815, possibly supported by macro patterns (like head & shoulders, or bearish divergence—not shown here but could be inferred).
The purple zones highlight high-probability reversal or reaction areas (support/resistance zones).
---
⚠️ Things to Watch
Invalidation: If price closes above 110,341 on a 4H/1D chart, the trade setup fails.
Confirmation: A strong bearish candlestick at or near the entry zone would strengthen the case.
Market Context: News, economic data, or BTC ETF inflows/outflows can quickly invalidate technical setups.
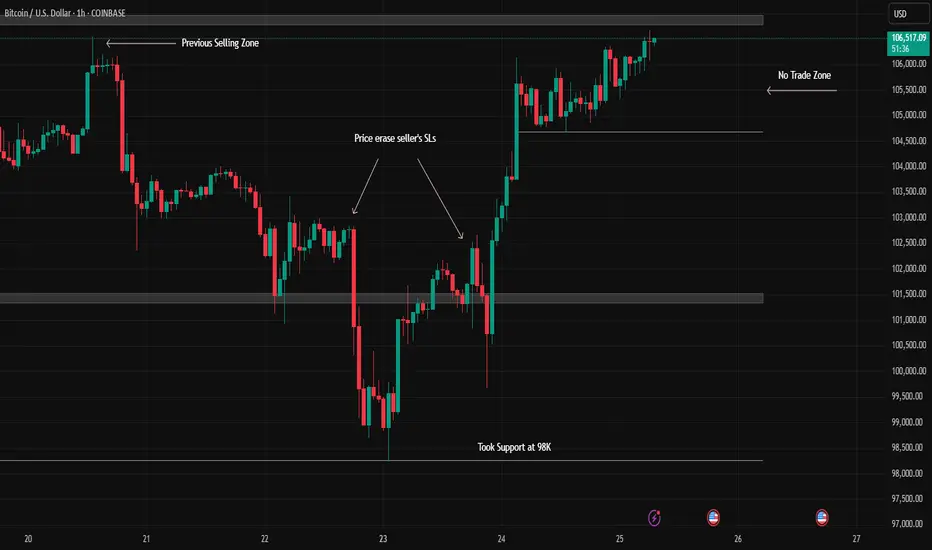
Bitcoin - Interesting Price Action in 1 HTFTRADERS AND INVESTORS,
The Bitcoin chart presents an interesting setup on the 1-hour timeframe (1 HTF). Here's a breakdown of recent price action:
Initial Resistance & Downtrend : Bitcoin's chart indicated potential trend changes, with significant selling pressure at the $106,000 mark establishing a clear resistance level.
Downtrend Confirmation & Support : This was followed by a series of lower highs, confirming a downtrend. Subsequently, Bitcoin found support and bounced from the $98,000 level.
Potential Reversal Signal : The recent upward movement cleared sellers' stop-losses, which could be an early indication of a potential trend reversal.
WHAT MIGHT HAPPEN NEXT?
Currently, Bitcoin is re-testing the crucial $106,000 resistance level.
Bullish Scenario : A confirmed breakout and sustained move above $106,000 could signal the continuation of an uptrend.
Bearish Scenario : Conversely, a strong rejection from this level might lead to a decline, potentially targeting the $101,000 support.
Current Stance : At present, this area appears to be a no-trade zone due to the indecisive price action.
Disclaimer : This analysis is for educational purposes only and should not be considered financial advice. Always conduct your own research before making investment decisions.
Bitcoin Bounce Alert: Holding the $100K Fortress! 📉 Market Context & Technical Levels
Key support at ~$100K: As the chart shows and multiple analysts confirm, this level continues to act as a strong defence zone. Cointelegraph noted bulls have been “defending the $100K key support level strongly,” triggering bounces during dips
Descending channel overhead: Bitcoin has retraced into a downward channel. A clean breakout above ~107K–109K (past recent peaks) is needed to signal a bullish shift .
Liquidity target at ~106K: Plenty of orders await in that region—flipping it to support may pave the way for another push higher .
📊 Indicators & Momentum
RSI dip near 25 during the latest drop indicates oversold conditions—often a precursor to rebounds
.
Volume surge on rebounds suggests absorbing sell pressure and strong accumulation interest at lower levels.
🚩 Key Price Zones to Watch
Level Significance
$100K Crucial support; losing it risks a slide toward $95K–97K or even $92K
.
$105K–106K Liquidity zone; flipping here as support could confirm upward momentum .
$107K–109K Resistance from channel tops and prior highs; a successful break is key to next leg up .
$112K–$112K+ If breakout occurs, upside targets extend toward prior ATH near $112K and beyond .
🎯 Chart Analysis Summary
Your chart shows three distinct bounces from the $100K–100.7K supply zone (highlighted in blue) and the latest one includes a sharp wick and rebound. This aligns with broader market dynamics emphasizing support at $100K and building liquidity at $106K. The arrow projection signals a probable retest of ~106K, with room to challenge ~107–109K after consolidation.
🧭 Trade Outlook
Bullish scenario: Hold above $100K → reclaim $106K → trendline breakout → potential rally to $112K+.
Bearish risk: Fails support at $100K → breakdown toward $95K–92K region.
📌 Bottom Line
Support $100K is alive and well. Bounces have been crisp and volume-backed.
Next test lies at $105–106K. That’s the battleground—flip it, and we may see bitcoin reclaim recent highs.
Watch the channel overhead (~107K–109K). A breakout could open the door to fresh records.
✅ Conclusion: BTC is defending its psychological base firmly. If this zone holds once more, the path to $106K and beyond is in focus. Breaking above demands conviction, but it’s the pivot to watch.

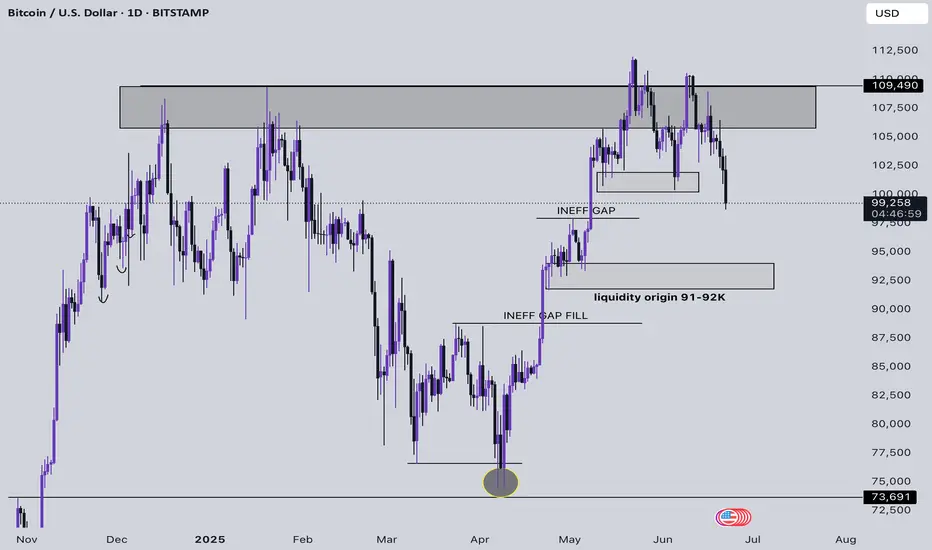
Bitcoin 1D Technical Analysis Bearish Bias- Bitcoin is currently trading at 99,453$, down almost 11% from its ATH
- Bitcoin trapped many buyers above 110,000$, and now they have become aggressive trapped sellers
- We have origin fill left and a large inefficient gap left for Bitcoin to fill at 88,765$ to flip bullish I will sit and wait for BTC to start a consolidation there, and then I will look for aggressive spot buys
- Avoid leverage at all cost, it makes no sense to lose money until the price behaviour of BTC settles We can see BTC repurging 73,000, it's in the playbook as well
- Market Structure shift in BTC is highly bearish unless we see a structure shift on a 4h or 1d TF
- Manage your risk and try to avoid leverage at all cost
BTC/USDT 4H Analysis – Bullish Cup Formation 📈 BTC/USDT 4H Analysis – Bullish Cup Formation ☕🚀
🔍 Chart Overview:
The 4-hour chart of Bitcoin against USDT on Binance displays a clear "Cup" pattern, suggesting a strong bullish continuation setup. The price action reflects a rounded bottom forming after hitting a solid support zone.
🟣 Key Zones:
🔻 Support Zone: ~$101,000–$103,000
Strong buying interest was observed here with a sharp wick rejection, forming the bottom of the cup.
🔺 Resistance Zone: ~$110,000–$112,000
This area has acted as a historical rejection zone and now stands as the next major target for bulls.
📊 Technical Insights:
The price is gradually curving upward, respecting the rounded cup pattern, often a precursor to a breakout.
A clean break above the resistance zone may trigger continuation toward new highs, possibly above $112,000.
The price is currently at ~$107,700 and gaining momentum with higher lows forming consistently.
🎯 Price Projection:
📌 Target: $111,500–$112,000
📉 Invalidation: Break below the $103,000 support
💡 Conclusion:
If the bullish momentum continues and breaks past resistance, we can expect a powerful upside breakout. Traders should watch for volume confirmation near the resistance zone for potential entry or breakout trades.
📍Pattern in Play: Cup Formation
⚠️Watch for pullbacks before breakout attempts.

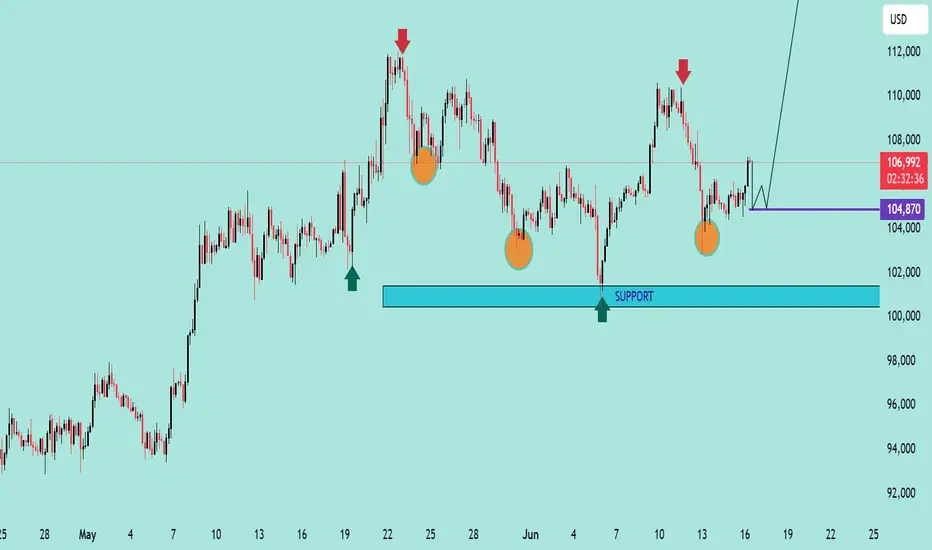
BTC/USD Potential Reversal & Bullish Breakout SetupBTC/USD Potential Reversal & Bullish Breakout Setup 🔄🚀
Technical Analysis Overview:
🔹 Pattern Formation:
The chart displays a potential Triple Bottom pattern (🟠), a classic reversal signal forming at the $104,870–$100,000 support zone 🛡️. This structure suggests a strong base is being established for a potential upside move.
🔹 Support Zone:
📉 The price has consistently bounced off the major support area around $100,000–$104,870, indicating strong buying interest.
🔹 Resistance Zone:
📊 The key resistance level lies around the $114,000–$115,000 range 🔵, which has been tested multiple times in the past (🔴 arrows) and could act as a future profit target.
🔹 Price Action & Projection:
Currently, price is trading near $107,025 and is showing signs of bullish continuation after forming a higher low. If the price consolidates above the $104,870 zone and holds support, we could see a potential breakout targeting the $114,000 resistance 📈.
📌 Key Takeaways:
✅ Triple Bottom formation signals trend reversal.
🔄 Bullish structure confirmed above $104,870.
🎯 Next target: $114,000 if breakout holds.
⚠️ Watch for potential consolidation before continuation.
Bitcoin Bounce & Breakout PlayChart Analysis:
🔹 Support Holding Strong:
BTC is respecting a key support area (~$105,600), which previously acted as resistance (marked by recent ATH).
🔹 EMA 70 (Blue Line):
Price is hovering above the EMA, adding bullish confirmation.
🔹 Bullish Projection Path:
The chart shows a projected bullish move toward the sell zone near $113,200 – $113,300, representing a potential 4.4% gain from the breakout.
🔹 Key Zones:
Support Zone: $105,600
Supply Zone: $100,500
Sell Zone (TP Zone): $113,200+
📌 Outlook:
If BTC breaks and holds above the resistance (~$107,000), a strong upward rally could follow.
Entry near support or on breakout, with tight risk management, offers a favorable risk/reward.
✅ Entry Options:
Breakout Entry:
Trigger: Break and close above $107,200
Confirmation: Retest and hold above the breakout zone
Entry: $107,300 – $107,500
Support Bounce Entry:
Trigger: Pullback to support zone (~$105,600) with bullish reversal candle
Entry: $105,600 – $105,800
🎯 Target Zones (TP):
TP1: $110,400 (minor resistance)
TP2: $113,200 – $113,300 (major sell zone)
TP3 (aggressive): $114,000+
🔻 Stop Loss (SL):
For breakout entry: SL below $106,200
For bounce entry: SL below $105,200 or $104,800 (structure break)
📈 Risk–Reward Ratio:
Approx. 1:2.5 to 1:3+ depending on entry and target
🧠 Trade Management:
Move SL to breakeven after hitting TP1
Partial profit booking at TP1
Trail remaining with manual or dynamic SL (e.g., below EMA or recent low)
⚠️ Risk Notes:
Avoid chasing price without breakout confirmation
Watch for fakeouts and heavy selling near TP zones
Adjust position size based on your risk tolerance
