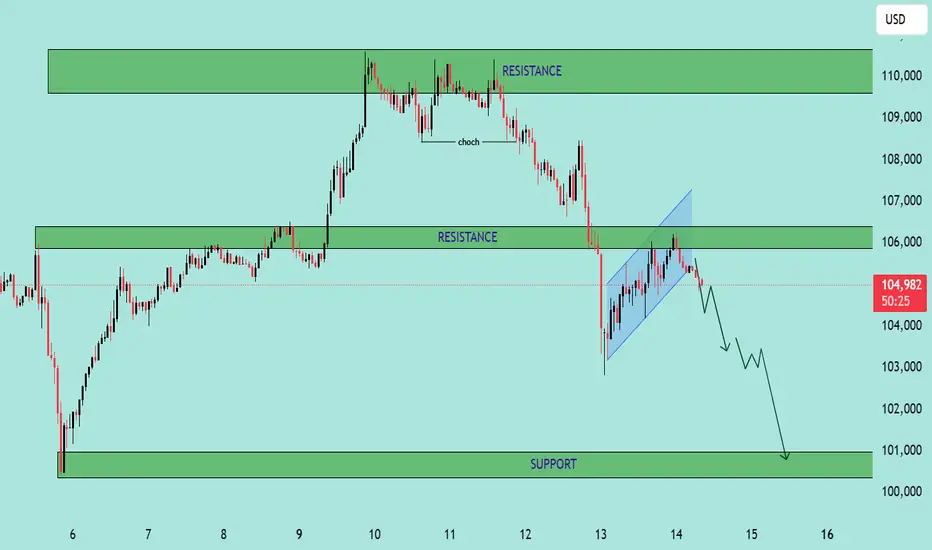
BTC/USD – Bearish Continuation from Rising Channel BTC/USD – Bearish Continuation from Rising Channel 🚨🧱
This chart indicates a bearish market structure with the following key technical features:
🔍 Chart Analysis:
Change of Character (CHoCH) 🔄
A shift from bullish to bearish was confirmed by a strong breakdown after the CHoCH marked at the top.
This breakdown invalidated previous bullish structure.
Bearish Flag Formation 📉📐
After the impulsive drop, price formed a bearish flag (rising channel), suggesting a potential continuation move to the downside.
Resistance Rejection 🚫
Price is currently testing and rejecting the 105,800–106,500 resistance zone, previously a support turned resistance.
The rejection from this level adds further bearish confluence.
Downside Projection ⬇️📍
If the pattern plays out, the projected move shows a potential drop toward the major support zone at 100,000–101,000.
📌 Key Levels:
Resistance Zones:
105,800–106,500 🧱
109,500–111,000 🧱
Support Zone:
100,000–101,000 💚
🧠 Conclusion:
The chart suggests that BTC/USD is in a bearish continuation phase, with strong rejection from key resistance and a confirmed breakdown from a bearish flag. Traders should watch for confirmation of continuation below 104,500 to target the 100k support level. Risk management is crucial near volatile zones.
Btcusdanalysis
BTC/USD 4H Trade Setup – Demand Zone Reversal Play🔵 1. Demand Zone 🧲💎
📍 Range: 100,418.83 – 102,253.51
🟦 Strong support zone
💡 This is where buyers are expected to step in
📉 Price is currently testing this zone — potential reversal area
🚀 2. Entry Point 🎯
📍 Zone: 102,232.52 – 102,264.33
✅ Just above demand zone for safe entry
🧘♂️ Wait for bullish confirmation (wick rejections, engulfing candles)
🛑 3. Stop Loss 🔻
📍 Zone: 100,498.77 – 100,538.74
🔒 Below demand zone — protects you from false breakouts
⛔ Invalidates setup if price breaks below this level
🎯 4. Target Point 💰
📍 Target: 108,800.00
🧱 Major resistance zone
📈 Offers a solid Risk/Reward setup (approx. 1:4)
🪜 Possible take-profit scaling around 108,656.78 – 109,256.50
🔁 5. CHoCH – Change of Character 🔄
📍 Confirmed structural break above a lower high
🕵️♂️ Indicates shift from bearish to bullish
🔁 Needs confirmation with higher low near demand zone
📏 6. EMA 70 (Exponential Moving Average) 📉
📍 Level: 106,849.30
🔴 Price is currently below EMA = short-term bearish
🧗♂️ Reclaiming the EMA will strengthen the bullish bias
✅ Quick Summary with Emojis
📌 Plan:
🔵 Buy near: 102,250
🛑 Stop Loss: 100,500
🎯 Take Profit: 108,800
📊 Trend:
🔻 Bearish short-term (below EMA)
🔁 Potential reversal from demand zone
⚠️ Watch For:
🔍 Bullish confirmation at demand zone
🔄 Reclaim of EMA (106.8k)
🧱 Resistance near 108.8k

Inverse Head and Shoulders Breakout Signals Bullish The chart under review presents a classic Inverse Head and Shoulders pattern, a reliable and widely recognized bullish reversal formation in technical analysis. This structure typically forms after a downtrend, indicating a potential shift in market sentiment from bearish to bullish.
The pattern is composed of:
Left Shoulder: A modest price decline followed by a temporary upward correction.
Head: A deeper price decline forming the lowest point in the pattern.
Right Shoulder: A higher low that mirrors the left shoulder, followed by another upward movement.
The neckline, which acts as a critical resistance level, is clearly illustrated at approximately 106,840.37 USDT. A confirmed breakout above this neckline suggests the completion of the reversal pattern and validates the potential for a sustained bullish movement.
---
2. Breakout Confirmation
The current price action confirms a successful breakout above the neckline, with the market currently trading around 107,586.58 USDT. This breakout is a key signal for bullish continuation, provided it is supported by increased volume and follow-through price action.
From a technical standpoint, the breakout is reinforced by:
A clean violation of neckline resistance
Price consolidation near breakout zone before a strong upward thrust
Higher lows preceding the breakout, indicative of growing buying pressure
This confluence of technical signals strengthens the case for an upward price trajectory in the near term.
3. Projected Price Targets
Upon confirmation of the Inverse Head and Shoulders breakout, target levels can be derived using the measured move technique. This involves projecting the vertical distance from the head to the neckline upward from the breakout point.
Target 1 (Initial Resistance):
108,878.29 USDT – This level represents a potential short-term resistance where price may consolidate or retrace slightly before continuing.
Target 2 (Measured Move Completion):
110,752.24 USDT – This is the ultimate price target derived from the height of the head-to-neckline structure. Reaching this level would represent the full realization of the reversal patt
4. Key Support and Risk Levels
Risk management is a critical component of any trading strategy. The following support levels should be closely monitored:
106,840.37 USDT (Neckline Support):
Former resistance turned support. Holding above this level post-breakout is essential for sustaining bullish momentum.
105,997.09 USDT:
Acts as a secondary support level and potential stop-loss region for conservative traders.
If price fails to hold above the neckline and falls back below these levels, the breakout could be classified as a false breakout, warranting caution.
5. Strategic Implications for Traders
This setup provides a favorable risk-to-reward ratio for long entries, particularly for traders seeking to capitalize on momentum-based patterns. An optimal trading approach could involve:
Entry: Near the neckline breakout or on a minor retest of 106,840.37 USDT
Stop-Loss: Below 105,997.09 USDT or under the right shoulder to account for volatility
Take-Profit Zones: Partial profits near 108,878.29 USDT, with final target at 110,752.24 USDT
6. Final Remarks
This chart illustrates a textbook example of a bullish reversal pattern in play. While the technical outlook is favorable, traders should remain cautious of potential invalidation scenarios, especially in highly volatile or news-driven markets. Confirmation through volume analysis and supportive macro/fundamental conditions can further enhance confidence in the bullish thesis.
Overall, the current setup indicates a well-structured opportunity for upward price movement, with a clearly defined entry, risk, and reward framework.
Let me know if you'd like this tailored for a trading journal, client report, or automated strategy setup.

Bitcoin (BTC) Technical Analysis for the Week of Jue 10 -June 16~~ Technical Analysis ~~
- Trend: Bitcoin is in a bullish trend on higher time frames (3-day and above), forming higher highs and higher lows. However, short-term signals are mixed, with some indicators suggesting consolidation or a potential pullback.
4-Hour Chart: Bullish, with the 50-day moving average (MA) sloping up, but the 200-day MA is sloping down since December 27, 2024, indicating a weaker short-term trend.
Daily Chart: Bullish, with the 50-day MA rising and below the current price, potentially acting as support. The 200-day MA has been rising since June 5, 2025, signalling a strong long-term trend.
Weekly Chart: Bullish, with the 50-day MA below the price and the 200-day MA sloping up since July 9, 2024.
Monthly Chart : Bullish which has a potential to hit All Time High
# Support, resistance and Targets marked in the chart for your reference
-- Disclaimer --
This analysis is based on recent technical data and market sentiment from web sources. It is for informational purposes only and not financial advice. Trading involves high risks, and past performance does not guarantee future results. Always conduct your own research or consult a SEBI-registered advisor before trading.
#Boost and comment will be highly appreciated

Bitcoin (BTC/USDT) 2-hour chart, focused on the buy side only!📊 Chart Overview
The chart shows BTC/USDT on the 2-hour timeframe, featuring clear levels of resistance, mini-resistance, and target zones. Let’s break down the buy idea:
🚀 Key Zones & Levels
💜 Resistance Zone (Purple Box):
Historical price ceiling.
Price dropped from this area several times.
🟦 Target Zone (Blue Line):
106,691 - 106,683 USDT.
Target for the next bullish move!
🟧 Mini Resistance (Yellow Box):
Around 102,000 USDT.
Acting as support (buy zone!) now.
💰 Buy Setup & Entry Area
✅ Buy Zone:
Just below 103,000 USDT, aligning with the mini resistance / support box (yellow).
✅ Entry Level:
Between 102,000 - 103,000 USDT.
Best if price consolidates or forms a reversal candle here.
🟢 Target:
First target: 106,000 USDT
Next major target: 106,683 - 106,691 USDT.
📉 Stop Loss:
Below 101,000 USDT for protection.
🎯 Trading Plan
1️⃣ Wait for a bullish reversal candlestick at the mini resistance box (~102,000 - 103,000 USDT).
2️⃣ Enter long (buy) position.
3️⃣ Target profit at 106,000 and 106,691 USDT.
4️⃣ Stop below 101,000 to manage risk.
⚡️ Summary
🟢 Buy: At mini resistance (~102,000 - 103,000).
🎯 Targets: 106,000 - 106,691.
❌ Stop: 101,000.
🚀 Let's ride the bullish wave! 💹📈🟢

Bitcoin (BTC) Technical Analysis for the Week of Jue 02 -June 09Technical Analysis
Price Action: Bitcoin is consolidating around $105,000–$108,000 after a sharp rally from April lows (~$74,000) and a peak near $112,000. A recent 3% correction was driven by profit-taking, with BTC stabilising near $106,000.
Trend: Medium-term trend remains bullish, but momentum is slowing. BTC has broken the previous resistance , indicating a potential slower rise or horizontal movement.
Note : Indicator MACD making bearish diversions in my view its not strong .
Key Levels:
Support: ~$102,600–$103,500 (recently tested)
Resistance: ~$106,000 (current resistance) and $110,500–$123,000 (next major target).
-- Disclaimer --
This analysis is based on recent technical data and market sentiment from web sources. It is for informational purposes only and not financial advice. Trading involves high risks, and past performance does not guarantee future results. Always conduct your own research or consult a SEBI-registered advisor before trading.
#Boost and comment will be highly appreciated

BTCUSDT Trade Analysis📊 BTCUSDT Trade Analysis
Previous Move (Sell)
✅ Sell executed successfully – target reached (🎯).
📈 New Trade Setup (Buy)
💡 Current Plan:
Switching to buy now as the market has reached the previous sell target.
New Target:
Next major resistance area near 111,025 – 111,072 USDT range (🟩 target box at the top).
📍 Key Levels:
Entry Zone: Above 105,000 USDT mini-resistance area (🟧 mini-resistance box).
Support: Around 102,999 USDT (blue support line).
Current Target (Buy):
Target zone: 111,025 – 111,072 USDT.
📌 Trade Plan Summary
Entry: Above 105,000 mini-resistance area break.
Target Point: 111,025 – 111,072 USDT 🟩.
Stop Loss: Suggested below 102,999 USDT to limit downside (🔴 red zone).
🎯 Conclusion:
🔵 Target for the buy move is well-defined and positioned above current resistance levels.
🟢 Awaiting price action above mini-resistance area for a safe entry for the next bullish leg!

Bitcoin 1D Technical Commentary & Bias Path - Bitcoin is currently trading at 104,521$
- The previous weekly close for BTC wasn't bullish and the following print or the current candle print does not indicate any bullishness based on the current price behaviour
- The drawings indicate that Bitcoin printed a new ATH, trapped many retail longs, and deviated right below the ATH by publishing a strong bearish print
- The following print after the ATH liquidated many late longs and also showed high sellers interest getting aggressive, now we have 2 possible playouts for BTC
- 1st path shows we can fall and fill the inefficient gap at 97,000$ flip a market structure shift to bullish and then pierce fresh highs
- The 2nd path shows we can simply purge the 1st inefficient gap and pierce through the second one which will eventually cascade a lot of liquidation and then we can finally move higher by bringing in extreme Fear

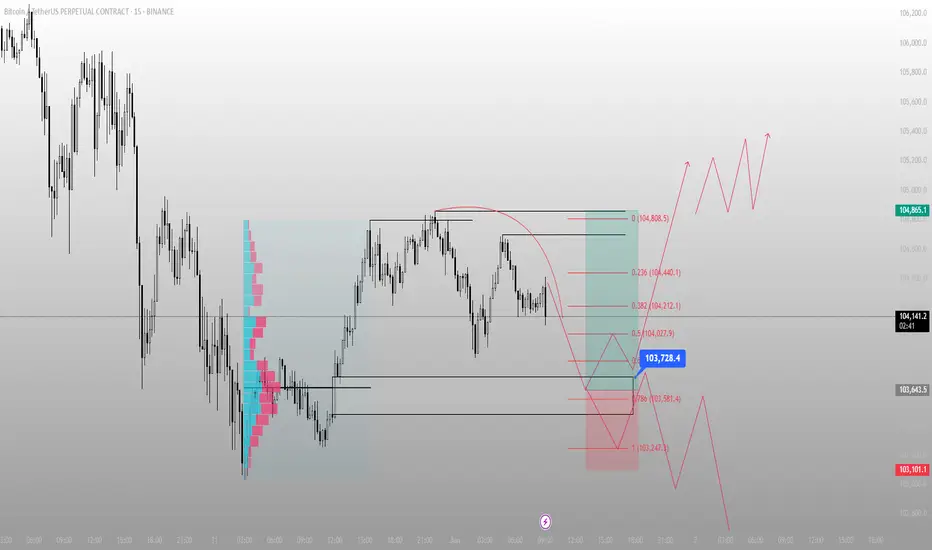
Price is coiling. But I already know where it wants to go.15-minute chart, but the logic is macro.
We just printed a double top above 104,800 — but Smart Money didn’t take that high for fun. That was a clean liquidity raid followed by immediate rejection. The reaction wasn’t retail panic. It was engineered.
What followed was a controlled pullback into a micro-dealing range. I’m expecting one more sweep — a stab into the 103,728.4 zone. Why?
Because that’s where the 0.5 retracement meets the upper bound of a low-volume node. If price wants to rebalance, it’ll do it there — not randomly in mid-air.
If price respects that level and prints bullish structure, I’ll step in. First objective? 104,865. That’s the true inefficiency gap above the raid high — and the last unfilled void in this leg.
Execution logic:
🔑 Anticipated long trigger: 103,728.4
🧠 Deep discount final bid: 103,581–103,247 sweep (last grab)
🎯 Immediate TP: 104,865
❌ Invalidation: Full body break below 103,101
I don’t need candles to line up perfectly.
I just need price to return to value.
I trade what price must do — not what it might do.
BTC/USD Technical OutlookTechnical Analysis Summary:
1. Support & Resistance Zones:
Support Zone: ~$102,600–$103,500
✅ Price recently tested and bounced from this zone, supported by the 200 EMA (blue line).
Resistance Zone: ~$110,500–$112,000
🔼 This is the next major target area for bulls.
Mid-level Supply: ~$106,500–$107,500
⚠️ Price may face short-term resistance here (near the 50 EMA in red).
🔄 Moving Averages:
200 EMA (blue) at $102,648: Acts as strong dynamic support. Price bounce reinforces bullish sentiment.
50 EMA (red) at $106,798: Currently acting as dynamic resistance. A breakout above it would strengthen bullish continuation.
🕯️ Candlestick Behavior:
Multiple rejection wicks from the support zone indicate buyer strength.
Recent candle shows a bullish reaction, potentially forming a reversal pattern.
📈 Price Projection (as per the chart path):
Short-term pullback may lead into the $106,500–$107,500 zone.
If bulls maintain momentum and break above, we can expect a push toward $111K–$112K resistance.
✅ Conclusion:
Bias: Bullish
Trigger: Confirmed bounce from support + price reclaiming 50 EMA
Invalidation: Break below $102,600 with high volume would invalidate the bullish scenario.

Bitcoin Price Analysis – 1H Chart (BINANCE)📊 Bitcoin Price Analysis – 1H Chart (BINANCE)
Date: May 28, 2025
Pair: BTC/USDT
Timeframe: 1 Hour (1H)
🏔 All-Time High (ATH) Rejection
🔴 Zone: ~111,800 – 112,000 USDT
BTC previously reached an ATH (marked in red) but failed to maintain momentum.
This level formed a double top pattern, a classic reversal signal.
📉 Key Resistance Zone
🟪 Range: ~109,500 – 110,500 USDT
Multiple rejections from this purple box indicate strong seller presence.
This area is now acting as a resistance barrier, preventing upward movement.
🔵 Support & Target Level
📍 Support Level: 106,622.06 USDT
🗨️ “when touch this level next target 100k”
The blue line represents a crucial short-term support.
The chart suggests a bearish move toward this level before a possible bullish reversal.
If price breaks below this, we could see further downside before any major rally.
🔄 Market Structure
🔹 BTC has formed a lower high structure, indicating weakening bullish momentum.
🔻 A head-and-shoulders pattern appears to be forming, which typically signals a reversal from bullish to bearish.
🧠 Trader Insight
📌 A drop to 106,622 USDT may act as a liquidity grab, potentially setting the stage for a major move upward.
⚠️ However, confirmation of a reversal (bullish signals, volume spike) will be critical before assuming a breakout to 100k as implied.
🔍 Conclusion
🚨 BTC is in a critical zone between resistance (~110,000) and support (~106,600).
📉 Near-term bias: Bearish → Targeting 106,622 USDT
📈 Medium-term possibility: Bullish rally only if support holds and sentiment shifts.

BTCUSDT Price Analysis – Potential Drop Incoming! 🔲 Chart Zones
🟥 Resistance Zone (~111,000–112,000):
Price has touched this zone multiple times and failed to break higher – this is a strong resistance area. 🚫📈
🟪 Support Zone (~101,000–102,000):
A historically strong demand area where price previously bounced up. 💪📉
🔍 Current Price Behavior
📊 Price Level: Around 108,666.66
🔄 The chart shows lower highs forming, indicating weakening bullish momentum.
📉 Bearish projection drawn (blue zigzag line) suggests a potential double top forming below resistance.
📉 What’s Expected?
🔵 Big Drop Alert! ⬇️
If the price fails to break above and gets rejected again, the chart predicts a sharp move down toward the support zone.
🎯 Target Area: ~101,000–102,000 (Support zone)
📌 Summary
🧱 Resistance holding strong
💤 Momentum slowing down
⚠️ Bearish move likely
🏹 Targeting support zone for potential bounce
⚠️ Trading Tip 🧠
Watch for confirmation before entering trades! A break below the recent lows could trigger a short opportunity, while a bounce near support could offer a buy setup. 🛑📈

ETH Consolidation ETH in a massive consolidation zone rigjt now.
We never broke wick high we got close and rejected. If btc pushes past ath and eth moves again this would be the third test and a massive squeeze.
Not trading this range right now until confirmations but keep an eye on that wick for now

Reliance industries Ltd bullish up +4%....According to weekly analysis it will reach 1500 area within this week.
At the same time nifty is also in bullish view.
I am going to position myself in reliance bullish trend.
1490 to 1500 is going to a major resistance area .

BTC/USD Rebound in Play! | Key Support Holding, Eyes on $112K 📊 BTC/USD Technical Analysis
🗓️ Chart Date: May 25, 2025
🔍 Key Levels:
🔵 Support Zone: $106,800 – $107,300
Notably, price bounced twice in this region, indicating strong buying interest.
This area aligns closely with the 200 EMA (currently at $107,213.51), adding further confluence as dynamic support.
🔴 Resistance Zone: $111,800 – $112,300
Previous highs and consolidation make this a significant area where sellers may re-enter the market.
📈 Indicators:
🔵 EMA 200 (Blue): $107,213.51
Acts as a strong dynamic support; price bounced off it recently.
🔴 EMA 50 (Red): $108,182.91
Price is currently below the 50 EMA, suggesting short-term bearish pressure remains until this level is reclaimed.
🧠 Market Structure & Price Action:
After a sharp drop from the resistance zone, price found solid footing at the support zone.
Recent candles show rejection wicks from the downside, hinting at potential bullish reversal.
A breakout above minor consolidation and 50 EMA could trigger a bullish continuation toward the resistance.
📌 Forecast:
✅ If the price holds above the support zone and breaks above $108,200, we can expect a bullish move toward $112,000.
⚠️ However, a failure to break above the 50 EMA could lead to a retest of the support zone.
🧭 Trade Idea (Not Financial Advice):
📥 Long Bias:
Entry: On confirmed breakout above $108,200
SL: Below $107,000
TP: $111,800 – $112,300
📌 Conclusion:
The chart setup suggests a potential bullish reversal 📈 from a key support zone, supported by EMA 200. Watch for a break above the 50 EMA for momentum confirmation.
🧠 Always confirm with volume and wait for confirmation before entering a position.

Bitcoin (BTC) Technical Analysis for the Week of May 26 - June 1#Current Price and Market Context (as of May 24, 2025):
Price: Bitcoin is trading around $103,000–$111,000, with recent consolidation near $103,000 after facing resistance at $105,000.
Market Sentiment: Bullish, with the Fear & Greed Index at 78 (Extreme Greed) and 28 technical indicators signaling buy versus 6 bearish signals.
Volatility: Bitcoin has shown increased volatility recently, with a 0.94% daily volatility estimate.
# Forecast for Next Week (May 26 - June 1, 2025)
--Bullish Scenario:
Probability: High (based on 73% bullish market sentiment and technical indicators favouring buy signals).
Price Target: $124,000–$127,000, with a potential push toward if resistance at $105,000 is decisively broken in weekly time frame
Catalysts:
Continued institutional inflows (e.g., $6.9B in U.S. spot Bitcoin ETF inflows over three weeks).
Sustained trading above key EMAs and support levels ($103,000–$106,000).
Bearish Scenario:
Probability: Moderate (due to overbought RSI and recent resistance at $105,000).
Price Target: A pullback to $100,000–$103,000, with a deeper correction possible to $95,000 if support at $103,000 fails.
-- Disclaimer --
This analysis is based on recent technical data and market sentiment from web sources and X posts. It is for informational purposes only and not financial advice. Trading involves high risks, and past performance does not guarantee future results. Always conduct your own research or consult a SEBI-registered advisor before trading.

BTC/USD Bullish Setup: Double Bottom Breakout Targeting $110,000 Trade Setup Analysis
1. Support & Resistance Zones
Support Zone (Buy Zone):
Highlighted in purple, between $103,764 and $104,633, with a noted stop loss area near $104,061.
Resistance/Target Zone (Take Profit Area):
Around $109,878 – $110,002 labeled as “EA TARGET POINT”.
2. Double Bottom Pattern (Bullish Signal)
There are two orange circles at the bottom, indicating a double bottom pattern—often a bullish reversal signal.
This is supported by a neckline break near the entry point at $104,534.
3. Moving Averages
Two moving averages are displayed:
Likely a short-term MA (red) and a medium/long-term MA (blue).
The price crossing above both suggests bullish momentum.
4. Trade Plan
Entry Point: Around $104,534
Stop Loss: Below $104,061
Take Profit (Target): $109,878 – $110,002
Risk/Reward Ratio: High, given the tight stop and wide target.
📈 Price Projection
The blue arrowed path suggests:
A minor dip or consolidation near $104,534, followed by a strong upward move toward the target zone.
The movement outlines a classic cup-and-handle or double-bottom breakout pattern.
🧠 Conclusion
This is a bullish trading setup for BTC/USD with a favorable risk-reward ratio. The chart suggests:
Buying near $104,534
Stop loss just below support
Targeting a move to ~$110,000

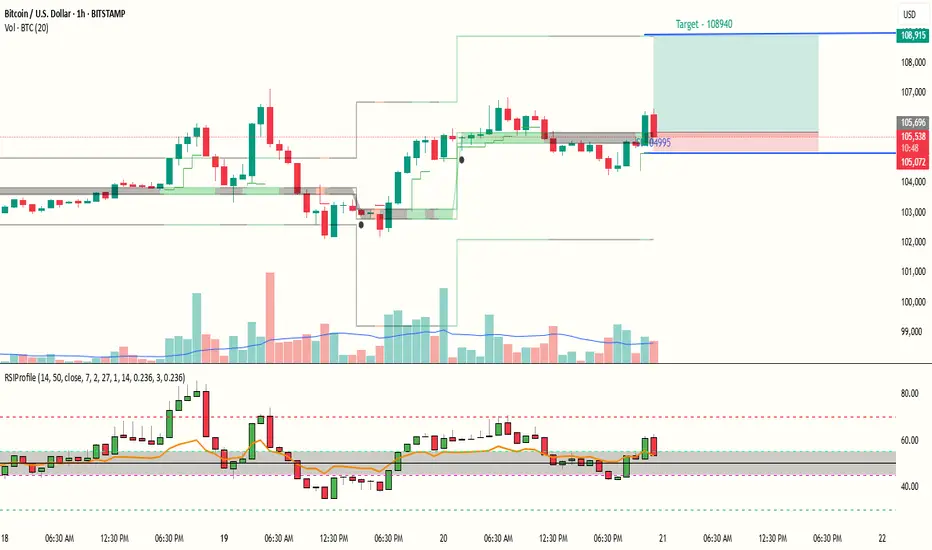
BTC ready for continuation of UP move with a reward ratio of 5RSI Profile shows a positive trend for BTCUSD and and risk reward ration is above 5. Also a Bullish triangle pattern seems to reach near complete on BTC Chart. Price is above RSI Point of Control, hence a small SL below POC and target is near the Value area High.
Entry near 105600
Target near 108940
Sl near 104995
RR : 5.16
PS : Above is only for Educational purpose and does not constitute any financial advice. Do your Own Research.
Bitcoin 1D Technical Commentary Paths- Bitcoin is currently trading at 105,148$
- Bitcoin is trading at a crucial BUY SIDE Liquidity area where breakout traps are highly possible, ATH was 109,490$ one tap above that will make retailers open aggressive longs and make them super bullish too
- Bitcoin printed an impulsive move from 88,000 which led to large imbalanced candles getting printed and it eventually printed 2 Inefficient gaps which is likely to get filled
- We have 2 paths, we either print a new high and fill 96,000 before we move up again or else we move towards the inefficient gaps and then print a new all time high

Bitcoin Short Setup –Supply Zone Rejection Trade Plan (1H Chart)(BTC/USD – Technical Setup)
🔵 Trend Setup:
⬆️ Resistance Line – Price is struggling to break above this level.
⬇️ Support Line – Price bounced several times here before breaking down.
🟢 EMA 70 – Currently around 104,435.9, acting as dynamic support/resistance.
📍 Key Levels:
🔴 Stop Loss Zone:
107,488.4 to 107,402.4
(🚨 Strong resistance, limit losses!)
🟡 Entry Point:
106,026.8
(🟨 Inside the Supply Zone – Ideal for Sell)
🟦 Supply Zone:
106,026.8 to 107,402.4
(⚠️ High selling pressure expected here!)
🔵 Break of Structure (BOS):
Price broke below the rising support line
(📉 Bearish confirmation!)
🎯 Target Point:
99,000.0
(💰 Take Profit Target!)
🔻 Trade Idea:
SELL at 106,026.8
🛑 Stop Loss: 107,488.4
✅ Target: 99,000.0
Risk-Reward looks solid.
This is a short setup expecting a drop after a retest of the supply zone.

$BTC Facing Strong Rejection – Correction Ahead?CRYPTOCAP:BTC is showing clear rejection signs from the trendline near the key resistance zone around $107,000, replicating the December 2024 - January 2025 structure.
Hanging Man candle near resistance
Bearish RSI divergence
MACD bearish crossover
Weak buying pressure vs growing selling volume
Stochastic RSI fading out
one retest around 97000$
If $90K support breaks, watch out for a deeper drop toward $60K.
Market structure suggests a smart correction is brewing. Don’t ignore the signs.
bitcoin zonecould this pink line act as a mirror? Can we perhaps range sideways in this region for a while and then shoot up eventually? It appears it can happen. These prices are uncharted waters so nothing can be said for certain. But we can hope for the best. Perhaps while bitcoin ranges there will be an eth season

"BTC/USD Short from 104,855 – Target 93,159. Entry Point
104,855 USD is marked as the entry point (likely for a short position).
The current price is around 103,775 USD, slightly below the entry level.
2. Resistance Zone
Highlighted just below the entry point (~103,000–104,855 USD).
Price is currently testing this zone, possibly indicating a failed breakout or pullback setup.
3. Stop Loss
Placed around 104,807 USD, just above the resistance area, in a shaded purple zone.
Suggests the trade strategy is based on shorting near resistance with a tight stop.
4. Target
EA Target Point is marked at 93,159 USD.
Implies a projected downward move of about −11,264 USD (−10.76%) from entry.
5. Indicators & Tools Used
Moving Averages: 200-period (blue) and a shorter MA (red), showing bullish momentum.
Support/Resistance Zones: Multiple purple rectangles denote demand/supply areas.
Trend Lines: Used to capture recent bullish momentum; a break of the lower line may confirm a trend reversal.
6. Pattern Recognition
Series of lower highs forming after a strong uptrend could suggest bearish divergence or distribution phase.
The price appears to be stalling at the resistance area, aligning with a potential short setup.
🧾 Trade Setup Analysis:
Bias: Bearish (short position).
Entry: 104,855
Stop Loss: 104,807 (tight SL above resistance zone)
Take Profit: 93,159
Risk-Reward Ratio (RRR): Roughly 1:10, which is aggressive and would require high conviction or confirmation
