Bitcoin (BTC/USD) Price Analysis: Bearish Breakdown Ahead?🔥 Bitcoin (BTC/USD) 1-Hour Chart Analysis 🔥
🔹 Trend Analysis:
🟡 Price was moving in an ascending channel 📈 but has broken below the trendline.
🟠 A retest of the broken trendline is happening, suggesting a potential drop 📉.
🔹 Trade Setup:
🔽 Short Entry: Expected rejection from the trendline.
❌ Stop Loss: $85,671 - $85,710 (Above resistance).
✅ Take Profit Target: $81,386 - $81,347 (Bearish target 🎯).
🔹 Indicators & Confirmation:
📊 EMA (9) at $84,254 → Acting as resistance 🚧.
🔄 Break & Retest Pattern → Typical for a bearish continuation 🛑📉.
🔹 Conclusion:
⚠️ Bearish Bias: If the price rejects the trendline, it could drop towards $81,386 🎯.
🚨 Invalidation: If the price breaks above $85,710, the short setup is canceled ❌.
Btcusdanalysis

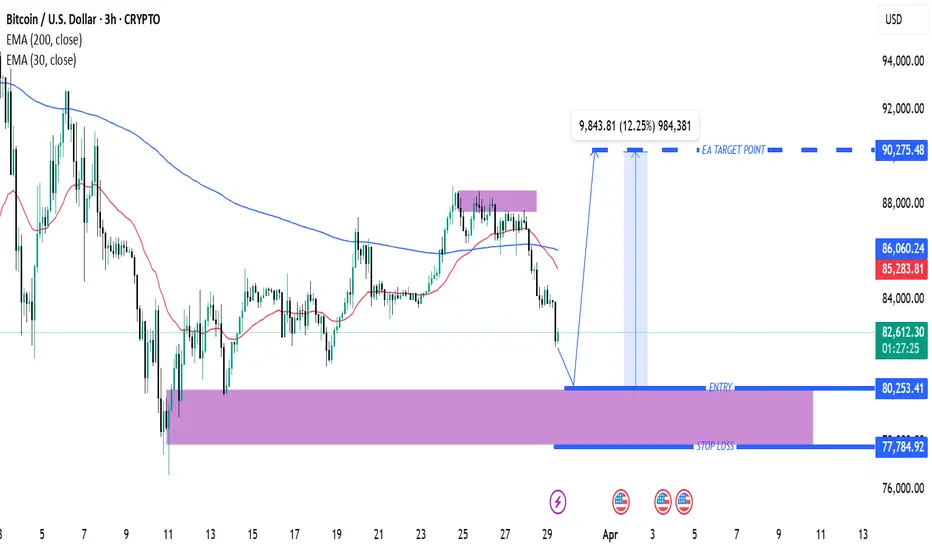
Bitcoin (BTC/USD) 3H Analysis: Key Support & Potential 12% UpsidSupport and Entry Zone (Purple Area at ~$80,253.41)
A significant support zone is marked in purple, indicating a potential area for entry.
This is an area where buying interest is expected.
Stop Loss (~$77,784.92)
A stop loss level is defined below the support zone, which is a risk management strategy.
Target Price (~$90,275.48)
The chart suggests a bullish move if the price bounces from the support.
The expected price increase is around 12.25% from the entry level.
Exponential Moving Averages (EMA)
30 EMA (Red Line, $85,290.12): Short-term trend indicator.
200 EMA (Blue Line, $86,061.21): Long-term trend indicator.
The price is currently below both EMAs, suggesting a bearish trend in the short term.
Market Outlook
The price has recently rejected resistance (purple zone above).
If it holds support at ~$80,253.41, a reversal to the upside is expected.
If the support breaks, further downside could follow.
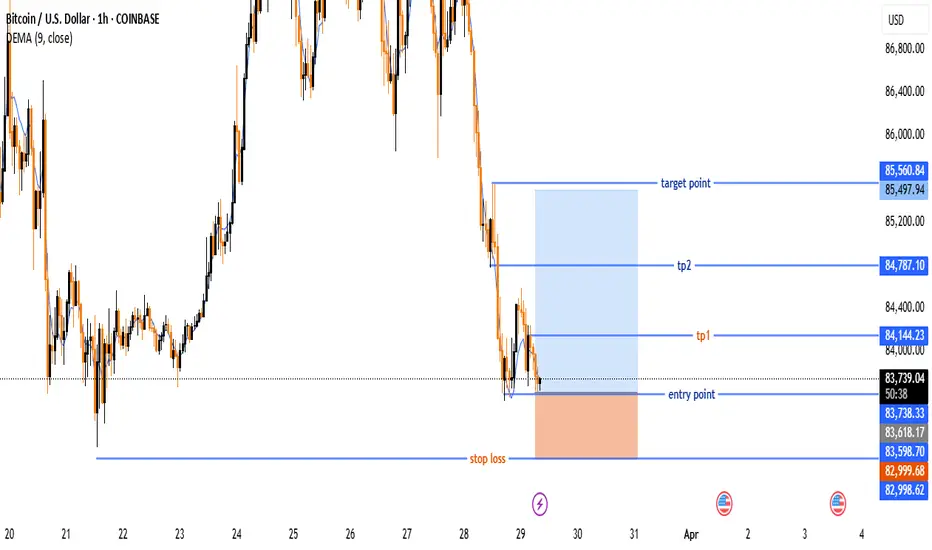
Bitcoin (BTC/USD) Trade Setup – Potential Reversal &Target Leves🔵 Entry Point:
🔹 Around $83,678.04 – The suggested buying zone.
🛑 Stop Loss:
🔻 $82,998.62 – The price level where the trade will be exited if it moves against the plan.
🎯 Target Points:
✅ TP1: $84,144.23 – First profit target.
✅ TP2: $84,787.10 – Second profit target.
🏆 Final Target: $85,560.84 – The ultimate goal for the trade.
📈 Technical Overview:
🔹 The price is at a support level, with a potential reversal to the upside.
🔹 Risk-Reward Ratio is favorable, with a clear uptrend target.
🔹 DEMA (9) at $83,776.52 indicates a possible trend shift.
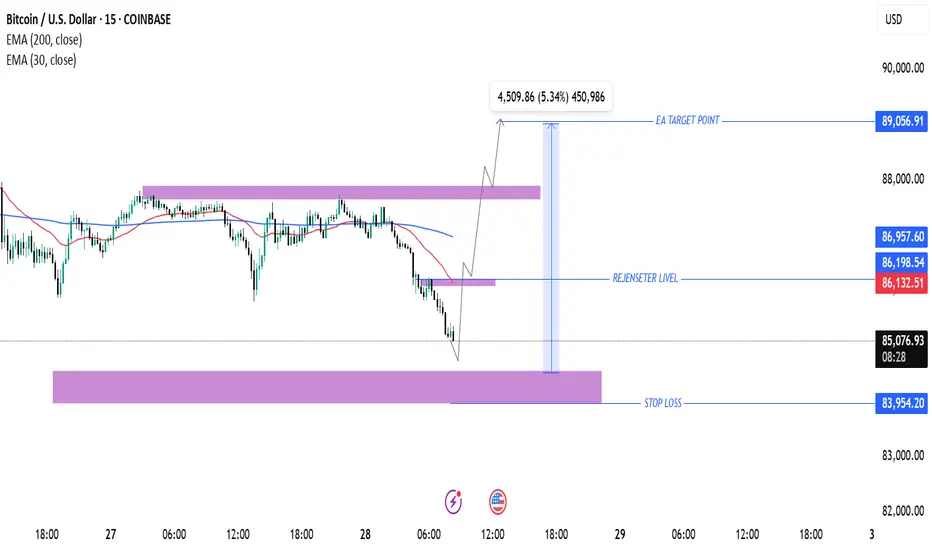
Bitcoin (BTC/USD) Trade Setup: Potential Reversal & Target Proje200 EMA (Blue): 86,960.21
30 EMA (Red): 86,149.39
The price is currently below both EMAs, indicating a short-term bearish trend.
Key Levels:
Stop Loss: 83,954.20 (marked in blue at the bottom)
Re-entry Level: 86,198.54 (near the 30 EMA)
Target Price: 89,056.91
Support & Resistance Zones:
Strong Support Zone: Around 83,954.20
Intermediate Resistance: Near 86,198.54
Major Resistance Zone: Close to 89,056.91
Trade Setup & Projection:
The chart suggests a potential reversal from the support zone.
The expected price movement shows a bounce from support, a breakthrough of the intermediate resistance, and a push toward the target price (89,056.91).
The expected gain is 4,509.86 points (5.34%).
Conclusion:
If BTC holds the support zone, an upside move is likely.
Breaking above 86,198.54 would confirm a bullish reversal.
Failing to hold support at 83,954.20 could lead to further downside.
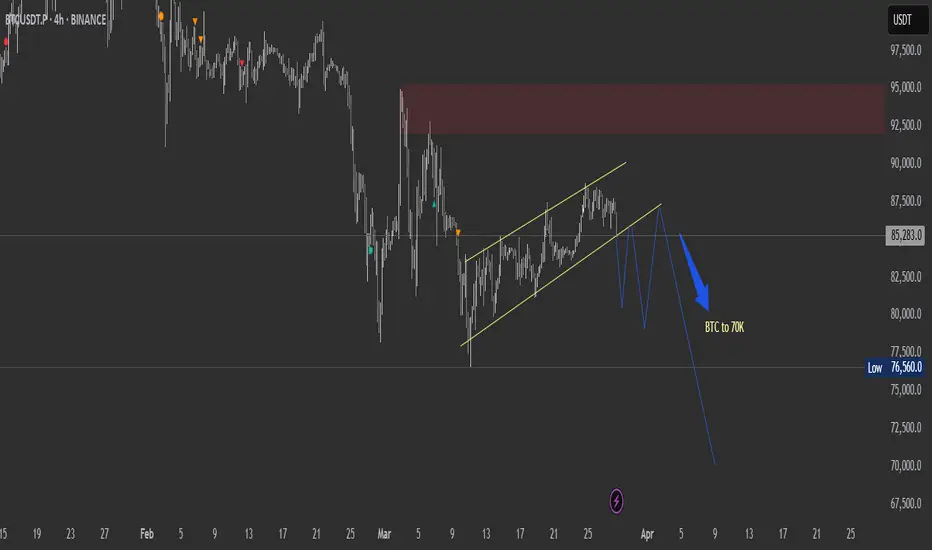
BTC to touch 70K if it breaksdown from this zoneTechnical analysis on the 4-hour chart suggests forming a bearish flag pattern—a continuation pattern that typically indicates a pause before the prevailing downtrend resumes.
If the current bearish flag pattern breaks down, Bitcoin's price could potentially decline to around $70,000. Such projections are based on technical analyses that consider factors like weak support levels and historical price movements.
Bitcoin (BTC/USD) 4H Chart Analysis: Bullish Breakout Ahead?📈 Ascending Channel:
🔹 The price is moving upward within a parallel trend channel.
🔹 Blue arrows (🔵) indicate resistance points where the price struggled.
🔹 Red circles (🔴) highlight support areas where the price bounced.
🟦 Fair Value Gap (FVG) Zone:
🔸 The blue-shaded area (FVG zone) suggests a possible retracement before a bullish move.
🔸 If the price dips into this zone, it may find liquidity and bounce back up.
📊 Projected Price Movement:
⚡ Expected pullback → into FVG zone (🔽), then a bullish push (🚀) towards $90,686.72 🎯.
🟡 Yellow arrow shows the anticipated price path.
📉 Support & Resistance Levels:
✅ Support: Around $86,000 - $86,500 (FVG zone).
🚀 Target: $90,686.72 (next major resistance).
📌 Exponential Moving Average (DEMA - 9):
🔹 The blue line (DEMA 9) at $87,414.57 is acting as dynamic resistance.
🔹 A break above this could confirm further upside movement.
💡 Conclusion:
🔸 Bullish bias remains strong 📈.
🔸 Watch for a dip into the FVG zone before a potential rally 🚀.
🔸 If Bitcoin holds support, it may reach $90K+ soon 🎯🔥.

Bitcoin (BTC/USD) 2H Analysis: Potential Bullish Continuation or30 EMA (Red, 86,440): Indicates short-term momentum.
200 EMA (Blue, 85,153): Represents long-term trend support.
Support and Resistance Zones
Support Zone (Purple Box - ~86,271 to 85,153): Price is likely to bounce from here.
Resistance Zone (~87,149 and above): Breakout above this could push price higher.
Trade Setup
Entry Consideration: The price is currently testing a demand zone (purple) after a pullback.
Target (Take Profit - 90,118): Expecting a bullish move.
Stop Loss (~86,658 or lower): To manage risk.
Potential Price Action
If Bitcoin holds above the purple demand zone and 30 EMA, it could rally to 90,118.
A breakdown below 86,271 could push it toward 84,366 or lower.
Conclusion
Bullish Bias: If price holds above the support level.
Bearish Risk: If it breaks below the purple zone.
Recommendation: Monitor support at 86,271 and 85,153, as a bounce from these areas could confirm an uptrend.

Bitcoin (BTC/USD) Bullish Momentum: Key Levels and Trade Setupuddy'S dear friend 👋 SMC Trading Signals Update 🗾 🗺️
Technical Analysis:
Timeframe: 4-hour chart
Current Price: $88,244
Trend: Uptrend within an ascending channel
Supply Resistance Zone: $92,721 (Potential reversal area)
Fair Value Gap (FVG) Support Zone: $87,200 - $87,600
200 MA Resistance: Price is approaching the 200 Moving Average, which could act as resistance.
Key Levels:
1. Support:
FVG Zone (~$87,200 - $87,600) – Potential buy zone
Major Support: $86,649
2. Resistance:
$92,721 (Supply Zone) – Key target level
$90,000 Psychological Resistance
3. RSI Indicator:
Currently at 76.37, indicating overbought conditions.
A potential pullback could occur before further upside.
Mr SMC Trading point
Risk Management Strategy:
Long Entry: Near FVG Zone (~$87,200 - $87,600) if price retraces.
Stop Loss: Below $86,649 to limit downside risk.
Take Profit: Around $92,721 for a risk-reward trade.
Market Outlook:
Bitcoin remains bullish, but the RSI suggests a possible pullback before continuation.
A retracement into the FVG Zone may provide a better buying opportunity before the next leg up.
If price breaks below the FVG zone, the uptrend could weaken.
Pales support boost 🚀 analysis follow)

Bitcoin (BTC/USD) 4H Analysis: Bullish Breakout or Pullback? 🔍 Key Observations:
🔹 📈 Trendline Breakout: The descending trendline (white) has been broken, signaling a potential uptrend.
🔹 📍 Support & Resistance Zones:
🟢 Strong Support (~$80,349 - $82,000): 📉 If price drops, this zone could act as a bounce area. 🛑 Stop-loss is placed below.
🟡 Resistance (~$86,000 - $88,000): 🔄 Currently testing this level—either a breakout or a rejection could follow.
🔵 Next Target (~$94,000): 🚀 If Bitcoin pushes above resistance, this could be the next stop.
📊 Possible Price Action Scenarios:
✅ Bullish Path:
🟢 Breaks Above $86,000 → Targets $94,000 🚀
🔄 Small retest of support before continuing up 📈
❌ Bearish Path:
❌ Rejected at $86,000 → Pullback to $82,000 🔽
📉 If support fails, price may drop further
🎯 Conclusion:
🔥 Bullish Bias: 🟢 A breakout above $86,000 increases the chance of hitting $94,000+.
⚠️ Watch for retests! 🔄 A pullback before an upward move is possible.
🚀 Final Thought: If BTC **

Lion Indicator bitcoin 1100 points running target5 reachThis lion indicator work well on 3min and 5min and 15 mins timeframes.
Disclaimer - this indicator only for education purpose and paper trade only

BTC -15 min LONGTrendline:
There’s a clear ascending trendline acting as support.
Price is currently testing the trendline, which aligns with the Order Block zone.
Order Block:
The highlighted yellow zone marks a demand area (Order Block), suggesting a potential bounce if buyers step in.
Potential Setup:
Entry: Look for a bullish confirmation (e.g., bullish engulfing, hammer) within or just above the Order Block zone.
Stop Loss (SL): Place the SL slightly below the Order Block at around 84,050 to allow for minor wicks and volatility.
Target:
First target: Around 84,400 (recent high resistance level).
Second target: If momentum sustains, aim for 84,600 to 84,700 (next key resistance).
✅ Trade Plan:
Entry: ~84,150 (inside the Order Block)
SL: ~84,050
Target 1: ~84,400
Target 2: ~84,600
This setup follows the trendline and order block confluence, giving a favorable risk-to-reward ratio.

BTCUSDT EA MAN UPDATE > READ THE CHAOTAIN **BTCUSDT EA MAN Update – Analysis in English**
---
### **BTC/USDT Analysis (15 min) – Bullish Trend in Sight**
#### **Key Observations:**
- **FVG Support Zone (Fair Value Gap):** The price has reacted positively to this zone and is showing signs of a bullish recovery.
- **EMA Confluence:** The price is currently below the 30 EMA (red), but a breakout above could confirm stronger bullish momentum.
- **Target Point:** The analysis anticipates a move towards **85,104 USDT**, possibly after a slight pullback to test the support zone.
If the price sustains above the 30 EMA and breaks through the minor resistance, the bullish target seems achievable.

Bitcoin (BTC/USD) Short Trade Setup – March 15, 2025This is a Bitcoin (BTC/USD) trading setup on a 30-minute timeframe from TradingView. Here's a breakdown of the analysis:
📌 Entry Price: 84,375
📌 Stop Loss: 85,500 (Red Zone - Risk Area 🚨)
📌 Take Profit Levels:
TP1: 83,429
TP2: 82,640
Final Target: 81,259
🔍 Analysis:
The trader is setting up a short position (expecting BTC to decline).
Risk-to-Reward Ratio (RRR) seems favorable, as the target is much lower than the stop loss.
If BTC drops below 83,429, further declines toward 81,259 are expected.
If BTC breaks above 85,500, the trade is invalidated.
🛑 Conclusion:
A bearish trade setup looking for BTC to decline. 📉
Watch for confirmation of downward movement before entering.

Bitcoin Looking good here for short termBitcoin Looking good here for short term, If bulls able to hold price above 80K then we can expect a good bullish rally for short to mid term towards 95k and then 100K.

BTC#21: Fear Index Rising. Will BTC Continue to Fall? 💎 💎 💎 BINANCE:BTCUSDT BTC's decline has somewhat slowed down in recent days with a recovery from 78k. We will plan for BINANCE:BTCUSD next 💎 💎 💎
1️⃣ **Fundamental Analysis:**
📊 The Fear and Greed Index dropped to 30 today, and the level is still fear
🚀 Cumulative net inflows into US spot Bitcoin ETFs have dropped to their lowest level since January 2
📌 The market is still in a pessimistic phase about BTC's bullish outlook. The outflow of money from the market is not only due to BTC's decline but also due to concerns about an economic recession due to Trump's unstable policies.
2️⃣ **Technical analysis:**
🔹 **D frame**: BTC's downtrend has shown signs of slowing down, but the main trend in frame D is still down. We will still need to wait for the price reaction in the resistance area to confirm.
🔹 **H4 frame**: The price trend is still down. The price reaction in the support area of 78K is not as strong as before, showing that market sentiment is still leaning towards the bears.
🔹 **H1 frame**: we are in a short-term correction. The target for this correction is the resistance area of 88-91K as you can see on the chart
3️⃣ **Trading plan:*
As you can see from the multi-frame perspective, the main trend is still down, but we are in a short-term correction. We can choose to wait for the price to return to the resistance area to trade in line with the main trend or if the price has a slight recovery, set up BUY to seek profit. However, because the main trend is down, we need to stop loss fully and not be greedy when the price hits resistance because the price can return to the main trend at any time.
💪 **Wish you success in achieving profits!**

BTC AT CRITICAL LEVEL – BREAKOUT OR PULLBACK?🚀 BTC/USD – KEY BREAKOUT LEVELS AHEAD!
📌 Market Overview
Bitcoin (BTC/USD) is currently trading around $84,593, rebounding strongly from support. The price is approaching a major resistance zone at $87,049 - $89,748, where a crucial reaction is expected.
Overall sentiment remains influenced by market psychology, institutional activity, and macroeconomic factors. BTC is still trading within a descending wedge pattern, signaling that the corrective phase is not over unless a breakout occurs.
📈 Technical Analysis – Key Levels to Watch
🔹 Major Resistance Levels:
🔺 $87,049 - $89,748: A strong supply zone; a breakout here could trigger a bullish move toward $92,000+.
🔺 $90,005 - $92,000: The next target if BTC successfully clears resistance.
🔻 Major Support Levels:
🔹 $82,000 - $80,000: A short-term support zone where buyers might step in.
🔹 $78,935 - $78,000: A critical support area—losing this level could lead to a sharp sell-off.
📌 Key Observations:
If BTC fails to break $87,000, a retracement toward $80,000 - $78,000 is likely.
A confirmed breakout above $87,000 - $89,000 could signal further upside momentum toward $92,000 or higher.
🌍 Fundamental Analysis – What’s Driving BTC?
🔥 1. Institutional Demand & Market Sentiment
Market sentiment remains positive, but BTC needs stronger institutional buying to sustain further gains.
On-chain data indicates whales are accumulating BTC at lower price ranges, but resistance remains strong at $87,000.
Bitcoin ETFs are seeing steady inflows, providing fundamental support for long-term bullish momentum.
📊 2. Macroeconomic Factors & USD Impact
The DXY (US Dollar Index) is weakening, which is generally bullish for BTC.
The Federal Reserve’s monetary policy remains a key factor—interest rates are expected to stay high until mid-2025, which could slow BTC’s momentum.
Recent CPI and PPI data indicate persistent inflation concerns in the US, boosting demand for BTC as a hedge.
💰 3. Whale Activity & Institutional Moves
On-chain data reveals significant BTC withdrawals from exchanges, signaling long-term accumulation.
If large buyers continue accumulating, BTC could push above $90,000.
However, if whales take profits near resistance, BTC may retrace toward $80,000 - $78,000 before another move higher.
⚡ Trading Scenarios
✅ Scenario 1: Bullish Breakout Above $87,000
If BTC closes above $87,000 with strong volume, expect a rally toward $90,000 - $92,000.
A further push could target $95,000 if bullish momentum sustains.
❌ Scenario 2: Rejection at $87,000 - $89,000
If BTC faces resistance, expect a pullback toward $82,000 - $80,000.
A deeper correction could test $78,000, where strong support lies.
📢 Conclusion – Watch for a Critical Breakout!
📌 BTC is testing a major resistance zone ($87,000 - $89,000)—a breakout could fuel further upside.
📌 Market sentiment remains positive, but a rejection could trigger a pullback toward $80,000 - $78,000.
📌 Monitor Fed policies, institutional activity, and on-chain trends for better trade positioning.
📌 Traders should wait for confirmation before committing to a breakout or short position.
💬 Do you think BTC will break above $87,000, or is a deeper pullback coming? Share your views below! 🚀🔥

BTCUSDTBINANCE:BTCUSDT
As you can see in BTCUSDT was consolidation upto 1day so either side breakout we can take a trade and expect up to 5% movement. Takr retest entries to avoid falls breakouts and plan your trade accordingly.

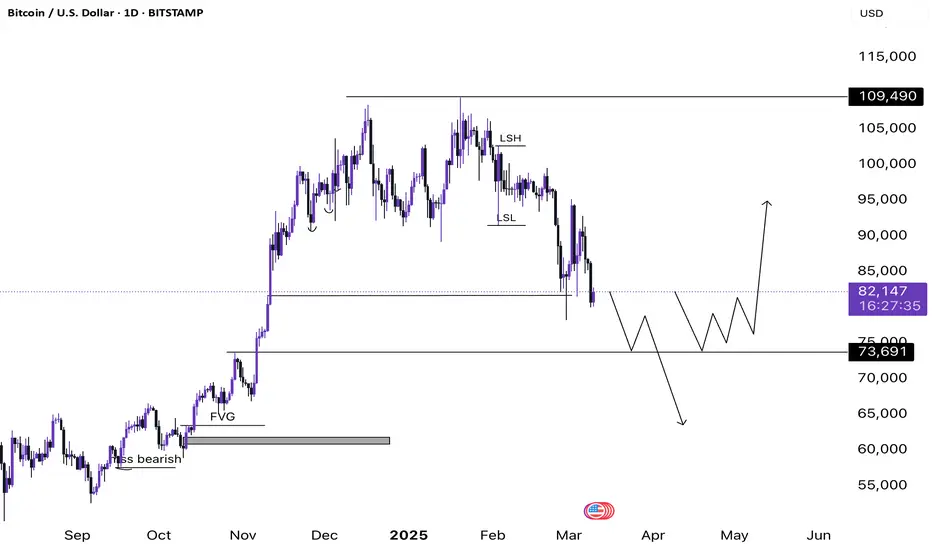
Bitcoin 1D Bear Market Technical Analysis - Bitcoin is currently trading at 82,249$
- Bitcoin has so far erased 24.98% from its All Time Highs and especially after Trump's presidency.
- Market Structure shift looks completely bearish, unless we flip above 96,000$ on a daily timeframe
- We have many inefficiencies left until 73,691$ and I have drawn those paths as well.
- The first path shows price filling the inefficiency and then taking out more liquidity to fall further and clear the fair value gap sitting at about 63,329$
- The second path shows we might not not fall below 73k after filling the inefficiency rather we start building a base before moving towards the upside.
- Market doesn't look good from a structure perspective be very selective when it comes to punching trades.
BTC broke down the important trendlineBTC broke from the important trendline and headed to $78k.
Momentum looks good and might pick up. Present 4hr candle should be considered

BitcoinBitcoin rising from $85,189 to $88,000 today implies an anticipated increase of about 3.3%. Given the current market conditions and recent price movements, such a rise is within the realm of possibility, though it would require a reversal of the current downward trend.
It's important to note that Bitcoin's price has experienced significant fluctuations recently. Following President Donald Trump's announcement of a U.S. strategic crypto reserve, Bitcoin's value surged by over 11%, reaching a high of $95,136. However, it remains below its record high of $109,135 achieved in January 2025.

BTC#20: BTC Analysis: Price SW In Triangle – Next Direction?💎 💎 💎As analyzed in the previous article, BINANCE:BTCUSDT gave a bad price reaction when touching the old resistance area of 95~96x. The current price is SW in the triangle. Let's analyze the next plan BINANCE:BTCUSD : 💎 💎 💎
1️⃣ **Fundamental analysis:**
📊President Donald Trump signed an executive order to establish a Strategic Cryptocurrency Reserve that includes 200,000 BTC seized in criminal or civil cases. It will be held as a reserve asset and not sold. In addition, the Government will not purchase additional assets for the reserve.
🚀The Treasury and Commerce Departments may consider budget-neutral Bitcoin purchases. Agencies must provide full accounting books of digital assets to the Ministry of Finance. Regulatory crackdowns on crypto assets are ended
📌 From the above information, it can be seen that BTC and the top 5 coins in the market have been officially recognized as an asset. The legal framework will take time to complete. However, BTC will receive more attention and attention when the US government makes any purchase moves to hoard. This will lead to a huge demand for BTC in the near future.
2️⃣ **Technical analysis:**
🔹 **D Frame**: The price structure is still bearish, we have had a recovery phase to retest the resistance area and give a bad price reaction. It is entirely possible that BTC will go down to the support zone below
🔹 **H4 Frame**: We can see the price reaction more clearly. The continuous reaction of lower peaks in this area shows that the market sentiment is still dominated by the bears even though BTC has been recognized as a reserve asset.
🔹 **H1 frame**: The price is still SW in the triangle area in recent days. The price range is gradually narrowing as shown on the chart
3️⃣ **Trading plan:*
⛔ At the present time, it is no longer suitable to wait for a BUY position. The price has tested the resistance area and reacted badly, so there is a high possibility that there will be a correction below the support area below at any time.
✅ The top priority is to trade in accordance with the main trend in the SELL direction. Although the information about the Reserve Fund has given a positive response, the government not buying more assets for the reserve is also a sign that short-term cash flow will be difficult to push into BTC, especially when tariff policies are giving negative reactions to the economy.
💪 **Wishing you success in achieving profits!**

BTC LONG SETUPBTC will fill FVG at 85,500 before it pumps to the 98K zone.
Also, the Friday White House Crypto Summit on Friday is even slightly positive.
Buckle up for LONG!

M2 Money Supply 45 Day adjusted - BTCM2 Money Supply 45 Day adjusted BULLISH!!!!! If you adjust the M2 money supply by 45 days, it can possibly predict the future price action of Bitcoin and crypto.
