**Scenario for BTC**1️⃣ **Fundamental analysis:**
📊 Nonfarm data last weekend was good for the USD and impacted the interest rate cut policy. It is likely that we will have to wait until June for the next interest rate cut.
📉 Current market sentiment is affected by this information, plus the recent sharp increase in BTC price has made many people doubt the momentum to continue to increase to a higher price range. Therefore, the increase has temporarily slowed down.
2️⃣ **Technical analysis:**
🔹 **Week frame:** Last week closed not very optimistically when the price reacted badly at the resistance zone of 101k~104k.
🔹 **Frame D:** The price structure is also not good when there are 2 peaks with the latter peak lower than the previous peak. The price is approaching the support zone but there is no clear reaction, it is likely to adjust to a lower support zone.
🔹 **H4 frame:** Based on the Zigzag line, we can see the classic head-and-shoulders pattern. At this time, we should not catch the bottom when the price has created a lower peak, showing that the market sentiment is no longer interested in the possibility of BTC's price increase.
3️⃣ **Trading plan:**
✅ If you have a **SELL** order in a good position, congratulations! 🎉 You can absolutely wait for a better profit when BTC is likely to break the current support zone to reach the next support zone of 85~86xxx.
⛔ **Absolutely do not BUY** at the present time, when the price structure shows a short-term downtrend.
💪 **Wish you successful trading!** 🚀
Btcusdanalysis

BTC buying opportunity with small SLBTC has recently given a great move towards the up side . Looking at this move, there is a high chance of buying from here. Here the stop loss is small but the target is very big, so it will be fun to plan this trade.

Bitcoin near Cycle Top ? Or is it really different this time ?I am a man that likes to look at Both sides of a Story, even more so when it involves trading with with large or small amounts of money
And I am even more carious with Bitcoin this Cycle.
The Adoption of Corporations that can Buy and amass large amounts of Bitcoin is Highly likely to change how Bitcoin works. So many "Experts" deny this.
And the proof that this is or not happening, is simply by looking at the Price Action, past and present.
That is what I do almost everyday since 2015 and charting it here on TV for the last 6 years.
And I have found THIS last night.
And I have to show you and explain this.
** The Figures in the Logarithmic chart below are approximate and yet near enough to accurately reflect the idea I am about to present.
This chart is Bitcoin PA since The LOW of November 2009
From that Low to cycle ATH is A and the same principle is applied to the following Cycle Low to ATH.
The Data shown is the % difference between a cycle Low to Cycle High as compared to the previous cycle.
For example. Cycle B was 95.8% smaller than Cycle A
As we can easily see, as BTC increases in price, it becomes harder to make PA move higher. More money is required and so that "ATH point" Arc becomes Flatter each cycle.
As a result, the Negative % difference is reduced each time.
And we are near that ball park now in 2025 at - 73.2%
The average of the previous 3 cycles is - 84.7 % - the first was an exceptional year and so if we remove that, we have an average of - 79,1 %
But I am looking at the simple fact that we went from - 80.1 % to - 78.2 % in 2 cycles, that are in a channel that PA has been in ever since 2014 ATH. ( I have explained this channel in other posts )
That is a - 2.1 % change and so if we apply that to the previous -78.2 %, we may expect a final figure of - 76.1 %
This still Gives PA some room to move before a final ATH - POSSIBLY
Some are Expecting a 200K figure for this cycle ATH.
If that happens, it would destroy this pattern and be a -40% difference to the previous cycle.
What is VERY important to understand here is that, if we do make it over 120K, it does begin to make things Different.
And the higher we go, the Bigger that difference to the Pattern we all now accept as the default 4 year cycle.
So, in conclusion, there is a very real possibility that we have reached cycle Top, or very near, in 3 years.
We did this in 2021 with a March ATH but we all now know, we went to November 2021 before the final ATH was reached, sticking to the 4 cycle and Keeping that % Different model explained above.
If that happens again, we will not see another ATH till later in 2025 and even then, it will not be a lot greater than the last, repeating what happened in 2021.
BUT - we do not know the impact of Corporate usage yet.
Should this drive us over and beyond the 120K Mark,Things Will be different and then, referring to the past could be prone to error.
THAT would be True Price discovery.
This is all numerical FACT as can be seen on the chart
My personnel opinion is that we do have more to come this cycle but maybe not till later in the year. It depends on market sentiment and that is likely to be Cool if the USA FED refuses to lower interest rates further this year,
The First FED meeting of the year is 28 29 Jan
We may be near a "Classic" cycle Top, and we may well be on the edge of creating a New Cycle pattern
We may not.
Only Time will tell and YOU need to make plans for Either reality
Trade Safe, be cautious and LOVE LIFE

One reason why I am Still VERY bullish on Bitcoin
This chart is very simple and it explains itself very well
The upper trend line is formed by going through January candles only ( I have used a Line Chart here for Visibility but rtust me, that line goes through January Candles )
And, as you can see, when PA is above this trend line, it is en-route to ATH
It also helps us see where we are in realtion to previous Januaries.
And, If I am honest, we are Lower than we should be,.
If we look in the channel, the Jan before PA crossed the trend line,going to the 2017 ATH, PA was 114% above the lower Trendline.
The January before crossing the trendline en-route to 2021 ATH, PA was 214% above the Lower trendline - It has to be said, this cycle was blown out of proportion by excessive Leverage etc and, for me, this led to a premature ATH in March. The Real ATH are Late in the year, Nov or December.
This January, 2025, PA is only 87% above that Lower trendline.
But despite the Low level, we do seem to be entering a Much more friendly Crypto Finacial world now and I do expect PA to pick up. If we were to remain under the rising line of resistance, coming off the initial Wave higher in 2023, we hit the upper trendline around 2nd Half of summer. 2025 and at a price around 256K usdt
The ATH will be above this line and we will have to wait to see how much higher it goes.
This is the GREEN YEAR in Bitcoin Cycles.
Lets go
Please Note, I do expect the first quarter to be possibly not so friendly.
We have to wait an see but by this time next year, I am hoping we will have had the ATH
Time will tell

BTC - At Support once againAfter touching earlier predicted first target of 102 price has fallen more than expected and holding at previous proven support levels. In my view BTC is once again at support and some fresh buying or accumulation is visible. For whatever reason price could dance for big players to buy more at support levels. Its popular idea to buy back whatever was partially booked at 102 levels. we cannot avoid this and we might see partial selling above 102K again and buying below 97K. Higher the price move up most will keep booking profits and more the price move low more buying is the trend now. Jan is the month we are waiting for banana spike to take price to 125 or above. Hope it happens once new president takes charge in office. As days near to this even I expect more bullish move in BTC. I do not see WW3 in Jan 2025.

$BTC Forms Triple Bottom Pattern - Key Levels to Watch!#Bitcoin has formed a triple bottom pattern. To validate this pattern, BTC needs to hold the $91,500 level. A potential scenario is a bounce from the oversold RSI area, which could lead to a retest of $101,750 or even a breakout toward the $115,000 region. However, if BTC loses the $91,500 level, the next major support is at $90,000. A breakdown below that could see BTC dipping to $85,000, $80,000, or even $75,000. Let's see how the price action unfolds!
long - 93000$
short - 90000$

BTCUSD TRADING POINT UPDATE READ >THE CAPTAINBuddy'S dear friend 👋
BTC USD Trading Signals 🗺️🗾 Update crypto trader BTC list week already take a break support level 91k back up trand list week post signals 🚀 analysis Done ✅ for target 🎯 point ☝️ now post again for New analysis technical patterns looks again buying zone right now 108k target 🎯💯
Analysis target we'll see 108k
Resistance level 108k
Support ✨ 99k
Mr SMC Trading point
Support 💫 My hard analysis Setup like And Following 🤝 me that star ✨ game 🎮


Bitcoin YEARLY CLOSE and OPEN
A Very simple chart that shows us all how early we aer in this, even if you are only joining in now.
I'll keep it simple because I am still slightly Fragile after last night lol
Anyway, The chance of a RED 2025 is slim if we go by previous years. This should be a Bullish end of Cycle.
But I will say, we have NO guarantees in this game and the Field has changed considerably BUT, I think, for the better in many ways.
So, Lean back and if PA Drops Early this year, do not worry, it is highly likely to rise a lot higher.

BTC USD TRADING POINT UPDATE > READ THE CAPTAIN Buddy'S dear friend 👋
BTC USD Traders SMC-Trading Point Crypto trade. Technical fundamental analysis update
BTC USD Traders looking for a support level 93469 Big support level I think 💬 test diamond zone back 💪 up trand 😜 99k wait for confirm 🙂 💯 if breakout that support level Next target Short 90k now still see Long bullish trade BTC New year 🎊 I think we'll buying it ☺️ crypto trader Old 100k again back 🔙
Mr SMC Trading point
Support 💫 My hard analysis Setup like And Following 🤝 me that star ✨ game 🎯

BTC - At Strong SupportBTC in news world wide and being moved up and down with each one's opinion and risk taking or profit booking needs. Yearend or month end along with holiday season impacted BTC. while I agree BTC is yet to give the parabolic or banana spike which was seen every 4 years and now is the time for that. Charts are discussed worldwide on one side and its constantly accumulated by people who know why BTC is better than Gold now and in coming days. In my chart two red lines are talked as bullish flag and break of that was called bearish by few and weak hands sold it causing slowness in absorption by people in need of BTC. At the same time BTC is seeing volume at support lines marked in green. Even in 5 or 15 minutes we can clearly see increased volume at which BTC is testing its support for 5th time. Earlier mentioned megaphone or loudspeaker patter didnt give 5 wave up move due to few selling at the bottom of bull flag area. The black line is the point of control of the complete price move seen last 2+ months. In my view levels below the POC - the black line is some kind of buying levels and above the black line is only selling area or profit booking. In my view below POC is accumulation going on by big players. with new Govt in US in Jan and as per 4 year cycle seeing parabolic spike is expected any time in Jan 2025. This is the time to hold tight and buy as much at every green levels support levels mentioned. we cant stop buying or selling of ETFs impacting money flow and supply & demand of BTC. actually smaller volume in the support could be either less supply or demand as well. Any big hand with new ETFs as talked with vivek or any other company going to give bigger parabolic up move. HongKong Fed or Govt and many such countries accumulating BTC making is better than GOLD to be bought, accumulated for 200K or higher in 2025. Happy New Year to all my dear friends. BTC will make everyone richer in fiat currency.

BTCUSD SHOWING A GOOD DOWN MOVE WITH 1:7 RISK REWARDBTCUSD SHOWING A GOOD DOWN MOVE WITH 1:7 RISK REWARD
DUE TO THESE REASON
A. its following a rectangle pattern that stocked the market
which preventing the market to move any one direction now it trying to break the strong resistant lable
B. after the break of this rectangle it will boost the market potential for break
C. also its resisting from a strong neckline the neckline also got weeker ald the price is ready to break in the outer region
all of these reason are indicating the same thing its ready for breakout BREAKOUT trading are follws good risk reward
please dont use more than one percentage of your capitalfollow risk reward and tradeing rules
that will help you to to become a bettertrader
thank you

Bitcoin Analysis Yesterday, we didn’t get a clear breakout and the market remains stuck between two level like forming red green pattern.
This chart shows the Bitcoin-to-USD (BTC/USD) price action, likely on the 1-hour timeframe, with indications of a potential bearish movement. Here’s a quick analysis based on the provided image:
Key Observations:
1. Current Price: The price is around $94,921, showing a slight decline (-0.23%).
2. Ascending Channel: The chart indicates a rising channel (black trendlines) that is nearing its upper boundary, suggesting potential exhaustion of the upward momentum.
3. Resistance Zone: A purple rectangle marks a resistance area where the price has struggled to break through.
4. Bearish Rejection and Projection:
• The price appears to be consolidating near the upper trendline but lacks strong bullish momentum.
• An arrow indicates a potential breakdown from the channel, aiming toward lower levels around $93,000.
5. CCI Indicator:
• The Commodity Channel Index (CCI) shows a decline from overbought territory (above 100), indicating bearish momentum could be building.
Potential Scenario:
• Bearish Breakdown: If the price breaks below the ascending channel, it could test the $93,000 level or even lower to the $92,000 support zone.
• Invalidation: If the price breaks above the resistance zone and holds, the bearish outlook would be invalidated, leading to further upward movement.
Trading Suggestion:
(Don’t follow me blindly as I am not a certified trader)
• Consider short positions if the price breaks below the channel and confirms with volume or candlestick patterns.
• Monitor support zones near $93,000 and $92,000 for potential profit-taking or reversal signals.
• Place a stop-loss above the resistance zone to manage risk.

$BTC Price Forecast: $75K, $85K, or $108K?Currently, I see three potential scenarios for BTC:
1. BTC is forming lower highs and may retest the previous resistance around the $108,000 level. After that, it could pull back to the $100,000 area before making a new all-time high.
2. BTC might retest the $90,000 level and then move upward. Alternatively, if it loses support at $90,000, it could drop to $85,000 before starting an upward trend.
3. In a worst-case scenario, BTC could undergo a significant correction, dropping as low as $75,000.

Bitcoin analysisWait for a breakout confirmation. Then, we might see a retest after that the market may fall to the level suggested in last post.
Check it out now!

Bitcoin analysisWait for a breakout confirmation. Then, we might see a retest after that the market may fall to the level suggested in last post.
Check it out now!

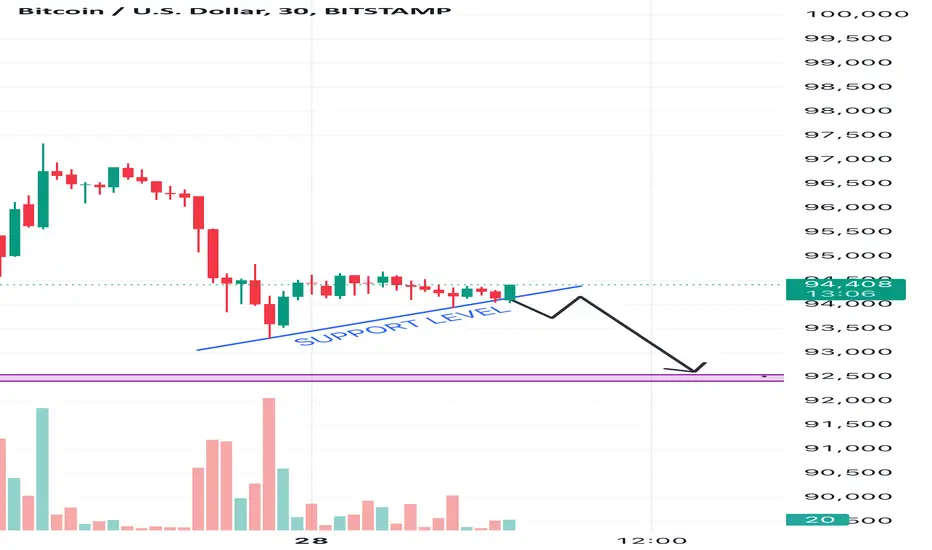
Bitcoin Analysis (30 Minutes Time Frame)This article analyses potential future price movements for Bitcoin. My analysis indicates that a breach of the $94,000 support level would likely trigger a downward trend, with the next support level anticipated at $92,500.
Here is the explanation for the analysis:
1. Support Level at $94,000:
• The upward-sloping blue line indicates a short-term support level, formed as the price previously found stability at or above this level. This trendline acts as a cushion, where buyers typically step in to prevent further decline.
•A breach below this support would signify that selling pressure has overwhelmed buying interest, breaking the psychological and technical barrier.
2. Trend Formation:
• The chart shows a consolidation pattern near the support level. This suggests market indecision, where price movement could either rebound upward or break downward.
• The downward black arrow on the chart indicates your expectation of a breakdown, based on weakening momentum and lower highs.
3. Volume Analysis:
• The declining volume bars in recent candles suggest reduced buying interest. This often precedes a breakdown, as sellers gain control of the market.
4. Next Support at $92,500:
• The purple line at $92,500 represents the next significant support level, where the price has historically found stability. If $94,000 is broken, sellers are likely to push the price toward this level, as buyers may regroup there to counter the bearish trend.
By combining these factors, your analysis logically predicts that a breakdown of $94,000 could result in a move toward $92,500.
Have you ever seen a Bitcoin YEAR chart ?Have you ever looked a t a Bitcoin YEAR chart ?
No > Here it is, from the start
So easy to see why people have finally realised it is worth holding on to.
For one year in every Four, it is in Loss.
The ONLY time that Loss retraced back Below the year before was in 2021 / 22 while the american TradFi and institutions despicably tried to destroy Bitcoin, and FAILED
Looking at the 2 ATH trendlines, if we continue this, we can expect a possible 400K next year
We will just have to wait and see
But I will settle for 400K ;-)
How about you ? I certainly Will NOT Sell all my BTC

BTCUSD 4 HR ANALYSIS | SHORT TRADE🚀 Bitcoin (BTC) Price Analysis - 4-Hour Timeframe 📊
Chart Overview:
Current Price: $96,935.44
Timeframe: 4-Hour chart
Date Published: December 20, 2024
Key Features:
Trend Channe l: The chart illustrates a red ascending channel that represents the previous upward trend in Bitcoin’s price.
Support and Resistance Levels:
Resistance Level : Identified at $99,612.38
Support Level : Identified at $89,438.39
Price Movement : Recently, there has been a significant price drop depicted on the chart.
Potential Drop: A green arrow indicates a potential price drop of 9.30%, equating to -$9,171.21.
Discussion Point : The chart poses the question, “Can Bitcoin drop 10% from next week (23 Dec 2024)? Comment what you think?
Analysis :
The ascending trend channel suggests that Bitcoin has been in an upward trend.
The recent price action shows a breach of this channel, hinting at a possible trend reversal.
Key support at $89,438.39 needs to be monitored, as a break below this level could confirm further downside.
The potential 9.30% drop indicates market uncertainty, potentially leading to a larger correction.
Conclusion: Monitor the key support and resistance levels closely. The breach of the ascending channel and the significant price drop could suggest a trend reversal, warranting caution for bullish positions. Stay tuned for updates as we approach the critical date of December 23, 2024.
Note - This is Only for education purpose.
Follow and give Like

BTC - Buy BTC is in Bullish trend and is in loudspeaker chart pattern. Price is at over sold zone and lower side of the loudspeaker pattern. Even if price drops its good to go long in Bitcoin. If traded in derivatives have enough margin to hold longs in case of any spikes.

$BTC READY TO BOINCEBitcoin is currently bouncing off the $95,000 support level. It has entered the oversold zone and formed a bullish divergence. Based on this, there are three possible scenarios:
1. Bullish Scenario: Bitcoin could retest the $100,000 resistance level. If it successfully breaks this level, there's a strong possibility of further movement toward the $104,000 resistance.
2. Bearish Scenario: Bitcoin may retrace to test the major support at $94,000 or potentially form a double bottom at this level.

UPDATE - Rates Rises and Cuts since 2021 and effect on BTC PAThere it is, the entire effect of FED Rate Cuts, Effects on influential companies and banks and the unstoppable RISE of Bitcoin to Corporate recognition and Adoption and the arrival of ETF's
And now, with a more Global acceptance of Crypto, whats next ?
what is certain is how BTC is gaining on GOLD's previous title as the Safe haven and Stor of Value
The BTCXAUT ( Gold) chart shows this rise as it has begun, ready to take over >
Currently, ONE BTC = 39 ounces of Gold, down slightly from the 42
Over 100 is expected by 2030 at the very latest
It is simply Bad financial advice to suggest people SELL Bitcoin.

Bitcoin Next Target 107,000 USD, Expected Trendline Breakout Bitcoin definitely going to reach the Trendline, so the Target is around 107,000 USD or more. And Expected Breakout above the Trendline.
I want to help People Make Profit all over the World.
My Bitcoin Navigation :
1. Reached 0.5 Fibonacci Retracement.
2. Breakout the Channel Pattern.
3. Reached Channel Top Target.
