Bitcoin Long-Term Monthly Chart: Parabolic Advance Meets DistribMacro Trend
Bitcoin is still in a long-term bullish structure. Each cycle shows higher highs and higher lows since inception.
The move from ~20k to ~90k happened in very few monthly candles, which signals a parabolic phase rather than healthy trend growth.
2. Current Candle Structure
The most recent candles show:
Large bullish impulse followed by
Strong rejection wicks and consecutive red monthly candles
This usually indicates profit-taking and distribution, not immediate trend continuation.
3. Volatility & Momentum
The current red candle (~-10%) after a blow-off green candle suggests:
Momentum is cooling
Buyers are no longer in full control
Historically, after similar structures (2013, 2017, 2021), BTC entered extended consolidation or deep pullbacks.
4. Volume Insight
Volume peaked during the explosive green candles and is now declining, which often means:
Smart money already positioned
Late buyers are absorbing supply
5. Key Levels to Watch
78k–80k: Current support (short-term)
60k–65k: Strong macro support (prior cycle top zone)
45k–50k: Extreme but historically reasonable retracement in bull cycles
6. Probable Scenarios
Base Case (Most Likely):
Sideways to downward consolidation over several months (range expansion).
Bull Continuation:
Needs a strong monthly close above prior highs with increasing volume.
Bearish Extension:
Loss of 60k opens the door for a deeper macro correction.
Btcusdsignals

BTCUSD – Key Level Rejection with Potential Liquidity Sweep TowaChart Analysis
1. Price Context
BTCUSD is trading around $90,675.
The chart shows price rejecting the Key Level and failing to hold above the Daily CLS (daily close level).
Recent candles indicate loss of bullish momentum with a series of lower highs forming.
2. Key Zones on Your Chart
🔴 Daily CLS (Resistance)
Marked in red.
Price tried to break and hold above this level but rejected, showing it is acting as strong overhead resistance.
The shaded gray area above looks like the stop-loss zone for shorts, suggesting a bearish setup.
🟢 Key Level
Marked slightly below the Daily CLS.
Price broke above it earlier but is now retesting from the top, failing to reclaim.
This retest-rejection pattern signals a shift from bullish to bearish sentiment.
3. Trade Bias Indicated by the Chart
Your marked zone suggests a short position setup:
Entry around current price or just under the Key Level.
Stop-loss in the gray shaded box above the Daily CLS.
Take Profit 1 at 50% CLS TP1, a midpoint liquidity target.
Final TP near the green support at the bottom.
This structure reflects a liquidity-based short setup, expecting:
A sweep of local highs → rejection → push down to fill inefficiencies or revisit liquidity pools below.
4. Market Structure
Price printed a strong move up earlier, leaving inefficiency below.
Now forming lower highs and lower lows on the lower timeframe.
Hold below Key Level suggests continuation downward.
5. Bearish Confirmation Signals
✔ Failure to hold above Daily CLS
✔ Break of Key Level and retest as resistance
✔ Weak bullish follow-through
✔ Liquidity target below at 50% CLS

BTC Wave 4 Bounce Looks Like a Trap! Is it?BTC is still moving inside a clear corrective channel, with the current bounce likely forming wave 4 before one final drop toward the 1.618 extension near 79,650 . The highlighted red zone shows a potential trap area where price may lure traders into thinking a reversal has started. Until BTC breaks above the channel convincingly, the broader structure still favors a wave 5 decline. The wave count from 1–2–3 supports this final leg down before any major recovery.
Stay Tuned!
@Money_Dictators

BTC/USD Bullish Pennant – Breakout Entry SetupBTC/USD Bullish Pe✅ BTC/USD Pennant Breakout – Technical Analysis
Chart Breakdown
The chart shows Bitcoin forming a bullish pennant pattern on the 45-min timeframe.
A pennant typically forms after a strong impulsive move (pole), followed by price compression between:
Descending trendline (upper)
Ascending/flat trendline (lower)
This usually signals continuation in the direction of the previous trend, which in this case is upward.
Key Levels
Entry Zone: Just above the pennant resistance (breakout zone).
Stop-Loss: Below the pennant support — good risk management.
Target: Projected by measuring the previous impulse (the pennant pole) and extending it upward.
Market Signals
✔ Price is squeezing near the apex — breakout imminent.
✔ Buyers appear to be defending the lower trendline.
✔ If price breaks and closes above resistance, upside continuation becomes likely.
✘ But if price rejects and falls below support, the setup invalidates.
Bias
Bullish Continuation – If breakout occurs with strong volume.

BTC/USD – FVG Buy Zone Setup Targeting $113K🔎 Chart Overview (BTC/USD 30m)
Price is currently trading at $110,517.
EMA 70 (111,276) above price → short-term bearish.
EMA 200 (110,598) acting as immediate support zone.
📐 Trend & Channel Strategy
Market is moving inside an ascending channel (support & projection line).
Price recently retraced to the support line → potential bullish continuation.
🎯 Supply & Demand / FVG Strategy
FVG Buying Zone: $109,583 – $110,217 highlighted (strong demand zone).
Entry around this zone expected to trigger a bullish reaction.
📊 EMA Crossover Strategy
EMA70 > EMA200 previously → bullish structure.
Current retest of EMA200 is key → holding above signals continuation to upside.
💎 Price Action Strategy
After strong drop, price tapped into support + FVG zone.
Wick rejection suggests buyers stepping in.
🎯 Target & Risk Management
Target Point: $113,053 – $113,064.
Stop Loss: Below $109,583 (to protect against breakdown).
Risk/Reward ratio looks favorable (approx. 1:3).
✅ Conclusion:
BTC is in an uptrend channel. After retesting the FVG buying zone & EMA200, buyers are likely to push price back toward $113,000 target 🚀📈. A break below $109,583 would invalidate this bullish setup.

BTC/USD Supply Zone Rejection SetupThis BTC/USD 30-min chart shows price climbing within a rising channel toward a POI Supply Zone (114,201 – 114,940 USD). The market is respecting both the support line and rejection line while trading above the EMA 70 (111,733) and EMA 200 (112,102), indicating bullish momentum in the short term.
Key Analysis Using Strategies:
Trend/EMA Strategy: Price is above both EMAs, signaling bullish continuation until the supply zone.
Channel Strategy: Price is moving inside an ascending channel; upper channel resistance aligns with the supply zone, suggesting potential reversal.
Supply & Demand: Strong supply zone at 114,201–114,940 is the key resistance area to watch for rejection.
Price Action: After breakout from EMA and minor consolidation, price shows bullish structure with higher highs and lows.
Risk Management: Possible short entry at supply zone (114,201–114,940) with stop-loss above 114,940, and targets near 112,100 and 109,000.
📌 Summary: Short-term bullish toward supply zone, but a potential bearish reversal setup forms at 114,201–114,940 if rejection occurs, with downside targets around 112,100 → 109,000.

USD Index (DXY) Bullish Reversal & Breakout PotentialUSD Index (DXY) Bullish Reversal & Breakout Potential 🚀
The DXY chart displays a strong bullish reversal structure from the support zone near the 99,800–100,200 area. Here’s a professional breakdown of the technical setup:
🔍 Key Observations:
🟢 Bullish Reversal Formation
The price rebounded aggressively from a strong demand zone (support), marked by a green arrow and orange highlight.
Multiple historical reaction zones confirm this level's validity as a reliable support.
📉 Previous Decline & Correction
After reaching the resistance area near 110.400, the price corrected with a bearish channel.
This pullback formed a classic bull flag, a bullish continuation pattern, eventually leading to the current breakout.
🟦 Current Price Action
The market has broken out of the recent downtrend and is forming higher highs and higher lows.
A strong bullish impulse candle confirms renewed buying interest.
🧱 Support & Resistance Levels:
🔵 Resistance Zone (Target): 110.409 — a historically respected area and target for the bullish move.
🟣 Current Support Zone: 105.061 — previously resistance, now likely to act as support after the breakout.
🎯 Bullish Target Projection
If price retests and holds the support at 105.061, the next potential leg can extend towards 110.409, offering a strong risk-to-reward setup.
⚠️ Caution
Watch for a pullback and retest near the support level.
A failure to hold above 105.061 could invalidate the bullish structure.
🧠 Conclusion
The DXY is showing a bullish trend continuation after a breakout from a corrective structure. A successful retest of support could propel price towards the 110.400 target zone 📊.
Bias: ✅ Bullish above 105.061
Invalidation: ❌ Below 105.000

BTCUSD SHOWING A GOOD DOWN MOVE WITH 1:10 RISK REWARD BTCUSD SHOWING A GOOD DOWN MOVE WITH 1:10 RISK REWARD
DUE TO THESE REASON
A. its following a rectangle pattern that stocked the market
which preventing the market to move any one direction now it trying to break the strong resistant lable
B. after the break of this rectangle it will boost the market potential for break
C. also its resisting from a strong neckline the neckline also got weeker ald the price is ready to break in the outer region
all of these reason are indicating the same thing its ready for breakout BREAKOUT trading are follws good risk reward
please dont use more than one percentage of your capital follow risk reward and tradeing rules
that will help you to to become a bettertrader
thank you

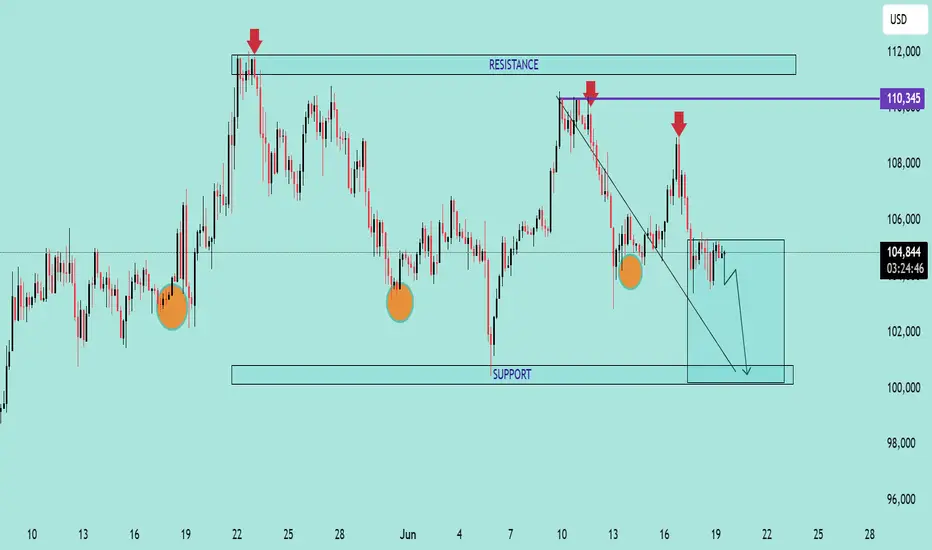
BTC/USD Bearish Outlook Analysis BTC/USD Bearish Outlook Analysis 📉🧠
📊 Technical Overview:
The BTC/USD chart is showing signs of a bearish structure formation, suggesting increased downside momentum in the short term.
🔻 Resistance Zone:
Clear resistance is identified near $110,345, marked by multiple price rejections (🔴 red arrows).
Price failed to break above this zone several times, indicating strong selling pressure.
🔸 Support Zone:
Strong support lies near the $100,000 psychological level.
Price has respected this zone multiple times (🟠 orange circles), indicating buyer interest.
📉 Current Price Action:
A descending trendline breakout attempt failed and price is now consolidating just below $105,000.
Price is forming a bearish flag/consolidation structure after recent rejection.
A breakdown from the current box range is likely to push BTC toward the support zone at $100,000.
📉 Bearish Scenario:
If BTC breaks below $104,000, expect continuation towards $100,000.
A daily candle close below support could signal further downside.
📈 Invalidation:
Bullish invalidation occurs if BTC reclaims and closes above $108,000, with volume, retesting resistance at $110,345.
🧭 Summary:
BTC/USD is exhibiting a lower highs structure within a descending channel. Unless it breaks above the resistance zone, the bias remains bearish with a high probability of retesting support.
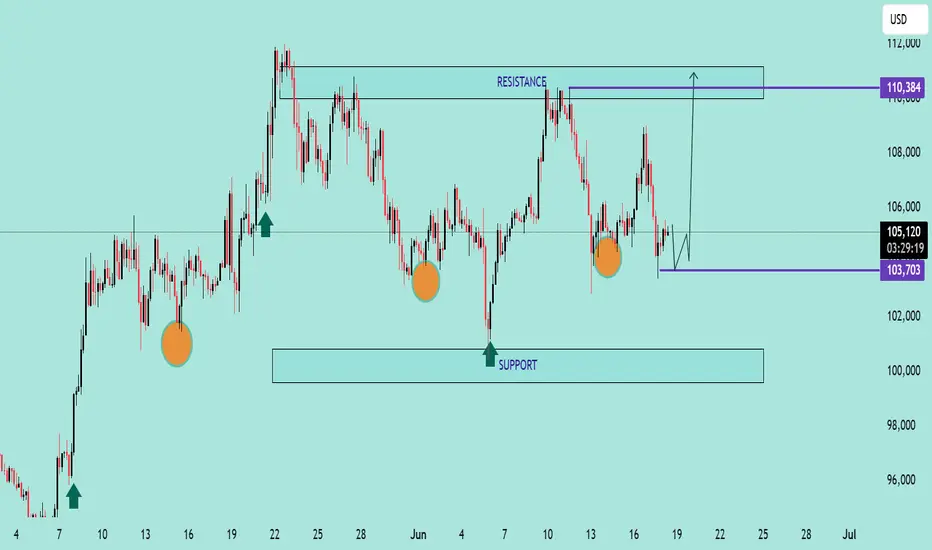
BTC/USD Potential Bullish ReversalBTC/USD Potential Bullish Reversal 🟢📈
🔍 Technical Overview:
The chart shows a potential bullish reversal pattern forming near a key support zone. Price action has consistently bounced from the support range between $100,000 – $103,700, marked by multiple higher lows (🟠 orange circles), suggesting strong buyer interest.
📌 Key Levels:
Support Zone: $100,000 – $103,700 🛡️
Immediate Resistance: $110,384 🔼
Current Price: $105,202 💰
📊 Pattern Observed:
The price structure shows a possible inverted head and shoulders pattern forming, with the right shoulder currently developing. If this structure completes and breaks the $106,000–$107,000 neckline region, we can expect a bullish breakout toward the resistance target of $110,384 or higher.
📈 Bullish Confirmation:
Bullish rejection from support area ✅
Clean structure with repeated higher lows 📈
Potential breakout arrow suggests move toward the top resistance zone
⚠️ Watch For:
Price must hold above $103,700 to maintain bullish bias
Break below this level may invalidate bullish setup and retest the broader support zone near $100,000
📌 Conclusion:
BTC/USD is setting up for a potential upside breakout if the neckline is broken. Traders should monitor for bullish confirmation before entering long positions.
🔔 Strategy Suggestion:
Buy Zone: $103,700 – $104,500 (on bullish confirmation) 🛒
Target Zone: $110,000 – $111,000 🎯
Stop-Loss: Below $103,000 🛑
BTC/USDT 4H Analysis – Bullish Cup Formation 📈 BTC/USDT 4H Analysis – Bullish Cup Formation ☕🚀
🔍 Chart Overview:
The 4-hour chart of Bitcoin against USDT on Binance displays a clear "Cup" pattern, suggesting a strong bullish continuation setup. The price action reflects a rounded bottom forming after hitting a solid support zone.
🟣 Key Zones:
🔻 Support Zone: ~$101,000–$103,000
Strong buying interest was observed here with a sharp wick rejection, forming the bottom of the cup.
🔺 Resistance Zone: ~$110,000–$112,000
This area has acted as a historical rejection zone and now stands as the next major target for bulls.
📊 Technical Insights:
The price is gradually curving upward, respecting the rounded cup pattern, often a precursor to a breakout.
A clean break above the resistance zone may trigger continuation toward new highs, possibly above $112,000.
The price is currently at ~$107,700 and gaining momentum with higher lows forming consistently.
🎯 Price Projection:
📌 Target: $111,500–$112,000
📉 Invalidation: Break below the $103,000 support
💡 Conclusion:
If the bullish momentum continues and breaks past resistance, we can expect a powerful upside breakout. Traders should watch for volume confirmation near the resistance zone for potential entry or breakout trades.
📍Pattern in Play: Cup Formation
⚠️Watch for pullbacks before breakout attempts.

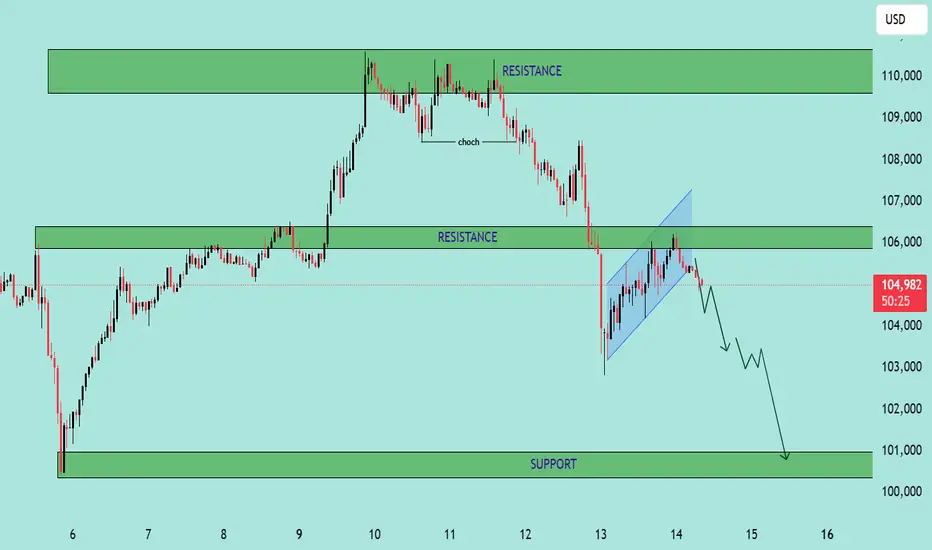
BTC/USD – Bearish Continuation from Rising Channel BTC/USD – Bearish Continuation from Rising Channel 🚨🧱
This chart indicates a bearish market structure with the following key technical features:
🔍 Chart Analysis:
Change of Character (CHoCH) 🔄
A shift from bullish to bearish was confirmed by a strong breakdown after the CHoCH marked at the top.
This breakdown invalidated previous bullish structure.
Bearish Flag Formation 📉📐
After the impulsive drop, price formed a bearish flag (rising channel), suggesting a potential continuation move to the downside.
Resistance Rejection 🚫
Price is currently testing and rejecting the 105,800–106,500 resistance zone, previously a support turned resistance.
The rejection from this level adds further bearish confluence.
Downside Projection ⬇️📍
If the pattern plays out, the projected move shows a potential drop toward the major support zone at 100,000–101,000.
📌 Key Levels:
Resistance Zones:
105,800–106,500 🧱
109,500–111,000 🧱
Support Zone:
100,000–101,000 💚
🧠 Conclusion:
The chart suggests that BTC/USD is in a bearish continuation phase, with strong rejection from key resistance and a confirmed breakdown from a bearish flag. Traders should watch for confirmation of continuation below 104,500 to target the 100k support level. Risk management is crucial near volatile zones.
Technical Analysis – BTC/USD Technical Analysis – BTC/USD
📅 Date: June 11, 2025
🔍 Key Observations:
🔴 Resistance Zone – $110,000 to $111,800
Price has tested this resistance block twice (🔴 red arrows) and rejected both times, indicating strong selling pressure in this zone.
Rejection candles show long upper wicks, suggesting failed attempts by bulls to break above.
🟢 Support Zone – $101,800 to $103,500
This demand zone has been respected multiple times (🟢 green arrows), showing a solid base for potential bounces.
Price action previously rallied strongly after touching this level.
📦 Supply to Demand Play
Price made a sharp bullish move from support to resistance (📘 blue box shows the impulsive move).
After reaching resistance, the price is failing to break above, indicating possible exhaustion of bullish momentum.
📉 Potential Move:
🔽 Short-Term Bearish Bias
If price fails to hold current levels and breaks below the small consolidation (after blue box), we may see a drop to ~$105,583 (🔵 purple line = key level).
If that breaks, next likely destination is the support zone around $102,000 (⬇️ downward arrow path).
⚠️ Risk Notes:
🔁 Watch for any false breakouts or liquidity grabs above resistance.
📉 If bearish momentum increases below $105,583, sellers may take control in the short term.
✅ Trade Idea (Hypothetical):
Sell/Short near resistance (⚠️ confirmation needed like bearish engulfing or failed breakout)
Target 1: $105,583
Target 2: $102,000 zone
Stop-loss: Above $111,800 (invalidates setup)
📌 Summary:
BTC/USD is currently stuck between a well-defined resistance and support range. Unless bulls break above $111,800 with strong momentum, the structure favors a potential pullback toward the demand zone. ⚖️

BTCUSDT Trade Analysis📊 BTCUSDT Trade Analysis
Previous Move (Sell)
✅ Sell executed successfully – target reached (🎯).
📈 New Trade Setup (Buy)
💡 Current Plan:
Switching to buy now as the market has reached the previous sell target.
New Target:
Next major resistance area near 111,025 – 111,072 USDT range (🟩 target box at the top).
📍 Key Levels:
Entry Zone: Above 105,000 USDT mini-resistance area (🟧 mini-resistance box).
Support: Around 102,999 USDT (blue support line).
Current Target (Buy):
Target zone: 111,025 – 111,072 USDT.
📌 Trade Plan Summary
Entry: Above 105,000 mini-resistance area break.
Target Point: 111,025 – 111,072 USDT 🟩.
Stop Loss: Suggested below 102,999 USDT to limit downside (🔴 red zone).
🎯 Conclusion:
🔵 Target for the buy move is well-defined and positioned above current resistance levels.
🟢 Awaiting price action above mini-resistance area for a safe entry for the next bullish leg!

BTCUSD SHOWING A GOOD DOWN MOVE WITH 1:15 RISK REWARD BTCUSD SHOWING A GOOD DOWN MOVE WITH 1:15 RISK REWARD
DUE TO THESE REASON
A. its following a rectangle pattern that stocked the market
which preventing the market to move any one direction now it trying to break the strong resistant lable
B. after the break of this rectangle it will boost the market potential for break
C. also its resisting from a strong neckline the neckline also got weeker ald the price is ready to break in the outer region
all of these reason are indicating the same thing its ready for breakout BREAKOUT trading are follws good risk reward
please dont use more than one percentage of your capitalfollow risk reward and tradeing rules
that will help you to to become a bettertrader
thank you
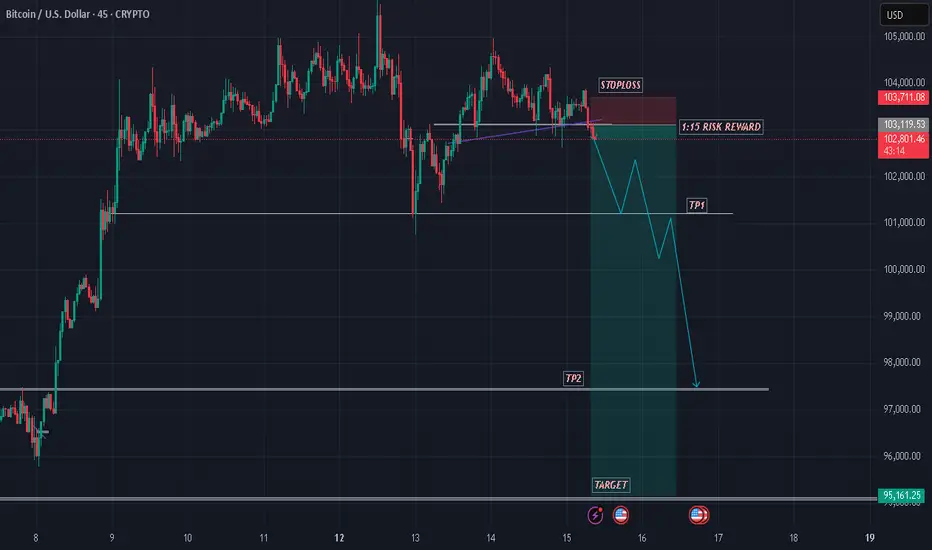
"BTC/USD Short from 104,855 – Target 93,159. Entry Point
104,855 USD is marked as the entry point (likely for a short position).
The current price is around 103,775 USD, slightly below the entry level.
2. Resistance Zone
Highlighted just below the entry point (~103,000–104,855 USD).
Price is currently testing this zone, possibly indicating a failed breakout or pullback setup.
3. Stop Loss
Placed around 104,807 USD, just above the resistance area, in a shaded purple zone.
Suggests the trade strategy is based on shorting near resistance with a tight stop.
4. Target
EA Target Point is marked at 93,159 USD.
Implies a projected downward move of about −11,264 USD (−10.76%) from entry.
5. Indicators & Tools Used
Moving Averages: 200-period (blue) and a shorter MA (red), showing bullish momentum.
Support/Resistance Zones: Multiple purple rectangles denote demand/supply areas.
Trend Lines: Used to capture recent bullish momentum; a break of the lower line may confirm a trend reversal.
6. Pattern Recognition
Series of lower highs forming after a strong uptrend could suggest bearish divergence or distribution phase.
The price appears to be stalling at the resistance area, aligning with a potential short setup.
🧾 Trade Setup Analysis:
Bias: Bearish (short position).
Entry: 104,855
Stop Loss: 104,807 (tight SL above resistance zone)
Take Profit: 93,159
Risk-Reward Ratio (RRR): Roughly 1:10, which is aggressive and would require high conviction or confirmation

Bitcoin 4H Technical Analysis Bullish Continuation Toward $111kCurrent Price Context:
BTC/USD: $103,696.63
EMA (70): $96,211.07
Trend: Bullish 📈
---
Key Zones & Analysis:
1. RBR Zone (Demand Zone) 💙
Price Range: $95,435.39 – $97,986.81
This area is a bullish support zone where price previously consolidated before the breakout.
Potential entry/buy zone 📍
If price pulls back: Bounce expected here 🔁
🟦 RBR Zone:
🔵 97,986.81
🔵 96,211.07 (EMA support)
🔵 95,435.39
---
2. Resistance / Short-Term Supply 🟥
Small blue box above current price
May cause a minor rejection before a breakout
Keep an eye out for price action signals here 👀
🟥 Resistance:
🟥 ~103,700 – 105,000
---
3. Target Zone 🎯
Main Target Point: $111,415.32
Target Range: $111,281.04 – $112,959.60
If price breaks above resistance, this is the next major target
Take profit zone 💰
🎯 Target Area:
🔵 111,281.04
🔵 111,415.32
🔵 112,959.60
---
Possible Price Path:
1. 🔼 Break above current resistance
2. 🔁 Or pull back to RBR zone
3. 🎯 Final move toward target zone

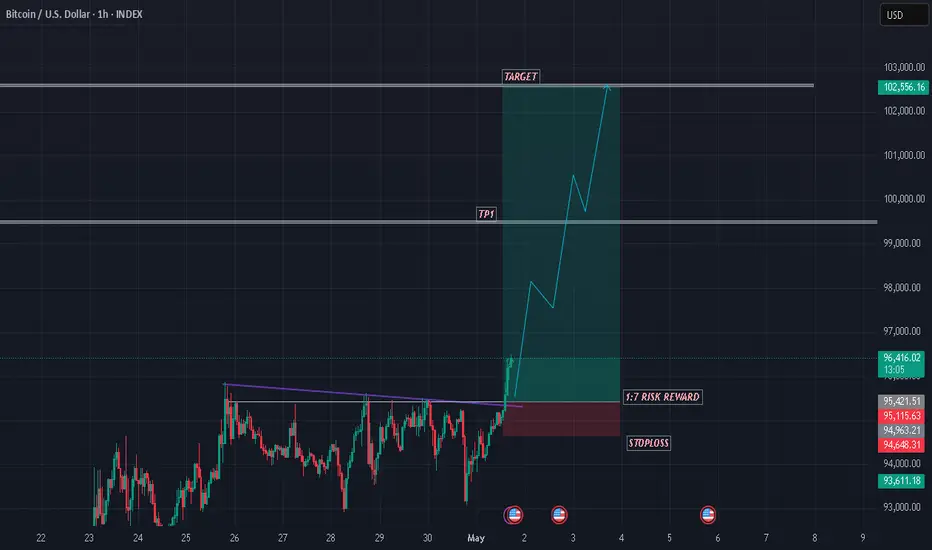
BTC/USD 4H Chart Setup – Bullish Breakout Targeting $104K1. Trend Direction
⬆️ Uptrend Detected
* Price is forming higher highs and higher lows
* Trading inside a bullish channel
* Breakout potential above the top trendline.
2. Key Zones
🟦 Support Zone: $95,252.31
* Labeled as RBS + RBR ZONE
* Strong buy area → previous resistance turned support
* Perfect area to catch a bounce
📏 Support Line & Trendline
* Trendline keeps price supported along the climb
* Acts as a launch pad for the next move.
3. EMA 70 (📉 Red Line)
* Current value: $93,636.88
* Price is above EMA, showing strong bullish pressure
* EMA acts as dynamic support.
4. Trade Setup
🎯 Target Point: $104,000
🟦 Target Zone: $103,918.60 – $104,747.91
🔥 Entry Zone: $95,252.31 (marked blue box)
⚠️ Stop Loss: $94,091.28
* Positioned safely below support
* Good Risk/Reward Ratio.
5. Extra Cues
📅 Economic event icons near May 3–6 → Potential volatility ahead
⚡ Pullback in progress → May offer a buying opportunity.
Conclusion
🚀 Bullish Setup!
* Watch for a bounce from the blue demand zone
* Targeting $104K breakout
* Strong support + momentum = solid long opportunity.

BTCUSD SHOWING A GOOD UP MOVE WITH 1:10 RISK REWARD BTCUSD SHOWING A GOOD
UP MOVE WITH 1:10 RISK REWARD
DUE TO THESE REASON
A. its following a rectangle pattern that stocked the market
which preventing the market to move any one direction now it trying to break the strong resistant lable
B. after the break of this rectangle it will boost the market potential for break
C. also its resisting from a strong neckline the neckline also got weeker ald the price is ready to break in the outer region
all of these reason are indicating the same thing its ready for breakout BREAKOUT trading are follws good risk reward
please dont use more than one percentage of your capitalfollow risk reward and tradeing rules
that will help you to to become a bettertrader
thank you
BTCUSD 1H SHORT SET UP WITH 1:2 RRHello traders, here in BTC after giving good upside rally btc is forming double top formation Trend is strong uptrend still we will try to catch this short setup if it's works my previous set ups works perfectly let's see what happens in this one as well 😉
For shorting one can see if 1h candle close below 92400 with SL 94700 and tp zone of 87000-89000 range. Set is valid only if 1h candle close below 92400 lvl otherwise trade is invalid. Hence wait for the closing. If sl is too big than one can enter at retest if btc come upside.
Have a great weekend 👍🤗

BTC/USD 1H – Bullish Breakout with FVG Entry & $91K TargetChart Breakdown:
📈 Trend Structure:
BTC is moving in an ascending channel with:
🔵 Resistance Line on top
🟢 Support Line below
🔁 Recently, it broke out above the resistance with a bullish move!
Key Zones & Levels:
🟦 Fair Value Gap (FVG)
This is your potential buy zone:
✅ Entry Point: $86,135
❌ Stop Loss: $85,098
🎯 Target: $91,000
📌 Plan:
Wait for price to retrace into the FVG zone
Look for a bullish bounce ✅
Enter long at $86,135
Set your SL and target accordingly
Risk-Reward Setup:
Risk: Small (below FVG zone) ❗
Reward: Big upside toward $91,000 🚀
Gain Potential: +5.74% ($4,948 per BTC)
Visual Flow:
1️⃣ Price breaks resistance 🔼
2️⃣ Pullback expected to FVG 🔽
3️⃣ Entry triggers around $86,135
4️⃣ Targeting moon shot to $91K 🌕
Conclusion:
This setup shows a bullish continuation with solid RR.
If BTC holds the FVG on a retest, the move to $91K looks likely!

Bitcoin Bearish Reversal Setup: Rising Wedge Breakdown Targeting1. Entry Point:
Marked around $86,853, this is where a potential short (sell) trade might have been initiated.
2. Stop Loss:
Placed above $88,783, protecting the trade in case the market goes against the position.
3. Target Point (Take Profit):
Aiming down toward $74,443.76, suggesting a large bearish move is anticipated.
4. EMA Indicators:
30 EMA (Red Line) at ~$84,271: Indicates short-term trend.
200 EMA (Blue Line) at ~$83,496: Indicates long-term trend.
Price is currently trading above the 200 EMA but slightly below the 30 EMA, showing mixed short-term momentum.

BTC/USD Short Setup – Triple Top Reversal with EMA Confirmation Entry Point (Sell): Around $85,699.52
Stop Loss: $86,741.44 (above resistance zone)
Target (Take Profit): $82,982.09
This provides a Risk-Reward Ratio of approximately 1:2, a commonly acceptable ratio in trading.
📈 Indicators:
EMA 30 (Red) is currently above the EMA 200 (Blue), indicating bullish momentum—but this setup anticipates a trend reversal.
If price breaks below the EMAs, that would confirm bearish strength.
🧠 Conclusion:
This setup is based on:
A strong resistance zone,
Bearish reversal pattern (triple top),
Risk management via stop loss and take profit levels.
If you're trading this:
Wait for confirmation with a bearish candlestick below the EMAs or a break of recent support.
Manage position size based on stop distance and your account risk tolerance.
