Bitcoin Daily Breakout – Trend Reversal in Play?BTCUSD | Breakout Alert!
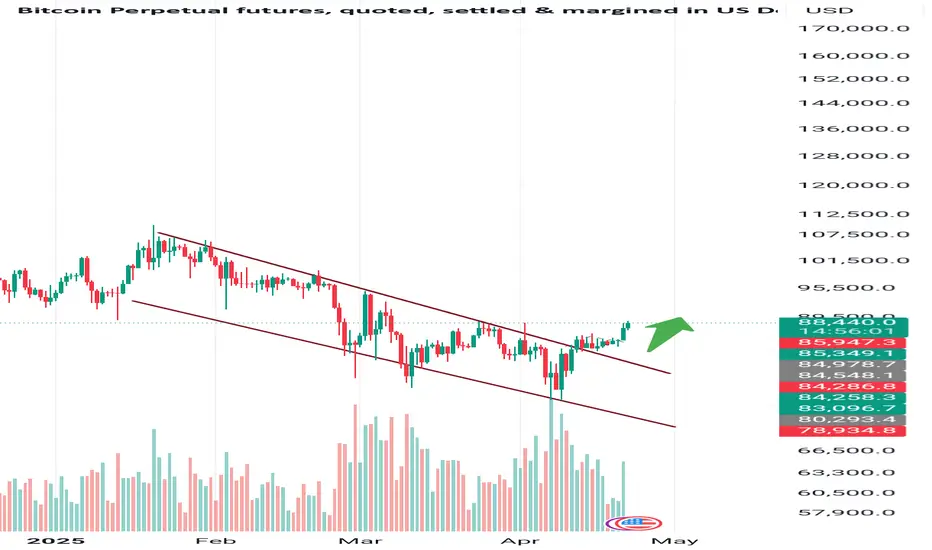
Bitcoin has been trading within a downward channel on the daily chart, but today it has finally broken out to the upside with strong momentum. This breakout could signal the beginning of a bullish move. If the breakout sustains above key resistance levels, BTC has significant potential to move higher in the coming days. Keep an eye on the volume and price action for confirmation.
Targets & Key Levels:
Next Target: 110000++
Support: 80000
Stay cautious and manage your risk accordingly!
#BTCUSD #Bitcoin #CryptoBreakout #TechnicalAnalysis #CryptoTrading #BTC #CryptoCharts #BullishBreakout #PriceAction #TradingView
BTCUSDT
BTCUSD READY TO FLY 4200 POINTS 84830 TO 89000+++BTCUSD strong zone above only 84830
There is no resistance upto 89000
Wait for active mode
Buy above 84830................
Stoploss..........................84400....430 points
Target1..........................87000.....2170 points
Target2..........................89000.....4170+ points
Disclaimer - This level only for education purpose . Do ur own analysis

Will Bitcoin Hit $1 Million in Future?Everyone’s Scared of #Bitcoin Red Candles... I see Opportunity.
1⃣ This ain’t just a dip — it’s a Discounted future begging to be Grabbed.
2⃣ My Chart will Age like fine wine 🍷
3⃣ Buy fear. Stack smart.
4⃣ In a few years, You'll wish you did.
Let the smart money eat. 🚀
NFA & DYOR

BTC: Quiet... but Ready to Explode?Bitcoin’s sideways grind has tested everyone’s patience — but don’t let the silence fool you. Tight consolidation like this often leads to powerful breakouts. And right now, BTC looks like it’s charging up.
📊 Technical Outlook:
BTC is sitting on strong support at 81K–83K, a level that’s sparked multiple rebounds before.
Price action has broken out of the downtrend channel and is now forming a classic accumulation box — textbook setup for an upside move.
EMAs (34 & 89) are tightening, signaling incoming volatility.
Breakout above resistance could open the door to 94K, a key untested zone.
🌐 Macro & Sentiment:
Big money is on standby after the recent crypto shakeout.
Spot Bitcoin ETFs are seeing renewed inflows after weeks of outflows.
With global interest rates cooling off, risk-on assets like BTC are back on the radar.
Trade Plan to Consider:
Look for long setups around 81K–83K support if strong bullish candles confirm
🎯 Targets: 87K → 94K
❌ Stop loss below 79K to protect your position
The breakout may not be loud — but it’s coming. The only question is… will you catch it?

BTCUSD READY TO FLY 3500 POINTS..CHECK IT WORLD CLASS ACCURACY??BTCUSD strong zone above only 85550
there is no resistance upto 89000..3500++ point
wait for active mode
Buy above 85550
Stoploss.............84600......950 points
Target1.............87000........1500 points
Target2.............89000++......3500 points
Disclaimer - This level only for education purpose . Do ur own analysis
Magic Indicator - private only script ( any one want 1 week demo for dm me in tradingview. Sent ur username )

BTCUSD READY TO 1800 POINTS FALL CHANCE BTCUSD if break below 84810
there is no suport upto 83000
curent mkt price 84990
Wait for active zone
Sell below ...............84810
Stoploss...................85150...........340 points
Target1...................84150..........660 points
Target2...................83000...........1800 points
Disclaimer - This level only for education purpose.. Do ur own analysis

BTC/USD 1H Chart Analysis – Bearish Setup with SBR Rejection🔵 Key Zones & Levels:
🔷 SBR Zone (Support ➡ Resistance):
Price Range: ~$81,000–$83,000
🛑 Stop Loss: $83,002.31 (Just above resistance)
Expecting sellers to step in here if price retests this level
🟠 Mid-Range Zone:
Current price is consolidating just below SBR zone
Could form a lower high before dropping
🟦 Target Zone (Support Area):
🎯 Target Price: ~$75,000
Previous demand area – price bounced hard from here before
🔁 Trade Plan:
📉 Bias: Bearish
📍 Entry: Near current price or after retest of SBR zone
🛑 Stop Loss: $83,002.31
🎯 Target: $75,000 (approx -8.33%)
✅ Summary:
Risk-Reward: Appears solid (R:R > 2:1)
🕵️♂️ Watch for: Fakeouts or rejections in the SBR zone
🔻 Potential Move: -6,804 points if plan plays out

BTC/USD) Bullish reversal analysis Read The ChaptianSMC Trading point update
This is a bullish reversal analysis on BTC/USD (Bitcoin to USD) on the 4-hour chart, suggesting a potential long opportunity after a sharp corrective move.
---
Key Breakdown of the Chart:
1. Strong Downward Move with Potential Reversal:
Bitcoin experienced a sharp drop from the 88k region to ~74,387.50, now hitting a key demand zone (marked as "Orderblock").
2. Bullish Reaction Expected:
From the Orderblock support zone, a bullish reversal is anticipated.
The projected move aims to fill the imbalance and test the target zone between 87,152.94 and 88,557.14.
3. RSI Oversold:
RSI is around 32.27, indicating oversold conditions and adding confluence for a potential bounce.
4. EMA (200):
The 200 EMA lies around 85,153.85, which may act as dynamic resistance on the way up.
Mr SMC Trading point
5. Price Target:
The expected upside move is approximately +13,722.85 points (+18.75%), aiming for the supply zone above 87k.
---
Conclusion / Trade Idea:
Entry Zone: Near 74,387.50, the orderblock/demand area.
Target Zone: 87,152.94 – 88,557.14
Bias: Bullish short- to mid-term reversal.
Confluences: Oversold RSI, clean support zone, potential trendline bounce, and price inefficiency above.
---
Pales support boost 🚀 analysis follow)

BITCOIN BULLISH POTENTIALPrice has entered the discount zone near a weak low, signaling a potential reversal as smart money may be accumulating after a liquidity sweep. This area often serves as a launchpad for bullish moves, especially when sell-side liquidity has been taken.
Short-term sentiment is shifting bullish, suggesting momentum could be building for a move upward. With key bearish targets already met, the downward pressure may be fading, setting the stage for a corrective move or full reversal.
If bullish structure forms—such as a break of structure or a bullish order block holding—price could begin climbing toward equilibrium and possibly into premium territory. Look for confirmation through price action and volume shifts.

BITCOIN MAY DROP TO 74K - BEARISH STRUCTURE INTACTSymbol - BTCUSD
CMP - 84600
BTCUSD is undergoing a shift in market structure, transitioning into a bearish phase following the breakdown at 90K. A deeper correction is currently developing, which, in my view, represents a logical and technically sound progression for a healthy market. It is concerning when the market only experiences upward movement driven solely by buying pressure, such as in the case of large-scale injections of funds into high-yield investment programs (HYIPs).
A correction in Bitcoin’s price or even a trend reversal could inject vitality back into the market. From a fundamental perspective, traders have not seen the expected active support for cryptocurrencies from the US, which was previously suggested during Trump's election campaign. Additionally, issues such as crypto exchange hacks, fraudulent coins, and Bitcoin's dominance are exerting negative pressure on altcoins.
Bitcoin’s current downturn, with the possibility of a further drop to the 75K-73K range, could present an opportunity for fundamentally strong altcoins, assuming the declining Bitcoin dominance index also continues to trend downward. The simultaneous reallocation of funds from Bitcoin to altcoins, along with a rebound in Bitcoin from a strong support level, could rejuvenate the prospects for an altcoin season.
Resistance levels: 88150, 90700
Support levels: 75000, 73570, 66830
A modest retracement towards the 88100 to 90700 range is possible before the price begins its descent. While Bitcoin may attempt a deeper pullback, the current market imbalance, coupled with the absence of a clear driving force or supportive factors, suggests that the price may continue to fall in the medium term, potentially reaching the liquidity zone between 75K and 73K

Bitcoin Technical Analysis Bear/Bull Market- Bitcoin is currently trading at $74,452, down 32% from its ATH.
- Bitcoin is facing a significant sell-off along with major world indices due to the tariff war between the US and China and other powerhouses.
- This widespread selling will stabilize once it leads to the absorption of all bears, and eventually, we will see sideways action followed by an upward expansion.
- The important areas to monitor are the highlighted circles; the first one marks the origin of the move, while the second contains a fair value gap that has not yet been mitigated.
- From a Spot buyer perspective I would like to see either of the two paths playing out
- Manage risk until then
- Buying Zones: 60-63,000$ & 67,000-71,000$

BITCOIN - LIKELIHOOD OF A SHORT SQUEEZE BEFORE A DOWNWARD SLIDESymbol - BTCUSD
CMP - 84540
BTCUSD continues to exhibit a bearish trend after breaking the bullish structure on the weekly timeframe. There are no discernible bullish drivers at present, and from a technical standpoint, the price is poised to approach the imbalance zone between 75K and 73K.
Recent events, such as the crypto summit and discussions surrounding crypto asset support, have failed to provide substantial backing for the market. These events have historically been followed by further market declines.
From a technical perspective, the market remains in a downtrend, indicative of a global counter-trend. This suggests that the current price movement is contrary to broader market sentiment, which aligns with typical market behavior. On a general scale, key zones of interest include 75K, 73K, and the order block between 69K and 66K.
On a more specific level, attention should be given to the nearest liquidity zones at the higher levels, which may be tested prior to any further declines. These levels are located at 86,697 and 89,397
Key Resistance levels: 85135, 86678, 89397
Key Support levels: 79987, 78173, 73512
Following the false break of the 78K support level, there has been no significant market reaction. The market appears to be consolidating within the 84-85K range, which suggests a weakening of buying interest. Prior to any further downward movement, there may be a short squeeze within the identified liquidity zones, potentially leading to an additional decline.

QUICKUSDT - FALSE BREAKOUT OF RESISTANCESymbol - QUICKUSDT
CMP - 0.0290
QUICKUSDT is currently exhibiting a counter-trend move toward the resistance level within the range of 0.0295, A false breakdown of this key level has occurred amidst the prevailing downtrend.
The cryptocurrency market is undergoing a period of significant challenges. While Bitcoin is testing new lows around 77K, altcoins are continuing their downward trajectory in search of additional support levels. Notably, QUICKUSDT stands out by testing a strong resistance/liquidity zone between 0.0284 and 0.0295, where a false breakout is forming.
However, in the morning session, Bitcoin shows signs of strengthening after a substantial decline, potentially exerting upward pressure on the broader market. As such, prior to any further decline, there may be another attempt to retest the 0.0295 level or update the false breakout tail around 0.0300 (0.7 Fibonacci retracement)
Key resistance levels: 0.0285, 0.0295, 0.0300
Key support levels: 0.0243, 0.0211
Should the next resistance retest result in a false breakdown with price consolidation below 0.0295, QUICK coin could continue its decline in the short to medium term.

BTCUSD READY TO FLY 1450 POINTS UPSIDE POSSIBLEBTCUSD strong zone above only 82940
There is no resistance upto 84400...
wait for active zone
Buy above 82940
Stoploss 82700...........240 points
Target1.............83200.....260 points
Target2..............83400.....460 points
Target3.... Risk...84400.......1460 points
Disclaimer - This level only for education and papertrade purpose. Do ur own analysis

Is Bitcoin on the Verge of a Massive Breakout?Bitcoin's wave ((4)) has successfully completed a W-X-Y corrective formation. If Bitcoin manages to decisively break above the key resistance level of 88,826, it could trigger a powerful impulsive rally, potentially driving prices toward the next major targets at 95,250 - 99,508 - 109,176.
Additionally, the parallel channel's lower trendline is offering substantial support, preventing further downside movement. A strong breakout above this channel could significantly enhance bullish momentum, increasing the probability of Bitcoin reaching new all-time highs. We will update you soon!

BTCUSD READY TO FLY 1400 POINTS ..ONESIDE UP CHANCE Btcusd strong zone above 82400
strong above 82400 there is no resistance upto 83800
wait for active mode
Buy above 82400
Stoploss.......81950....450 points
Target1........83000....600 points
Target2........83800.....1400 points
Disclaimer- This level only for educational purpose only . Do ur own analysis

BTCUSD STRONG ABOVE 81776 TARGET 440 POINTSBTCUSD STRONG ZONE ABOVE ONLY 81776... there is no resistance upto 82215
wait for active
buy above 81776
stoploss 81530
Target1.......81950...
Target2.......82215....440 points
Disclaimer - This level only for education purpose only

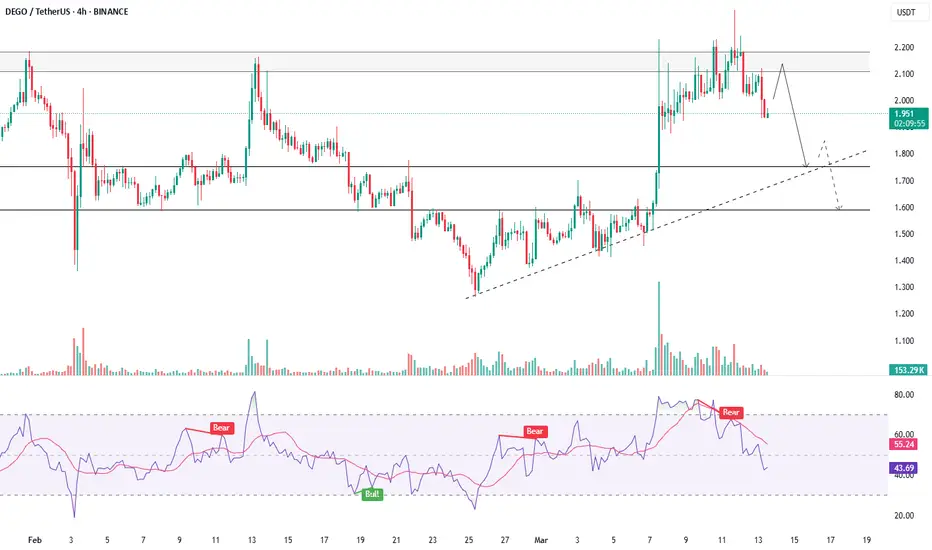
DEGOUSDT - SHORT BIAS AMID WEAK CRYPTO MARKET CONDITIONSSymbol - DEGOUSDT
CMP - 1.970
DEGOUSDT attempted to break its prevailing trend but encountered significant resistance and was further impacted by a weak cryptocurrency market. The downward movement may persist.
Following the breakout from the descending channel's resistance, a bullish momentum of 45% was established. However, the price faced strong resistance between 2.110 and 2.180, resulting in the formation of a trading range. Sellers are determined to maintain control over this zone and exert pressure. After a prolonged battle for this level, a false breakout of resistance occurred, leading to liquidation when the 2.000 support level was breached. Buyers are now in a state of panic. Should the price remain below the 2.110 - 2.180 range, a further decline in the short to medium term is likely.
Resistance Levels: 2.000, 2.180, 2.274
Support Levels: 1.750, 1.584, 1.359
The overall market remains weak, with altcoins reacting strongly to Bitcoin's short-term fluctuations. This behavior suggests that the market is accumulating liquidity in anticipation of a further decline. Bitcoin has yet to reach its key target, and the absence of a bullish catalyst continue to place downward pressure on altcoins.
BTCUSD 1000 POINTS CHANCE UP STRONG ABOVE 83640 TO 84640BTCUSD strong above only 83640
current mkt price 84110
waiting for active
Buy above 83640
Stoploss 83175...465 points
Target 84640.....1000 points
Disclaimer - This level only for education purpose and paper trade . Do ur own analysis

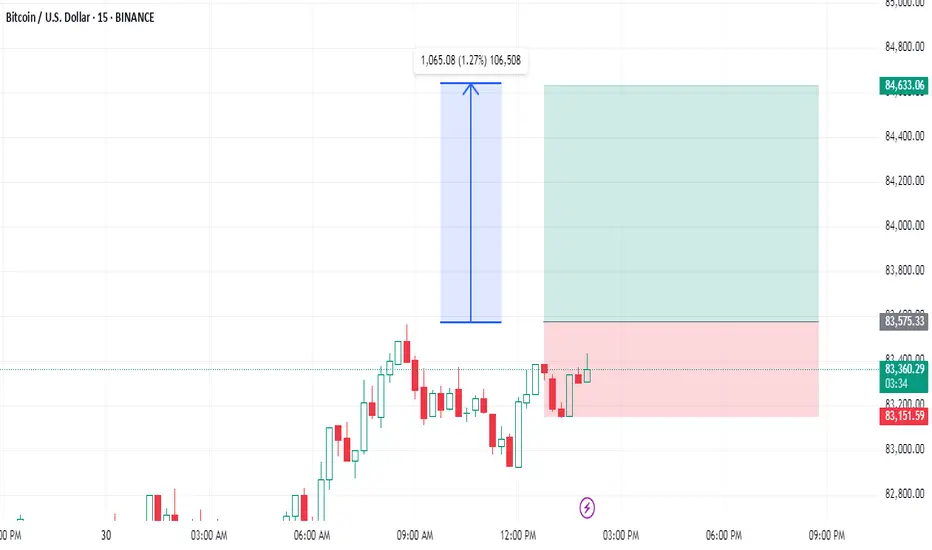
BTCUSD READY TO FLY 1060 POINTS CHANCE TO SPIKE ONESIDEBTCUSD STRONG ABOVE 83575 ONLY
current mkt price 83384
Wait for Active
Buy above 83575
Stoploss .............83150......425 points
Target 1060 points
Risk reward 2:5 ratio
Disclaimer - This level only for education purpose and papertrade only. Do ur own analysis
Khuyến nghị giao dịch ETH/USDT(15p): BUY 1830-1835ETH/USDT Trading Recommendation
Optimal Entry Zone: 1,830 – 1,835
Target Take Profit: 1,900
Stop Loss: 1,809
Risk-to-Reward Ratio: ~2.5R (Optimized profit/risk)
Analysis & Outlook:
ETH is in a recovery phase after a strong correction. The price structure indicates:
✅ Strong support around 1,830 – 1,835, where accumulation is evident.
✅ Short-term uptrend with price maintaining above the ascending trendline.
✅ Nearest resistance: 1,900, where price may react before the next move.
Trading Strategy:
Prefer to wait for a pullback to 1,830 – 1,835 before entering a long position.
Strict risk management with stop loss at 1,809 to protect capital.
Expecting ETH to reach 1,900 in the short term, with potential continuation toward 2,050 next week if bullish momentum persists.
🚀 Follow me for more high-probability trading opportunities! 🚀

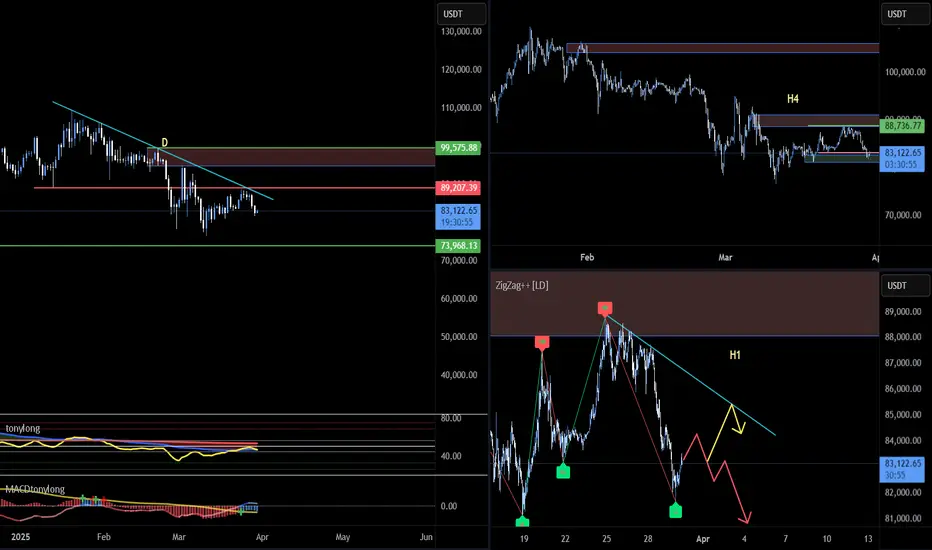
BTC23: BTC falls again. Testing support or finding a new bottom?📊 BINANCE:BTCUSD continued to decrease again in the past 2 days. Let's evaluate and look for opportunities through the multi-timeframe perspective below BINANCE:BTCUSDT :
🔹 **D Frame**: Before the price decrease in the past 2 days, we can see that although BTC had a recovery phase before, the fake decrease structure has not been broken yet.
🔹 **H4 Frame**: The keylever zone has been broken as marked on the chart, however, this is the first decrease after the increase wave in the past days, so it will need clearer confirmation.
🔹 **H1 Frame**: Currently, the price is reacting to the support zone of 81~83k. However, the price is still in a downward wave if looking at the price structure.
🚀 **Trading plan:*
📌 At the present time, we can look for a SELL position in line with the main trend in diagonal resistance areas to look for a trading position in line with the main trend. The current price is at an important support area, so it is no longer suitable to SELL at this time. BUYing in this area is not recommended when the downtrend has not shown any signs of ending. We will have to wait for a clearer signal from the price structure to properly assess the effect of the current support area.
💪 **Wishing you success in making a profit!**
BTCUSD Buy setup Bitcoin (BTC) - A Brief Description
Bitcoin (BTC) is the world's first and most widely recognized cryptocurrency. It was created in 2009 by an anonymous person or group known as Satoshi Nakamoto. Bitcoin operates on a decentralized, peer-to-peer network using blockchain technology, which ensures transparency, security, and immutability of transactions.
Unlike traditional currencies issued by governments (fiat money), Bitcoin is not controlled by any central authority such as banks or governments. Instead, it is maintained by a distributed network of computers (nodes) through a process called mining, where transactions are verified and recorded on the blockchain.
Key Features of Bitcoin:
1. Decentralization – No single entity controls Bitcoin.
2. Limited Supply – Only 21 million BTC will ever exist, making it scarce.
3. Security – Uses cryptographic techniques to ensure safe transactions.
4. Transparency – Transactions are recorded on a public ledger (blockchain).
5. Fast and Borderless Transactions – Can be sent anywhere in the world without intermediaries.
6. Store of Value – Often referred to as "digital gold" due to its potential as a hedge against inflation.
Bitcoin is widely used for investment, trading, and online payments, and it has influenced the creation of thousands of other cryptocurrencies.
