Wave 4 Trap Complete as Bitcoin Prepares for Final Flush6 Days Ago
3 Days Ago
1 December 2025 :
BTC moved into the expected corrective zone last week but stayed inside the falling channel, showing that wave 4 was only a temporary bounce. Buyers failed to break any key resistance, and momentum kept fading. This kept the broader outlook bearish and hinted that wave 5 was still pending.
BTC has now broken below the short-term rising structure, confirming that wave 4 topped out near the 0.786 retracement. The rejection from that zone triggered a clean shift back into the main downtrend, with price sliding toward the key 86,280 support. As long as BTC holds below the upper channel boundary, the market remains positioned for further downside, with the 1.618 extension around 79,650 emerging as the next probable target for wave 5 completion.
Note:
The rejection from the 0.786–resistance zone shows buyers failed to take control.
Wave B at 86,280 is the immediate pivot level; staying below it keeps downside pressure intact.
The next major target for wave 5 sits near the 1.618 extension around 79,650.
Stay Tuned :)
@Money_Dictators
BTCUSDTPERP

BTCUSDT Price Action Analysis: Buy/Sell Zones, SL/TP, and Market1. Overall Trend
Your chart shows short-term bullish momentum inside a larger descending structure
(you have drawn a falling wedge / descending channel top).
👉 Short-term: bullish – strong impulsive green candle breaking through multiple intraday levels.
👉 Higher timeframe: bearish resistance overhead – price is approaching the major trendline.
🟢 2. Buy Zones (Bullish Setups)
BUY AREA #1 – Retest of 0.382 / 0.50 Fib Zone (~$90,000–$91,200)
Your strong bullish candle started from this zone.
A pullback back into this demand area = ideal entry.
Why Buy:
Bullish impulse → correction → continuation
Clear demand zone (multiple rejections)
Confluence with your ascending black trendline
Previous consolidation + liquidity grab
Entry:
→ $90,500–$91,200
SL:
→ Below $89,800 (last swing low)
TP1: $92,400
TP2: $93,700
TP3: $94,500 (1.0 Fib + supply zone)
BUY AREA #2 – Break & Retest of $92,465
If price breaks above $92,465 and retests, bullish continuation likely.
Why Buy:
Break of structure (BOS)
Retest of resistance turned support
Strong bullish pressure in previous candle
Entry: After retest & bullish candle confirmation.
SL: Below $92,000
TP: $93,800 / $94,500
🔴 3. Sell Zones (Bearish Setups)
SELL AREA #1 – Major Resistance $93,700–$94,550
Price is currently inside this zone (your dotted blue horizontal line + Fib 1.0).
This is a strong sell zone because:
Why Sell:
Major resistance + 1.0 Fibonacci
Intersection with descending trendline
Previous supply zone
Impulsive move → likely to retrace
Entry:
→ Bearish rejection candle on resistance
(HR wick + small body)
SL:
→ Above $94,800
TP1: $92,400
TP2: $91,200
TP3: $89,800
SELL AREA #2 – Break Below $89,800
If price breaks this key support, we will see strong downside.
Why Sell:
Break of structure
Loss of bullish demand
Below trendline
Entry: Retest of $89,800 from below
SL: Above $90,200
TP: $88,000 / $87,700 liquidity zone
⚠️ 4. No-Trade Zones
Avoid trading in these areas:
NO TRADE ZONE #1 – Between $91,200 and $92,400
Why?
Choppy range
No clear direction
Middle of structure
Poor risk-reward
NO TRADE ZONE #2 – Inside the triangle squeeze before breakout
Price often becomes unpredictable inside a wedge apex.
Wait for break → retest → trade.
📝 5. Summary (Quick Guide)
🟢 BUY
✔ Retest of $90,500–$91,200
✔ Break & retest of $92,465
🔴 SELL
✔ Rejection from $93,700–$94,550
✔ Break & retest of $89,800
🛑 NO TRADE
⚠ Between $91,200–$92,400
⚠ Inside wedge compression area

PRICE ACTION ANALYSIS OF YOUR CHART (BTCUSDT)PRICE ACTION ANALYSIS OF YOUR CHART (BTCUSDT)
🟢 BUY SETUP (Bullish Scenario)
1️⃣ BUY ENTRY #1 — Break & Retest of 92,240 – 92,500 Zone
This zone is a major resistance.
A breakout above it confirms strong bullish momentum.
📌 ENTRY
Buy: 92,300 – 92,450
(After a breakout + retest candle, not inside consolidation)
📌 STOP LOSS (SL)
SL below retest zone: 91,700
📌 TAKE PROFIT (TP)
TP1 → 94,000 – 94,200
TP2 → 95,800
TP3 → 97,100
📌 PRICE ACTION REASON
Structure break above major resistance
Trendline break confirmation
Higher-high formation
Large liquidity zone above (clean traffic)
2️⃣ BUY ENTRY #2 — Pullback Into 90,300 Support
Your chart shows a horizontal blue line near 90,300–90,130.
📌 ENTRY
Buy at: 90,300 – 90,150
(Wait for bullish rejection wick)
📌 STOP LOSS
SL below structure: 89,800
📌 TAKE PROFIT
TP1 → 91,200
TP2 → 92,300
TP3 → 94,000
📌 PRICE ACTION REASON
Support formed around previous accumulation zone
Fake-out followed by impulse up (bullish sign)
Price respecting trendline + horizontal support
🔴 SELL SETUP (Bearish Scenario)
The red arrows on your chart highlight bearish continuation levels.
1️⃣ SELL ENTRY #1 — Break & Retest of 89,200 Zone (Major Level)
Price repeatedly reacts to this purple level → strong liquidity.
📌 ENTRY
Sell at: 89,200 – 89,100
(After bearish retest rejection)
📌 STOP LOSS
SL above level: 89,500
📌 TAKE PROFIT
TP1 → 88,200
TP2 → 87,000
TP3 → 86,700 (trendline bottom)
📌 PRICE ACTION REASON
Loss of support → becoming resistance
Bearish market structure (lower highs)
Clean traffic to downside (no strong support until next purple line)
2️⃣ SELL ENTRY #2 — Pullback to 90,300 Becomes Resistance
If the 90,300 level breaks DOWN, it becomes a good sell zone on retest.
📌 ENTRY
Sell at: 90,200–90,350
(Only if retested as resistance)
📌 STOP LOSS
SL: 90,700
📌 TAKE PROFIT
TP1 → 89,200
TP2 → 88,200
TP3 → 87,000
📌 PRICE ACTION REASON
Role reversal: support → resistance
Continuation in bearish channel
Lower-high formation
🟡 NO-TRADE ZONE
Avoid trading inside the black descending channel mid-area, especially around:
❌ 90,800 – 91,400
Because:
Price is choppy
Weak volume area
No clean structure
High chance of fake breakouts
Wait for clear breakout or breakdown.

BTCUSD If Btc breaks below red line then chances are high it could test below support level white line at 92000 and 88000
Disclaimer:
It's a personal view not a financial advice and I assume no responsibility and liability whatever outcome arises.

BTCUSDT SHORT I was sitting in Short after a good bearish candle formed at resistance with very good volume, i just took 1:2 and i was out of the trade.
Logic :- Price was too stretched and bears were gaining control, bulls were trapped
But still the trend is bullish for me, lets see 🚀
Happy profits 🥂 enjoy guys, sorry i didn’t posted this trade earlier
LIKE AND FOLLOW FOR MORE TRADE IDEAS

BTCUSD – Short Opportunity Building 30m Chart1. Price rejected from the supply zone near 115,700–115,800, showing resistance.
2. Current structure has shifted bearish with lower highs after rejection.
3. Key intraday support stands at 115,100–115,000; a sustained break below could accelerate downside.
4. Next demand levels to watch: 114,280 and 114,116, aligning with liquidity zones.
📉 Plan:
Short entries remain valid below 115,300.
First target: 114,280
Extended target: 114,116
Invalidation above 115,800.
Recommendation: Monitor for clean bearish continuation; keep risk tight due to BTC volatility.

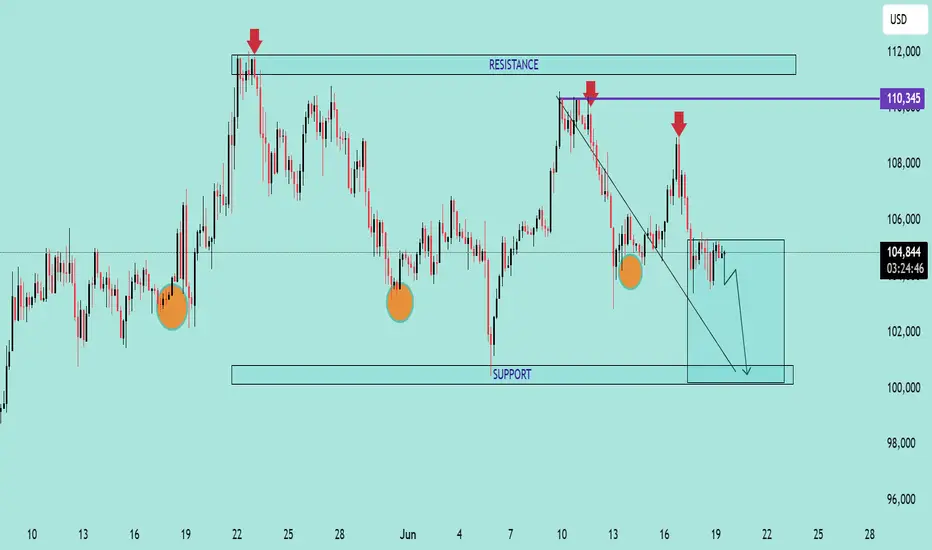
BTC/USD Bearish Outlook Analysis BTC/USD Bearish Outlook Analysis 📉🧠
📊 Technical Overview:
The BTC/USD chart is showing signs of a bearish structure formation, suggesting increased downside momentum in the short term.
🔻 Resistance Zone:
Clear resistance is identified near $110,345, marked by multiple price rejections (🔴 red arrows).
Price failed to break above this zone several times, indicating strong selling pressure.
🔸 Support Zone:
Strong support lies near the $100,000 psychological level.
Price has respected this zone multiple times (🟠 orange circles), indicating buyer interest.
📉 Current Price Action:
A descending trendline breakout attempt failed and price is now consolidating just below $105,000.
Price is forming a bearish flag/consolidation structure after recent rejection.
A breakdown from the current box range is likely to push BTC toward the support zone at $100,000.
📉 Bearish Scenario:
If BTC breaks below $104,000, expect continuation towards $100,000.
A daily candle close below support could signal further downside.
📈 Invalidation:
Bullish invalidation occurs if BTC reclaims and closes above $108,000, with volume, retesting resistance at $110,345.
🧭 Summary:
BTC/USD is exhibiting a lower highs structure within a descending channel. Unless it breaks above the resistance zone, the bias remains bearish with a high probability of retesting support.
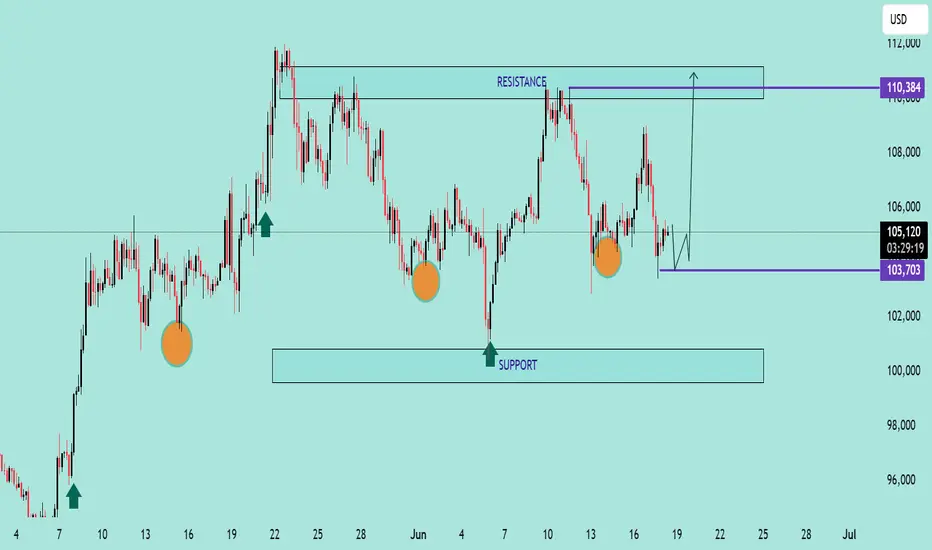
BTC/USD Potential Bullish ReversalBTC/USD Potential Bullish Reversal 🟢📈
🔍 Technical Overview:
The chart shows a potential bullish reversal pattern forming near a key support zone. Price action has consistently bounced from the support range between $100,000 – $103,700, marked by multiple higher lows (🟠 orange circles), suggesting strong buyer interest.
📌 Key Levels:
Support Zone: $100,000 – $103,700 🛡️
Immediate Resistance: $110,384 🔼
Current Price: $105,202 💰
📊 Pattern Observed:
The price structure shows a possible inverted head and shoulders pattern forming, with the right shoulder currently developing. If this structure completes and breaks the $106,000–$107,000 neckline region, we can expect a bullish breakout toward the resistance target of $110,384 or higher.
📈 Bullish Confirmation:
Bullish rejection from support area ✅
Clean structure with repeated higher lows 📈
Potential breakout arrow suggests move toward the top resistance zone
⚠️ Watch For:
Price must hold above $103,700 to maintain bullish bias
Break below this level may invalidate bullish setup and retest the broader support zone near $100,000
📌 Conclusion:
BTC/USD is setting up for a potential upside breakout if the neckline is broken. Traders should monitor for bullish confirmation before entering long positions.
🔔 Strategy Suggestion:
Buy Zone: $103,700 – $104,500 (on bullish confirmation) 🛒
Target Zone: $110,000 – $111,000 🎯
Stop-Loss: Below $103,000 🛑
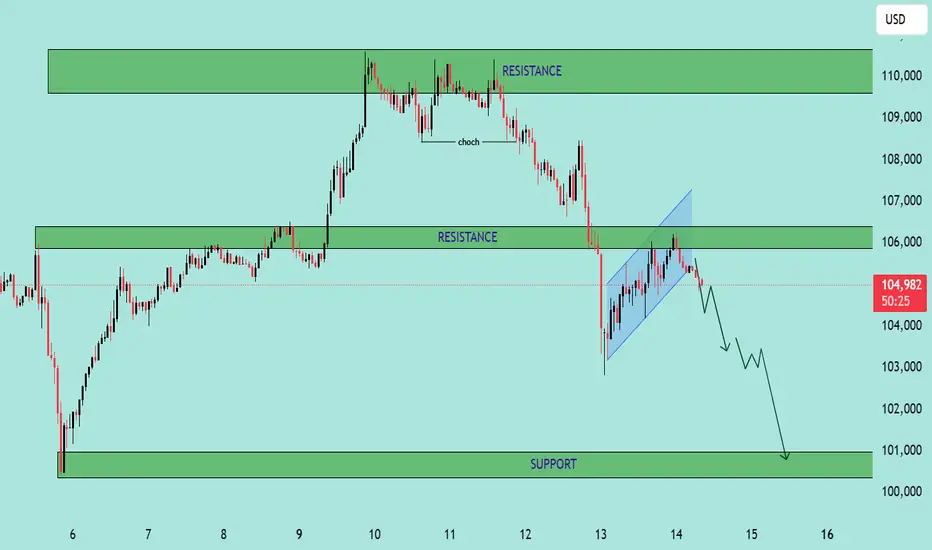
BTC/USD – Bearish Continuation from Rising Channel BTC/USD – Bearish Continuation from Rising Channel 🚨🧱
This chart indicates a bearish market structure with the following key technical features:
🔍 Chart Analysis:
Change of Character (CHoCH) 🔄
A shift from bullish to bearish was confirmed by a strong breakdown after the CHoCH marked at the top.
This breakdown invalidated previous bullish structure.
Bearish Flag Formation 📉📐
After the impulsive drop, price formed a bearish flag (rising channel), suggesting a potential continuation move to the downside.
Resistance Rejection 🚫
Price is currently testing and rejecting the 105,800–106,500 resistance zone, previously a support turned resistance.
The rejection from this level adds further bearish confluence.
Downside Projection ⬇️📍
If the pattern plays out, the projected move shows a potential drop toward the major support zone at 100,000–101,000.
📌 Key Levels:
Resistance Zones:
105,800–106,500 🧱
109,500–111,000 🧱
Support Zone:
100,000–101,000 💚
🧠 Conclusion:
The chart suggests that BTC/USD is in a bearish continuation phase, with strong rejection from key resistance and a confirmed breakdown from a bearish flag. Traders should watch for confirmation of continuation below 104,500 to target the 100k support level. Risk management is crucial near volatile zones.
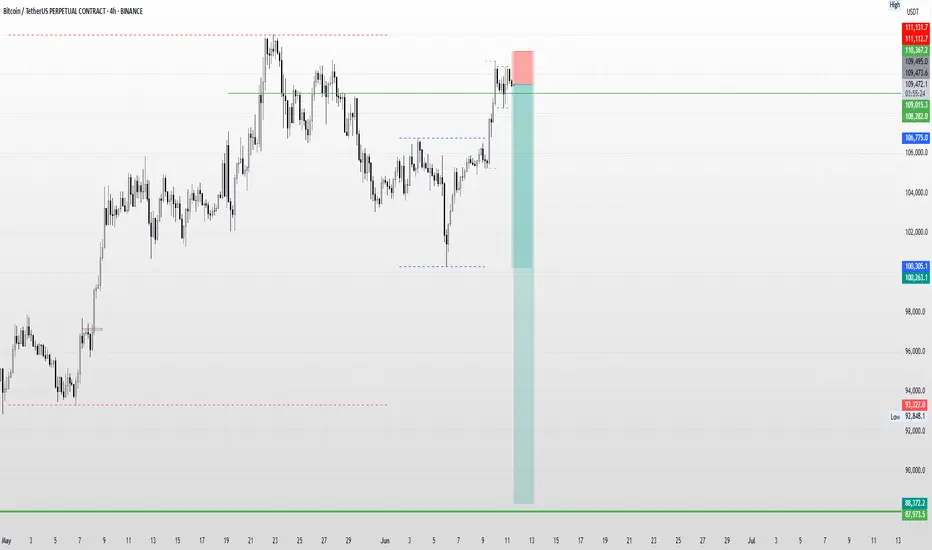
Danger Ahead? Bearish Signal Spotted on the Daily Timeframe!Price Action Analysis (Daily & Intraday)
A bearish pattern has formed on the Daily Timeframe, and early signs of execution are visible on the 1-hour chart, indicating a potential Double Top formation. If confirmed, the price may drop with an initial target around 100263. Should the bearish momentum continue, the next significant weekly support could be tested near 88372.
Caution:
This setup is considered risky, primarily because the higher timeframe (Monthly) still shows an overall uptrend. However, with a well-defined stop-loss above 16367 and proper risk management, the trade could offer a favorable risk-to-reward ratio.
Disclaimer:
Trading, especially in futures and options, involves a high degree of risk. Losses can exceed capital if not managed properly. This is not financial advice. Please do your own analysis or consult a certified financial advisor before making any investment decisions.
Technical Analysis – BTC/USD Technical Analysis – BTC/USD
📅 Date: June 11, 2025
🔍 Key Observations:
🔴 Resistance Zone – $110,000 to $111,800
Price has tested this resistance block twice (🔴 red arrows) and rejected both times, indicating strong selling pressure in this zone.
Rejection candles show long upper wicks, suggesting failed attempts by bulls to break above.
🟢 Support Zone – $101,800 to $103,500
This demand zone has been respected multiple times (🟢 green arrows), showing a solid base for potential bounces.
Price action previously rallied strongly after touching this level.
📦 Supply to Demand Play
Price made a sharp bullish move from support to resistance (📘 blue box shows the impulsive move).
After reaching resistance, the price is failing to break above, indicating possible exhaustion of bullish momentum.
📉 Potential Move:
🔽 Short-Term Bearish Bias
If price fails to hold current levels and breaks below the small consolidation (after blue box), we may see a drop to ~$105,583 (🔵 purple line = key level).
If that breaks, next likely destination is the support zone around $102,000 (⬇️ downward arrow path).
⚠️ Risk Notes:
🔁 Watch for any false breakouts or liquidity grabs above resistance.
📉 If bearish momentum increases below $105,583, sellers may take control in the short term.
✅ Trade Idea (Hypothetical):
Sell/Short near resistance (⚠️ confirmation needed like bearish engulfing or failed breakout)
Target 1: $105,583
Target 2: $102,000 zone
Stop-loss: Above $111,800 (invalidates setup)
📌 Summary:
BTC/USD is currently stuck between a well-defined resistance and support range. Unless bulls break above $111,800 with strong momentum, the structure favors a potential pullback toward the demand zone. ⚖️

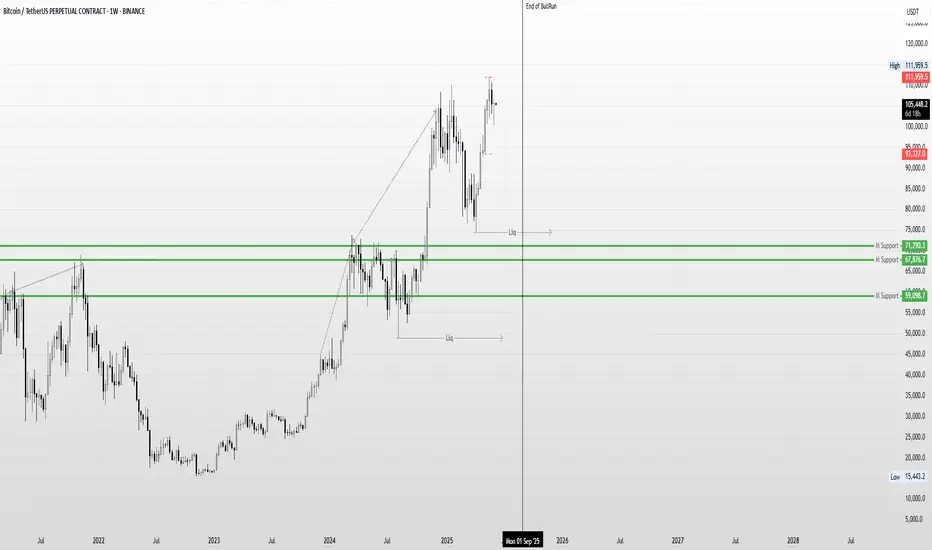
Bitcoin Weekly Analysis: Potential Exhaustion in Price ActionWhile Bitcoin continues to form Higher Highs on the Weekly Time Frame, the overall price action appears to be gradually losing momentum. From my perspective, this could be an early sign of exhaustion, suggesting that the current bullish trend may be nearing its end.
If this weakening momentum continues, there's a possibility that a broader correction or even the beginning of a bear market could unfold post-September. In such a scenario, the market may attempt to hunt significant downside liquidity levels, potentially targeting zones around $74,000 and even as low as $48,000.
Of course, this is purely a personal prediction based on current price structure and market behavior. Only time will reveal how accurate this outlook turns out to be.
Disclaimer :
This content is for informational and educational purposes only and does not constitute financial or investment advice. The views expressed are based on personal analysis and should not be considered as a recommendation to buy, sell, or hold any asset. Cryptocurrency markets are highly volatile, and past performance is not indicative of future results. Always do your own research (DYOR) and consult with a licensed financial advisor before making any investment decisions.
BTCUSD LONG? QUICK REVERSAL SET UP WITH 1:2 RRHello traders, BTCUSD has fall more and came near the previous support zone we will try to capture small reversal trade here, buy BTCUSD if 15min candle close above 103150 our trade will be only valid if it's give closing above that lvl this is advance trade set up so wait for the trade to activate.
BUY BTCUSD ABOVE 103150(15MIN CANDLE CLOSE ABOVE THIS LVL)
SL:-102048
TP:-105500/107000 ZONE
HAVE A GREAT DAY

bitcoin zonecould this pink line act as a mirror? Can we perhaps range sideways in this region for a while and then shoot up eventually? It appears it can happen. These prices are uncharted waters so nothing can be said for certain. But we can hope for the best. Perhaps while bitcoin ranges there will be an eth season

"BTC/USD Short from 104,855 – Target 93,159. Entry Point
104,855 USD is marked as the entry point (likely for a short position).
The current price is around 103,775 USD, slightly below the entry level.
2. Resistance Zone
Highlighted just below the entry point (~103,000–104,855 USD).
Price is currently testing this zone, possibly indicating a failed breakout or pullback setup.
3. Stop Loss
Placed around 104,807 USD, just above the resistance area, in a shaded purple zone.
Suggests the trade strategy is based on shorting near resistance with a tight stop.
4. Target
EA Target Point is marked at 93,159 USD.
Implies a projected downward move of about −11,264 USD (−10.76%) from entry.
5. Indicators & Tools Used
Moving Averages: 200-period (blue) and a shorter MA (red), showing bullish momentum.
Support/Resistance Zones: Multiple purple rectangles denote demand/supply areas.
Trend Lines: Used to capture recent bullish momentum; a break of the lower line may confirm a trend reversal.
6. Pattern Recognition
Series of lower highs forming after a strong uptrend could suggest bearish divergence or distribution phase.
The price appears to be stalling at the resistance area, aligning with a potential short setup.
🧾 Trade Setup Analysis:
Bias: Bearish (short position).
Entry: 104,855
Stop Loss: 104,807 (tight SL above resistance zone)
Take Profit: 93,159
Risk-Reward Ratio (RRR): Roughly 1:10, which is aggressive and would require high conviction or confirmation

Bitcoin (BTC) Technical Outlook – Caution Advised for Retail Tra🪙 Bitcoin (BTC) Technical Outlook – Caution Advised for Retail Traders
The broader market structure for BTC remains bullish, no doubt. However, on the daily timeframe, we’ve observed a clear bearish move, indicating potential short-term weakness.
Key Resistance Levels to Watch:
First Resistance: 102,851
Second Resistance: 103,665
Both of these levels could act as potential zones for a sell-off, especially if BTC shows signs of exhaustion near these zones. If price reacts bearishly here, we could see a corrective move towards the 96,466 level, which serves as a reasonable downside target.
Important Scenario to Monitor:
If the market attempts a liquidity hunt above the second resistance at 103,665, the situation could get tricky. While this might look like a breakout, it may not sustain bearish momentum beyond that level — indicating market indecision or a possible trap.
⚠️ Final Note for Retail Traders:
BTC is currently creating confusion, and retail traders should exercise extra caution. The market might visually appear to be setting up for a sell, but could quickly reverse, shaking out early entries. Avoid trading emotionally and wait for clear confirmation before entering positions.
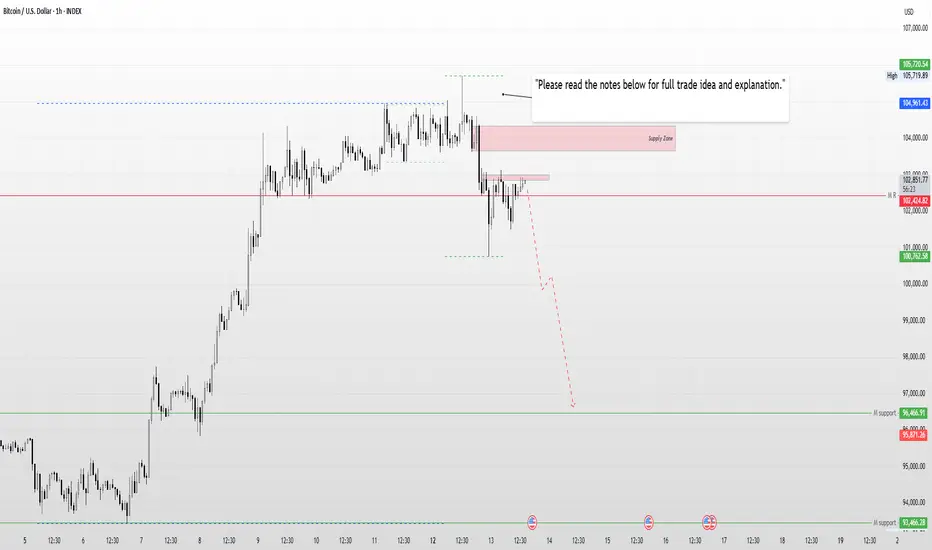
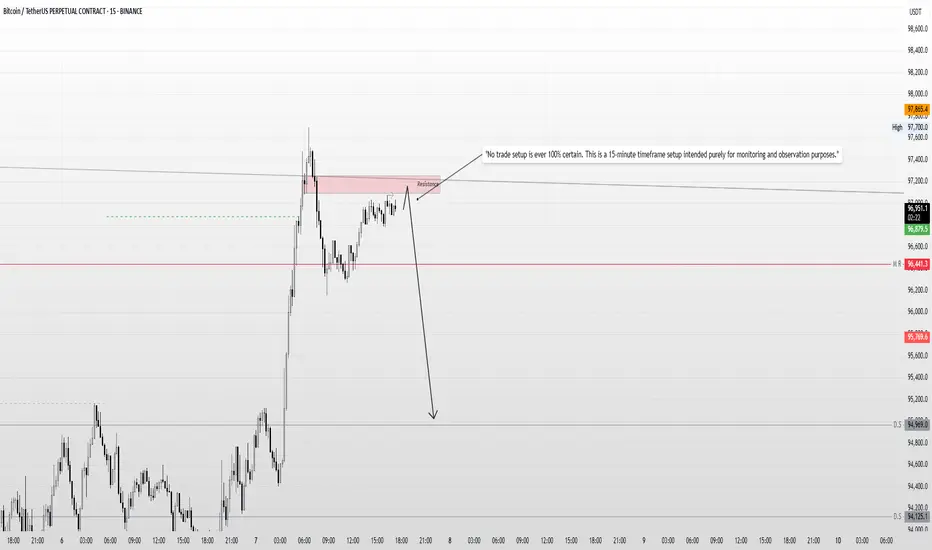
Bitcoin Intraday Bias – Liquidity Sweep & Rejection Setup"Intraday Setup: I anticipate that during the New York open, the market may sweep the liquidity around 97078, reject from the resistance zone, and potentially move lower."
"No trade setup is ever 100% certain. This is a 15-minute timeframe setup intended purely for monitoring and observation purposes."
Disclaimer: This is not financial advice. The analysis shared is for educational and informational purposes only. Please conduct your own research and consult with a licensed financial advisor before making any trading decisions. Trading involves significant risk and may not be suitable for all investors.
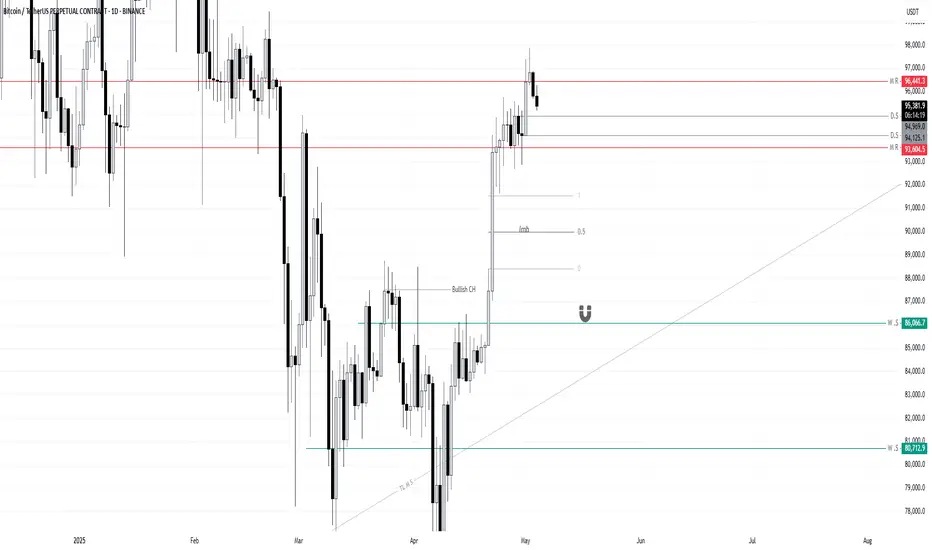
Bitcoin OutLook for Next Week BTCUSDT.pMarket Outlook (BTC/USD):
I’m currently observing the ₹94,125 level on the daily timeframe. A daily candle close below this level would significantly increase the probability of Bitcoin retracing toward the imbalance zone around ₹90,000.
However, there is a key demand zone near ₹86,000, which could act as a strong support and potentially push the market back upward. This area will be crucial in determining whether the bearish momentum continues or a reversal is triggered.
Let’s see how the market reacts around the ₹94,125 level. I’ll post the next update after Monday’s daily candle closes.
Thank you for your continued support — it's truly appreciated.
Bitcoin Wyckoff Distribution pattern Disclaimer: This is not financial advice. The following is for educational and informational purposes only.
Based on the current 1-hour timeframe, Bitcoin appears to be forming a potential Wyckoff Distribution pattern. If we see a liquidity sweep towards the upside—particularly around the 95,580 to 95,763 levels—and a subsequent bearish confirmation pattern forms on the same timeframe, we could anticipate a possible move down towards the 93,000 support zone.
Should the price fail to hold at that level, a deeper correction towards the 86,000 area could play out in the coming sessions. However, it is important to note that this scenario is valid only if a clear bearish structure forms post-liquidity sweep on the 1-hour chart.
No strategy guarantees 100% accuracy, and market conditions can change rapidly. This is merely a technical outlook and should not be construed as an investment or trading recommendation.

Bitcoin Bearish Reversal Setup: Rising Wedge Breakdown Targeting1. Entry Point:
Marked around $86,853, this is where a potential short (sell) trade might have been initiated.
2. Stop Loss:
Placed above $88,783, protecting the trade in case the market goes against the position.
3. Target Point (Take Profit):
Aiming down toward $74,443.76, suggesting a large bearish move is anticipated.
4. EMA Indicators:
30 EMA (Red Line) at ~$84,271: Indicates short-term trend.
200 EMA (Blue Line) at ~$83,496: Indicates long-term trend.
Price is currently trading above the 200 EMA but slightly below the 30 EMA, showing mixed short-term momentum.

BTC/USD) breakout up trand analysis Read The ChaptianMr SMC Trading point update
bullish analysis of Bitcoin (BTC/USD) on the 4-hour timeframe, showing a potential breakout and rally scenario. breakdown:
---
1. Market Structure:
Downtrend Channel: Price has been moving within a falling channel.
Double Bottom Pattern: Marked by two green arrows — a bullish reversal signal.
Breakout Attempt: Price is testing the upper trendline and 200 EMA (~$83,952), suggesting possible breakout.
---
2. Key Zones:
FVG (Fair Value Gap): Around $78,678 — a demand zone where price could retest before moving higher.
Breakout Confirmation Zone: ~$85,130 — breaking above this with volume signals strength.
Target Point: $95,206 — an upside target projecting ~31.77% gain from the breakout.
---
3. Indicators:
200 EMA: Currently acting as resistance. Break above it confirms bullish momentum.
RSI: Around 60 — pointing upward with bullish divergence from recent lows, showing increasing buying pressure.
---
4. Scenarios:
Scenario 1 (Bullish Continuation):
Breaks above trendline and 200 EMA.
Retest (optional) and then heads toward $95,206 target.
Scenario 2 (Retest First):
Price dips into the FVG/demand zone.
Finds support and launches upwards, confirming a strong base.
Mr SMC Trading point
---
Summary of the Idea:
This is a buy setup on breakout or on pullback:
Aggressive Entry: Break and close above $85,130.
Safe Entry: Pullback into $78,678 area (FVG).
Target: $95,206
Risk Zone: Below $78,000 (invalidates bullish structure).
Pales support boost 🚀 analysis follow)

BTC/USD Bullish Breakout Setup – Targeting $85,477 with 5.62% UpThe price has recently surged above both the 30 EMA (red) and 200 EMA (blue), signaling a strong bullish move.
The EMAs are beginning to turn upward, particularly the 30 EMA, suggesting short-term bullish momentum.
Key Levels Identified
Entry Zone (Purple Support Zone):
Around $80,105 – a potential buy zone after a pullback.
Labeled with STOP LOSS, indicating the invalidation level if price drops below this zone.
Target Zone (Purple Resistance Zone):
Around $85,477 – this is the target level, marked as “EA TARGET POINT”.
Offers a potential move of +5.62% or 4,551.83 points.
Price Action
Price broke above a previous resistance (now support) and has pulled back slightly.
The projected move suggests a bullish continuation after a minor pullback and consolidation.
Risk-Reward
Good risk-reward ratio implied with the large gap between the stop loss and target.
Stop loss is tight, just below the purple support zone (~$80,105).
Projection
The blue lines and annotations suggest a bullish play, with an expected upward movement after retesting the support.
✅ Possible Trade Idea
Buy Zone: ~$80,105 (on a confirmed retest)
Stop Loss: Slightly below $80,105
Target: ~$85,477
Expected Move: +5.62%
🔍 Additional Notes
Keep an eye on price behavior around the support zone—confirmation (e.g., bullish candle pattern or rejection wick) strengthens the entry.
The strong move leading to the breakout suggests high momentum, which could mean limited pullback.
News or macro developments could invalidate technicals—be aware of external factors.

BTC/USD) Bullish reversal analysis Read The ChaptianSMC Trading point update
This is a bullish reversal analysis on BTC/USD (Bitcoin to USD) on the 4-hour chart, suggesting a potential long opportunity after a sharp corrective move.
---
Key Breakdown of the Chart:
1. Strong Downward Move with Potential Reversal:
Bitcoin experienced a sharp drop from the 88k region to ~74,387.50, now hitting a key demand zone (marked as "Orderblock").
2. Bullish Reaction Expected:
From the Orderblock support zone, a bullish reversal is anticipated.
The projected move aims to fill the imbalance and test the target zone between 87,152.94 and 88,557.14.
3. RSI Oversold:
RSI is around 32.27, indicating oversold conditions and adding confluence for a potential bounce.
4. EMA (200):
The 200 EMA lies around 85,153.85, which may act as dynamic resistance on the way up.
Mr SMC Trading point
5. Price Target:
The expected upside move is approximately +13,722.85 points (+18.75%), aiming for the supply zone above 87k.
---
Conclusion / Trade Idea:
Entry Zone: Near 74,387.50, the orderblock/demand area.
Target Zone: 87,152.94 – 88,557.14
Bias: Bullish short- to mid-term reversal.
Confluences: Oversold RSI, clean support zone, potential trendline bounce, and price inefficiency above.
---
Pales support boost 🚀 analysis follow)
