PGHL Price ActionProcter & Gamble Health Ltd (PGHL) is currently trading around ₹5,900 as of early August 2025. The stock has shown decent upward momentum, with a price range around ₹5,700 to ₹6,000 in recent weeks, though it has experienced some volatility within this band.
PGHL has delivered solid returns over the past year, roughly 15%, and longer-term growth is also positive with a multi-year compounded annual growth rate in the double digits. The company maintains a market capitalization close to ₹9,850 crore and offers a dividend yield around 4.4%, providing steady income to shareholders.
Valuation metrics indicate PGHL trades at a premium, justified by its stable revenue growth and presence in the health and pharmaceutical segment. While short-term price fluctuations occur, the overall outlook remains favorable, supported by consistent operational performance and dividend payouts.
In summary, PGHL is a fundamentally sound health sector stock with solid past returns, moderate volatility, and reasonable dividend income, suitable for investors looking for stable growth in the healthcare industry.
Bullishbreakout

Hester Price ActionAs of July 31, 2025, Hester Biosciences Ltd is trading near ₹1,950 after a recent rebound, though it has experienced a significant decline over the past year, down roughly 37% from its 52-week high above ₹3,250. The stock’s recovery in the last three months has been moderate, with gains of about 9%, and short-term sentiment appears slightly positive given the recent upward movement.
The company’s current price-to-earnings ratio is elevated, close to 58, and the price-to-book ratio is about 4.9, indicating a premium valuation compared to its book value. Hester Biosciences maintains a market capitalization near ₹1,650 crore, placing it among smaller specialty pharma and agri-biotech firms. While the core fundamentals show resilience, the firm recently reported a contraction in sales for the first time in three years, which led to some investor caution.
Technically, Hester Biosciences is recovering from its yearly lows near ₹1,240 and is showing renewed buying interest at current levels, confirmed by an uptick in volumes and momentum. However, given the sharply reduced returns over the past year, sentiment is mixed, and further upside will likely depend on improvement in financial result trends and any breakout above resistance points established during its downtrend.
Overall, the near-term outlook is cautiously constructive with recent stabilization, but investors should monitor for sustained improvements in revenue and earnings to confirm a continued reversal.

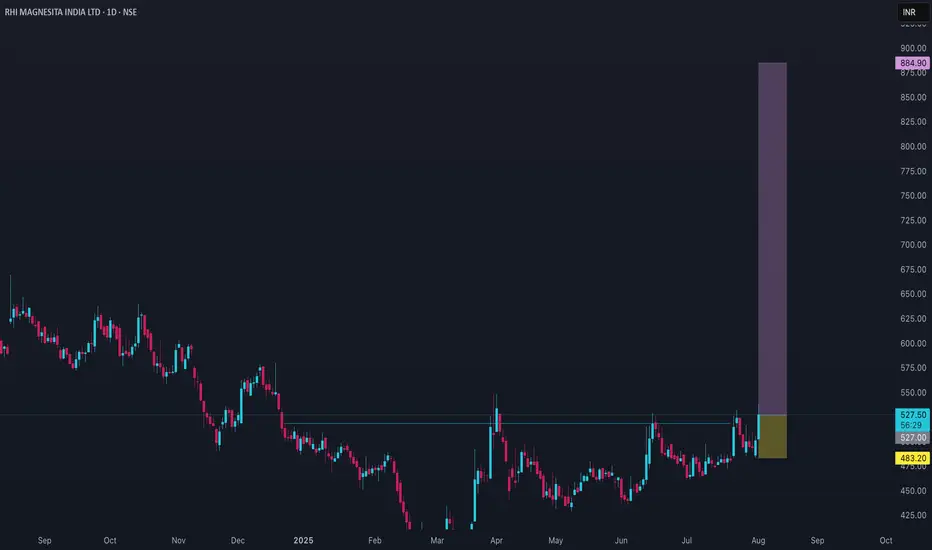
RHIM Price ActionRHI Magnesita India Ltd (RHIM) is trading around ₹529 in early August 2025, having shown notable volatility over the past several months. The stock has ranged between a recent low of about ₹503 and a high near ₹538 in the last few days. The annual performance indicates a mild decline over the last year but double-digit gains in the last three to six months, pointing to a marked recovery from earlier lows.
Financially, RHIM carries a relatively high valuation, with a price-to-earnings ratio close to 54 and a price-to-book value of about 2.8. Operating fundamentals are decent but not exceptional: return on equity remains moderate, and promoter holdings have slightly decreased over the past few years. The company offers a modest dividend yield of about 0.5%, providing limited income support to investors.
In terms of recent momentum, trading volumes have spiked, indicating renewed interest, and short-term technicals suggest the possibility of continued oscillation within the current price band. The stock’s long-term prospects remain tied to trends in the refractories and industrial materials sector, where growth has been consistent but not rapid.
In summary, RHIM is exhibiting renewed price momentum but continues to trade at elevated valuation multiples. The company’s stable position in its sector and improving sentiment support the stock at current levels, though further substantial upside will likely depend on sustained earnings growth and sector expansion.
Kajaria Ceramics Price ActionKajaria Ceramics is currently trading around ₹1,177, with a market capitalization close to ₹18,750 crore as of the end of July 2025. The stock has shown solid performance in recent months—up about 46% over the last quarter and nearly 19% in the past six months, although it experienced a mild 0.2% dip over the last week. Despite this rally, the stock is valued at a relatively high price-to-earnings (P/E) ratio of around 59 and a price-to-book (P/B) ratio of approximately 6.6, suggesting that it is trading at a premium to its asset base and compared to industry averages.
Profit growth has lagged sales growth, with annual sales increasing modestly but profit growth remaining subdued. The 52-week price range is quite wide, with a high of ₹1,579 and a low of ₹759, reflecting periods of both volatility and strong recoveries.
Analyst outlook remains moderately positive, with one-year price targets averaging near ₹1,259 but estimates ranging widely from ₹731 to ₹1,716. Near-term forecasts mostly see the price consolidating between ₹1,150–₹1,200, with oscillations rather than sustained moves upward or downward.
In summary, Kajaria Ceramics stands out for its recent price momentum and market strength. However, its stretched valuation multiples and only moderate earnings growth highlight the need for careful consideration if expecting further near-term appreciation. The company's premium valuation is reliant on continued improvement in industry demand and profitability. Its financial position and recent run-up make it a stable but potentially fully valued pick at present levels.

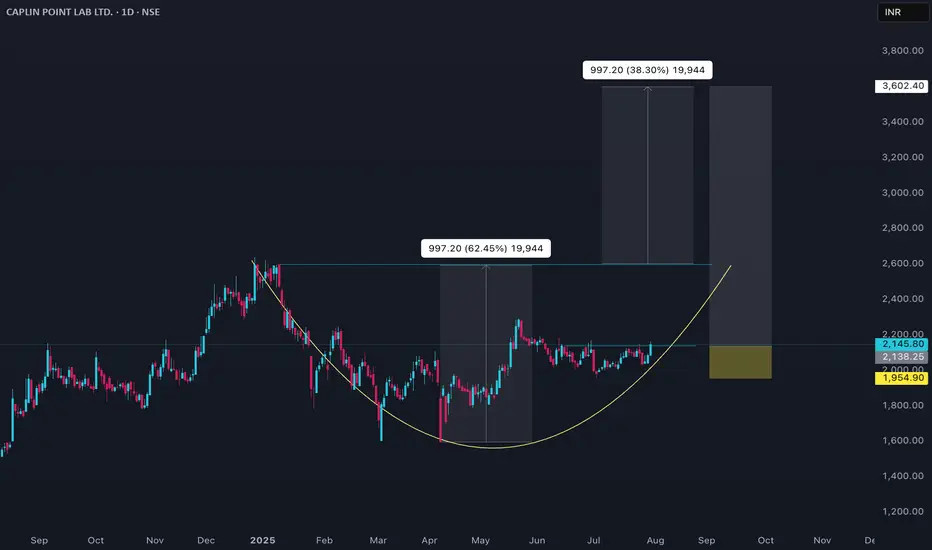
CAPLIPOINT Price ActionAs of July 31, 2025, Caplin Point Laboratories Ltd (CAPLIPOINT) is trading near ₹2,085, showing a mixed but steady performance with some recent price fluctuations around this level. The stock briefly touched intraday highs around ₹2,095 and lows near ₹2,030, maintaining support in the ₹2,030–₹2,055 range. Market capitalization stands broadly near ₹15,590 crore.
Caplin Point benefits from solid fundamentals in the pharmaceutical sector, supported by consistent revenue growth and operational efficiencies. The price-to-earnings ratio sits around 29, while the price-to-book ratio is approximately 5.5, indicating premium valuation relative to book but in line with sector expectations. Dividend yield is low at about 0.15%, reflecting the company’s focus on growth over payout.
Technically, the stock tends to hover above its medium-term moving averages like the 50-day and 200-day SMAs, showing cautious bullish momentum, although near-term volatility remains. Trading volumes are moderate, and the relative strength index is near mid-range levels, suggesting balanced momentum without overbought or oversold extremes.
Overall, Caplin Point Laboratories currently reflects steady fundamentals with a valuation premium typical of its pharma peer group, supported by stable trading ranges and positive medium-term technical signals. The near-term outlook remains cautiously optimistic, with key support near ₹2,030 and potential resistance around ₹2,100–₹2,120.
NIACL Price ActionAs of July 30, 2025, New India Assurance Company Ltd (NIACL) stock closed near ₹204, showing a strong recovery with a sharp rally of around 17% in a single day fueled by robust Q1 earnings and positive market sentiment. The stock bounced back from earlier volatility and support levels near ₹170, with technicals indicating bullish momentum supported by moving average crossovers.
NIACL’s recent financial performance has been impressive with an 80% surge in net profit year-on-year and a 13% growth in gross written premiums, reflecting strong industry position and operational gains. Its market capitalization stands near ₹33,676 crore with a price-to-earnings ratio around 32 and a price-to-book ratio about 1.2, suggesting valuation in line with sector averages but on the higher side.
While the stock has faced some volatility and a one-year decline near 27%, it has gained nearly 19% over the past three months, driven by improved underwriting efficiency and investment income stability. Analysts remain cautiously optimistic about its near-term upside potential, assuming continued operational improvements and support at key price levels.
In summary, NIACL currently presents a turnaround profile with renewed earnings strength, improving fundamentals, and constructive technical signals, making it an interesting candidate for medium-term investors willing to tolerate some volatility.

GVT&D Price ActionGE Vernova T&D India Ltd (GVT&D) has experienced a significant surge, with its stock price around ₹2,597 as of July 30, 2025. Over the past year, the stock delivered an impressive return of about 61%. Over three years, the returns are even more dramatic, exceeding 2,100%. However, the broader financials reveal a company with mixed metrics.
The stock’s high price-to-earnings (P/E) ratio and price-to-book value suggest it is currently overvalued compared to peers and the market average. Analyst forecasts for the next 12 months range between ₹2,005 and ₹3,000, with a consensus target near ₹2,450. Most analysts continue to view the stock favorably and assign it a “strong buy” outlook, though with caution about its rich valuation.
GVT&D’s profitability stands out; it has shown robust growth in both operating profit and earnings per share recently. Return on equity has climbed above 40% in the past year, indicating efficiency in generating returns for shareholders. The company is also almost debt-free and maintains stable cash flows, which reduces financial risk.
Volatility for GVT&D is slightly higher than the market average, but price movement has been relatively stable, with no extreme swings in recent months. Still, investors should be aware that such high past returns may not be sustainable, especially with modest sales growth and valuation multiples well above industry norms.
In summary, GVT&D remains a high-performing and highly-valued stock in the Indian power equipment sector, with strong recent momentum, robust profitability, and a largely positive market outlook—albeit with potential risk due to elevated pricing and slower sales growth compared to its historic surge.

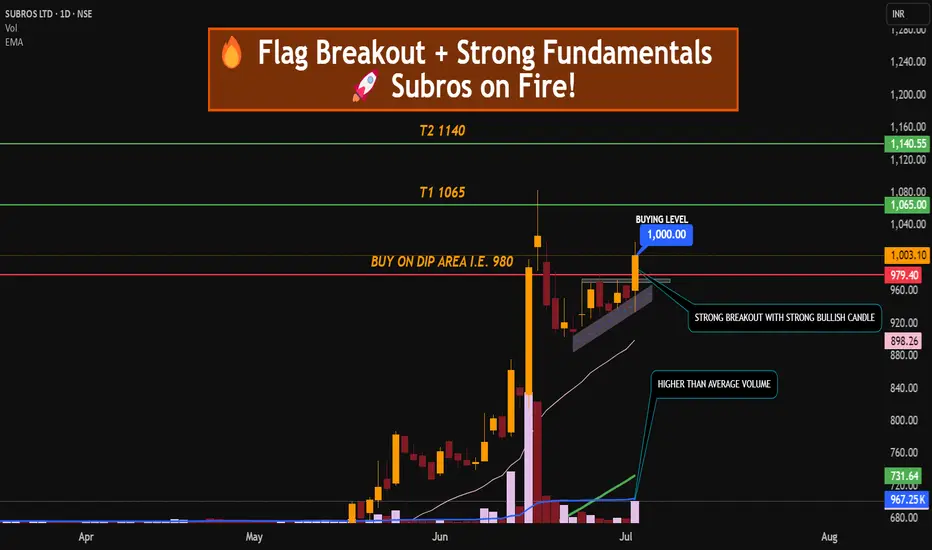
FLAG BREAKOUT + STRONG FUNDAMENTAL = AUTO STOCK ON THE MOVE SUBROS ON FIRE
Subros Ltd has formed and broken out of a bullish flag pattern on the daily chart, supported by strong volume, indicating continuation of its upward trend.
🔍 Technical Analysis:
Pattern: Bullish flag breakout
Breakout Confirmation: Strong bullish candle above consolidation (flag zone) with volume
Strong uptrend, supported by both EMA 20 and EMA 50
Support Zone: ₹950–₹960 (previous flag top)
Volume Spike: Confirms bullish momentum on breakout
QUIK FUNDAMENTAL KEYS WHICH CONFIRM ITS BULLISHNESS.
📈 Price Strength: Strong momentum with recent 52-week high
💰 ROCE: ~17.3% (efficient capital usage)
🏦 ROE: ~12.5% (shareholder return strength)
📉 Debt to Equity: ~0.2 (low debt = financially stable)
📊 Net Sales Growth: ~20% YoY (consistent top-line growth)
🔧 Sector: Auto Ancillary – strong demand recovery cycle
💡 Trade Rationale:
Subros is technically strong with a clean flag breakout and volume confirmation. Fundamentals support this move, with consistent revenue growth, efficient capital usage, and a low-debt structure.
TRADE PLAN :
Entry: Around ₹1000 (CMP) or on dip near ₹960–₹970 (retest)
Stop Loss: ₹940 (below consolidation)
Target 1: ₹1065
Target 2: ₹1120–₹1140
Risk-Reward: ~1:2.5+
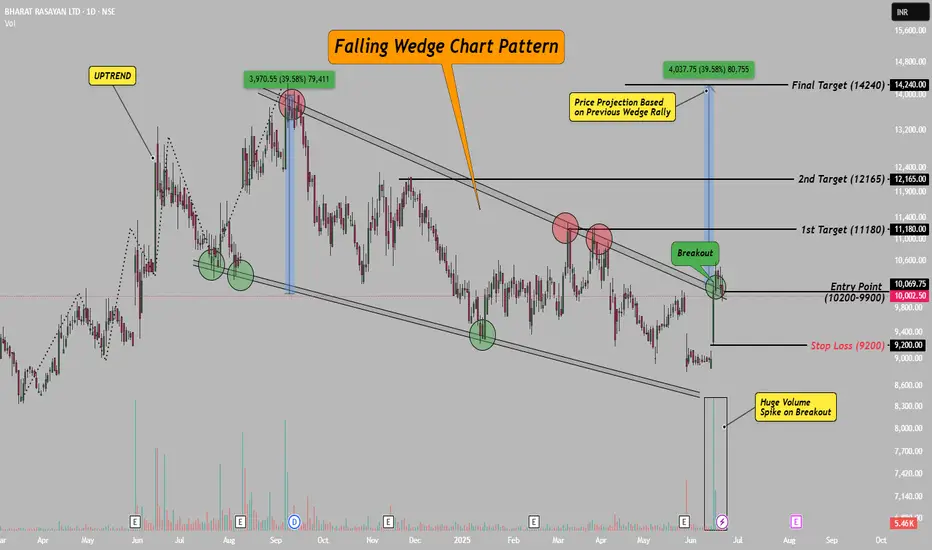
Bharat Rasayan–Falling Wedge Breakout with 39% Upside Potential!Hello Everyone, i hope you all will be doing good in your life and your trading as well! Today i have brought a post which is on Bharat Rasayan – a classic case of a falling wedge breakout.
After staying in a falling wedge pattern for nearly 10 months, the stock has finally broken out with a strong bullish candle and a clear volume spike. This breakout zone (9900–10200) also aligns with the downtrend line, making it even more valid.
The best part? This has participated in rally yet, means there is a lot remain in this stock, please check chart above for entry, stop loss and targets.
This setup is based on price action, chart structure, and previous pattern behavior. If you’re a swing or positional trader, this one’s worth watching!
If you liked this idea, don’t forget to LIKE & FOLLOW for more clean, technical setups.
Disclaimer: This idea is for educational purposes only. Do your own research before taking any trade.
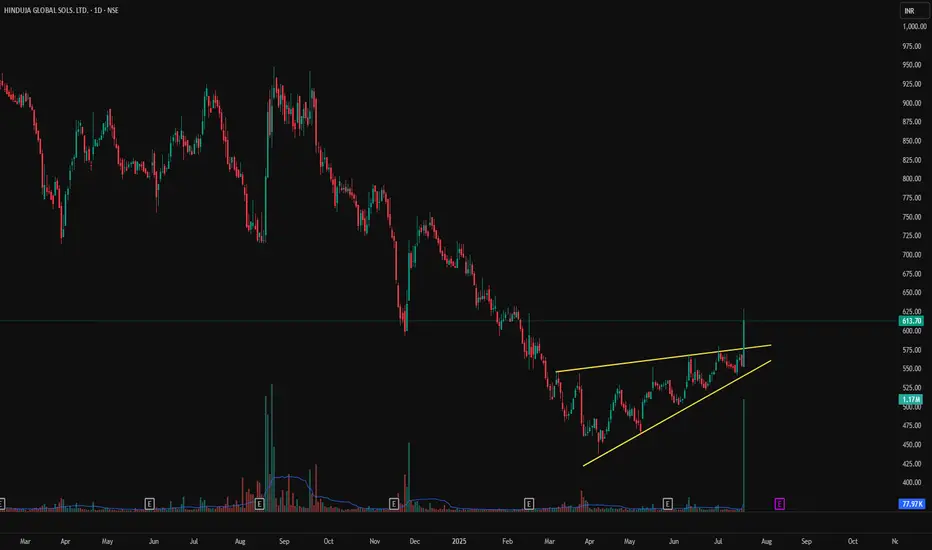
HGS - Rising Wedge Breakout on Volume Spike | Daily Chart📊 HGS – Rising Wedge Breakout on Volume Spike | RSI Above 70 | Fresh Bullish Momentum
📅 Chart Date: July 17, 2025
📍 CMP: ₹613.70 (+10.72%)
📈 Symbol: NSE:HGS | 1D Timeframe
🔍 Technical Analysis Breakdown
🔺 Rising Wedge Breakout
Price broke above the upper resistance of a rising wedge pattern.
Strong confirmation with a wide bullish candle and volume spike.
📊 Volume Surge
Volume: 1.17M against average volume of ~78K
Sudden institutional interest or news-based momentum likely behind the move.
📉 RSI (14, close): 73.03
RSI crossed into overbought territory, showing strong bullish momentum but could warrant caution or consolidation soon.
📌 Support & Resistance Levels
Breakout Zone: ₹580–₹590
Next Resistance: ₹650+ (gap-fill zone from earlier breakdown)
Support: ₹560 (upper trendline of broken wedge)
📌 Key Observations
First strong breakout since months of sideways to bullish accumulation.
Sustained close above ₹590–₹600 will confirm continuation.
Caution if price retraces inside wedge again.
🏁 Trade Setup
Entry: On Retest of ₹590–₹600
Target: ₹650 / ₹675
Stoploss: Below ₹560
Risk Level: Moderate (due to overbought RSI)
⚠️ Disclaimer: This is an educational chart setup and not trading advice. Please conduct your own research and risk management.
📣 Follow @PriceAction_Pulse for more such clean breakouts and chart pattern analysis!
🔁 Drop a comment if HGS is on your radar for the next breakout rally 📈
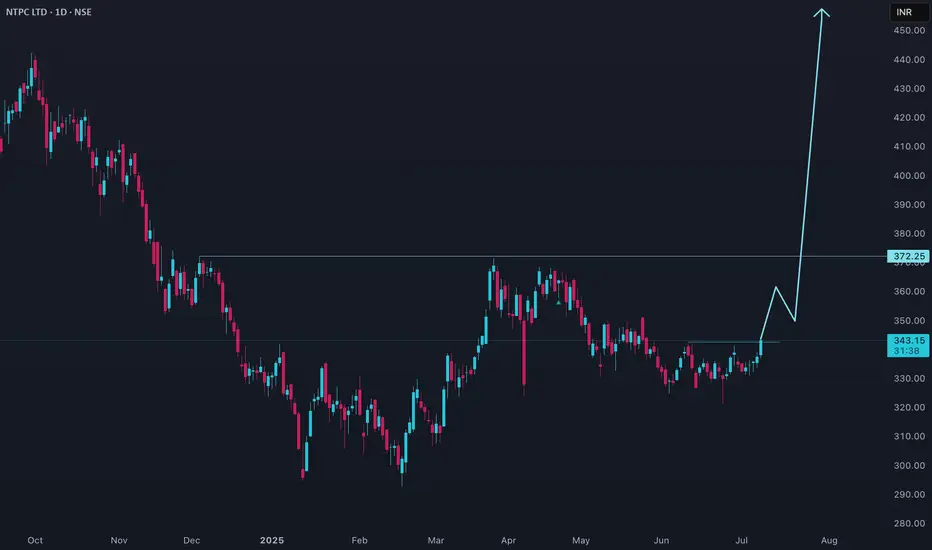
NTPC price action### NTPC Price Analysis
#### Current Price and Performance
- NTPC is trading in the ₹370–₹380 range as of early July 2025.
- The stock has achieved a 52-week high near ₹390 and a low around ₹200, reflecting a strong upward trend over the past year.
- Year-to-date, NTPC has delivered a return of over 60%, with particularly strong momentum in the last six months.
- Short-term price action shows some consolidation after a sharp rally, with minor fluctuations in the past few weeks.
#### Trend and Technical Overview
- The medium-term trend remains bullish, supported by robust earnings, capacity expansion, and favorable sector dynamics.
- Technical indicators suggest the stock is in overbought territory, with some analysts expecting a pause or correction before the next leg up.
- NTPC’s beta is below 1, indicating lower volatility compared to the broader market.
#### Valuation and Financial Metrics
- NTPC trades at a moderate price-to-earnings (P/E) ratio, below many private sector peers, making it relatively attractive from a valuation perspective.
- The price-to-book (P/B) ratio is reasonable, reflecting the company’s stable asset base.
- Dividend yield is above 3%, appealing to income-focused investors.
- The company maintains a strong balance sheet, steady cash flows, and a history of consistent dividend payouts.
#### Market Sentiment and Outlook
- Market sentiment is positive, with analysts maintaining a buy or accumulate stance for long-term investors.
- The company’s focus on renewable energy and capacity addition is seen as a key growth driver.
- While the stock may experience short-term consolidation, the long-term outlook remains favorable due to NTPC’s dominant position in the power sector and ongoing expansion plans.
#### Summary
NTPC has delivered impressive returns over the past year, driven by strong fundamentals and sector tailwinds. The stock is currently consolidating after a significant rally, but its valuation, dividend profile, and growth prospects make it attractive for investors with a medium- to long-term horizon. Caution is warranted in the short term due to potential profit booking, but the overall outlook remains positive.
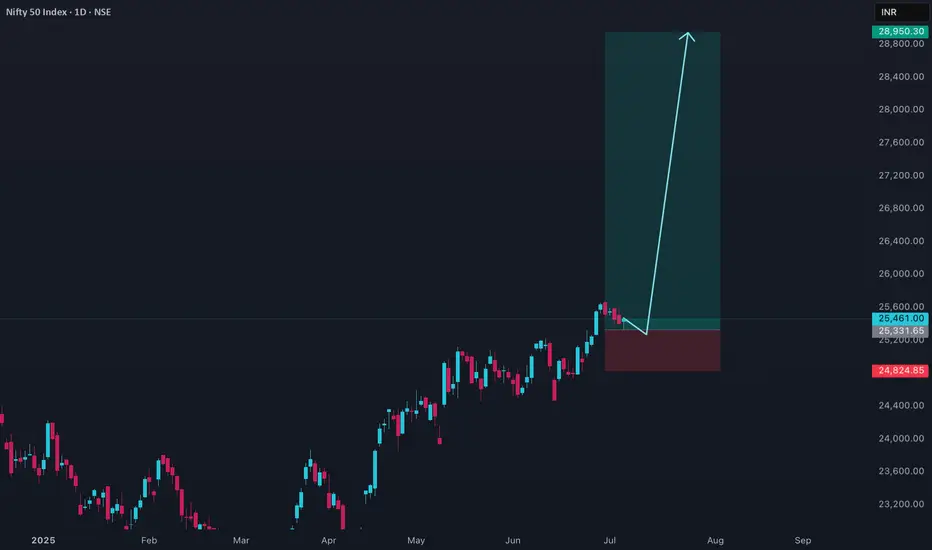
Nifty price actionNifty 50 closed at 25,461 with a modest gain, reflecting cautious optimism after recent profit booking and volatility. The index formed a bullish hammer candlestick, which is often interpreted as a sign of potential short-term reversal or support. Buying interest in heavyweight stocks like Bajaj Finance, Infosys, Dr. Reddy’s, ICICI Bank, and Wipro helped offset declines in sectors such as metals and auto.
Technically, Nifty found support near its near-term EMA trendline, and the RSI remains healthy in the low 60s, suggesting the trend is still neutral to positive. Immediate support levels are at 25,240 and 25,103, while resistance is seen at 25,682 and 25,819. Sustained trading above 25,682 could trigger further upside, possibly toward 26,000, but a break below 25,240 would increase the risk of a deeper correction, with 25,000 and 24,500 as the next key supports.
Market sentiment remains cautiously optimistic, with advances outnumbering declines. However, overbought oscillators and low ADX readings indicate limited momentum, so the index may remain rangebound unless a clear breakout or breakdown occurs. Traders are advised to watch for a decisive move above 25,600 for bullish confirmation, or below 25,240 for signs of renewed weakness.
Paras Defence Price ActionParas Defence and Space Technologies is currently trading near ₹1,630, having delivered a substantial rally over the past year and outperformed many of its peers in the defence sector. The stock has risen more than 100% from its 52-week low and is trading close to its all-time high, reflecting strong investor confidence and robust momentum. Year-to-date, the stock is up over 60%, though it has shown some short-term volatility with a recent pullback of about 9% in just two days, suggesting a phase of consolidation or correction after its sharp rally.
Fundamentally, the company has demonstrated impressive growth, with recent quarterly results showing revenue up nearly 36% year-on-year and net profit more than doubling. Its return on equity is healthy, and the business remains largely debt-free, which supports its financial stability. The company is also preparing for its first-ever stock split, with a record date set for July 4, 2025. This move is expected to enhance liquidity and attract more retail investors.
Despite these positives, Paras Defence is trading at a high price-to-earnings ratio, indicating that the stock is priced for strong future growth and leaving little room for disappointment. Analyst sentiment is generally positive for the long term, but there is near-term caution due to the recent run-up in price and some signs of weakening momentum. Technical analysts point to key support levels around ₹1,500–₹1,570, with a need for the stock to reclaim ₹1,630 for renewed bullishness.
Overall, Paras Defence is benefiting from strong sector tailwinds, government investment in defence, and its own technological capabilities. While the long-term outlook remains promising, investors should be mindful of the elevated valuation and the potential for further short-term corrections as the stock digests its recent gains.

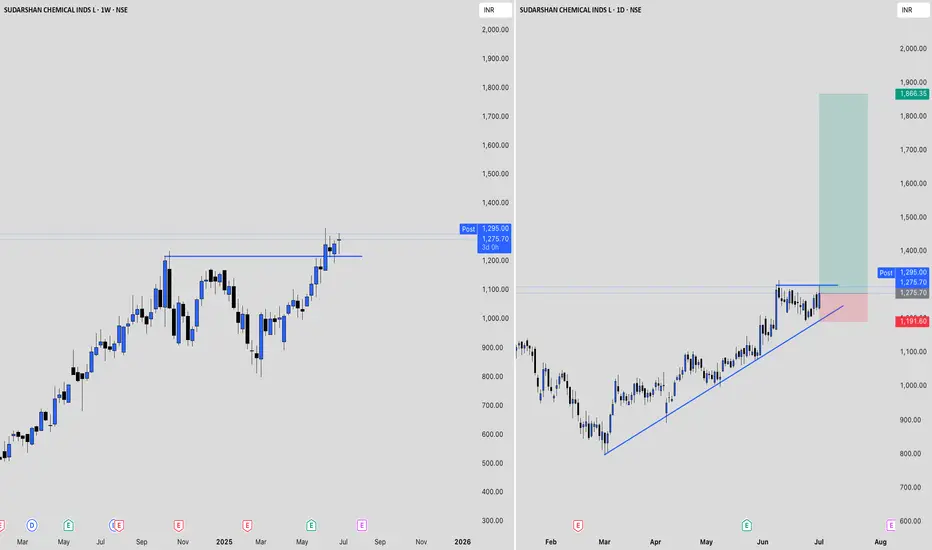
Sudarshan Price ActionSudarshan Chemical Industries is currently trading around ₹1,256, having gained nearly 5% in the past week and over 6% in the last month. The stock has delivered a strong 10% return over six months and nearly 40% over the past year, reflecting robust momentum. Its 52-week high is ₹1,315, while the low stands at ₹796, placing the current price close to its yearly peak.
Valuation-wise, Sudarshan Chemical trades at a high price-to-earnings ratio above 80 and a price-to-book ratio above 8, signaling that the stock is richly valued compared to sector norms. Despite the premium valuation, the company has attracted positive sentiment, with most analysts maintaining a buy or hold stance, though the average target price is slightly below current levels, suggesting limited near-term upside.
Financially, the company has shown steady revenue growth and improved profitability in recent quarters, with net profit margins expanding from previous periods. However, promoter holding has decreased recently, and the company’s sales growth over the past year has been modest. The stock’s low beta indicates relatively lower volatility compared to the broader market.
In summary, Sudarshan Chemical Industries is exhibiting strong price momentum and positive investor sentiment but is trading at expensive valuations. While its recent financial performance has improved, the high valuation and reduced promoter holding may warrant caution for new investors.
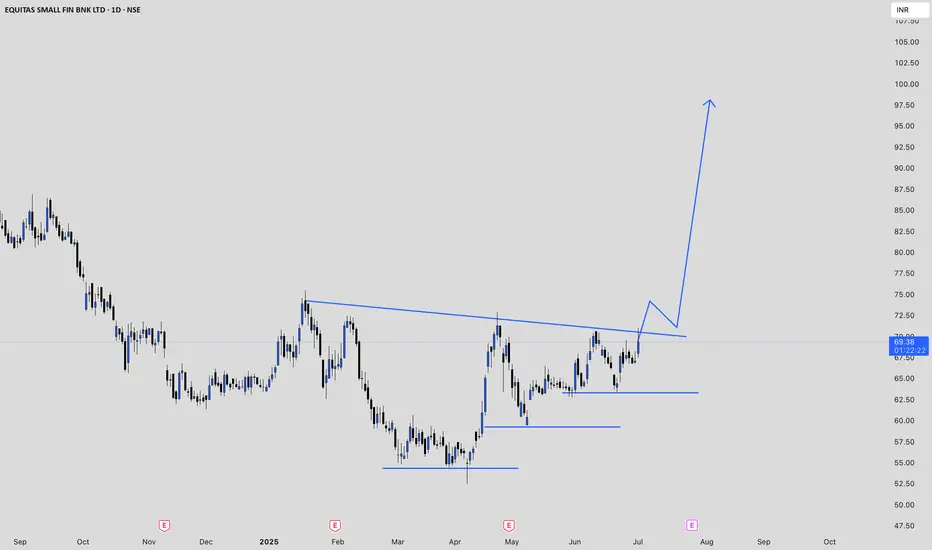
EQUITASBNK Price ActionEquitas Small Finance Bank is currently trading around ₹69, showing a strong gain of over 5% on July 1, 2025, and outperforming its sector in the short term. The stock has been volatile, with a day range between ₹67.50 and ₹71.00. Its 52-week high is ₹97.21, while the 52-week low stands at ₹52.52, placing the current price closer to the lower end of this range. The all-time high for the stock is ₹116.50.
Market capitalization is approximately ₹7,950 crore, and trading volumes remain robust, with recent daily volumes exceeding 6.5 million shares. This liquidity ensures ease of entry and exit for investors. Over the past year, the stock has declined about 30%, reflecting broader challenges in the sector and some company-specific headwinds.
Financially, Equitas Small Finance Bank has reported revenue of about ₹6,312 crore and a net profit of ₹147 crore. However, the company’s interest coverage ratio is low, indicating some pressure on its ability to service debt from operating profits. The stock is generally considered to have average financial strength but is recognized for its high growth trend, albeit currently priced at high valuations. The trailing twelve-month EPS has declined sharply year-on-year, and the stock is trading at a high price-to-earnings multiple relative to sector norms.
In summary, Equitas Small Finance Bank is showing short-term momentum and strong trading activity but remains well below its yearly highs. The company faces profitability and valuation challenges, and while growth prospects are present, investors should be mindful of the recent volatility and underlying financial pressures.
RBL bank price actionRBL Bank's stock price has shown notable activity recently, influenced by both technical and fundamental factors. Below is a detailed analysis:
## **Current Price Action**
- **Latest Price**: RBL Bank's shares rose by 4.86% on March 24, 2025, reaching ₹176.40, breaking out of a consolidation range of ₹150–170
- **Technical Indicators**: The stock's breakout is supported by robust trading volumes and a daily RSI above 60, indicating bullish momentum
## **Fundamental Analysis**
- **Valuation Metrics**:
- P/E Ratio: 10.28 (lower than the sector average of 19.47), indicating undervaluation
- P/B Ratio: 0.69, suggesting the stock is trading at a discount compared to its book value
- **Intrinsic Value**: Estimated at ₹267.23, reflecting significant upside potential from the current price
## **Recent Financial Performance**
- **Q3 FY25 Results**:
- Revenue grew by 16% YoY to ₹4,610 crore
- Net profit declined sharply by 80.7% YoY due to higher provisions for NPAs in microfinance and credit card portfolios.
- Gross NPA ratio improved marginally to 2.92%, while net NPA reduced to 0.53%, indicating mixed asset quality trends
## **Long-Term Outlook**
- Despite short-term challenges in profitability, RBL Bank's fundamentals remain strong, with healthy loan growth (13% YoY) and improving operational efficiency. Analysts suggest it may be suitable for long-term investment due to undervaluation and expected recovery in profitability metrics.
Investors should monitor RBL Bank's asset quality trends and earnings growth closely while considering its low valuation as an attractive entry point for medium to long-term gains.

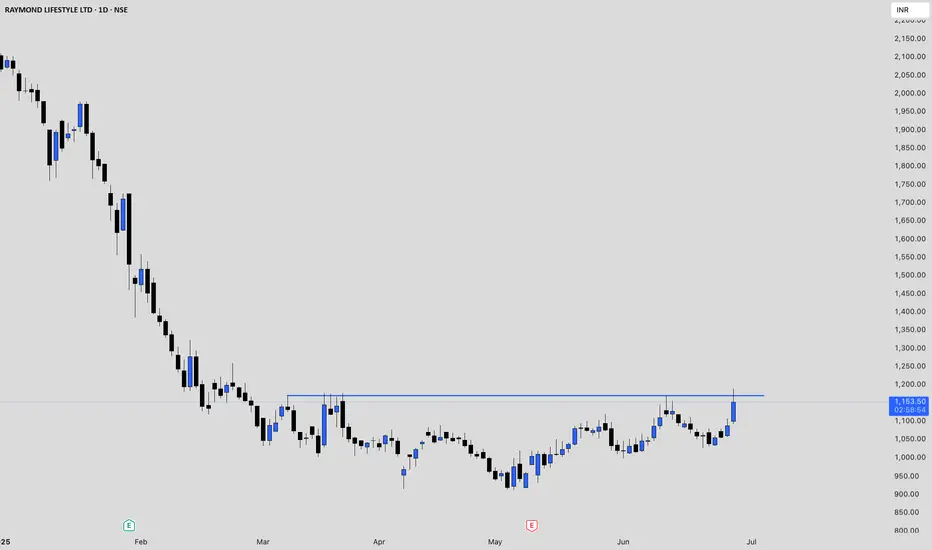
RAYMONDLSL Price actionRaymond Lifestyle Ltd (RAYMONDLSL) is currently trading in the range of ₹1,088 to ₹1,179 as of June 26, 2025, showing a strong rebound in the last few days after a prolonged period of decline. Over the past year, the stock has been highly volatile, reaching a 52-week high of ₹3,100 and hitting a low of ₹911.35 in May 2025. The share price has dropped significantly, with a decline of about 64% over the last year and nearly 48% over the last six months.
Despite this correction, the stock has recently shown some positive momentum, climbing over 11% in the past week and about 8% in a single session. Its market capitalization is around ₹7,185 crore. The price-to-earnings (P/E) ratio is low at 2.72, and the price-to-book (P/B) ratio is also relatively modest, indicating the stock may now be trading at more reasonable valuations compared to its recent past.
Raymond Lifestyle has demonstrated exceptional revenue growth, with annual growth far outpacing its three-year compound annual growth rate. However, the company has also taken on new debt for the first time in five years, which could impact its financial flexibility going forward. Technical signals, such as a recent 50-day moving average crossover, suggest that there could be further short-term upside, as this pattern has historically led to gains in the following month.
Overall, Raymond Lifestyle Ltd is recovering from a sharp correction and is currently showing signs of short-term strength. The company’s fundamentals reflect strong revenue growth but also new debt obligations. Investors should be aware of the stock’s high volatility and recent history before making decisions, as the long-term trend remains cautious despite recent gains.
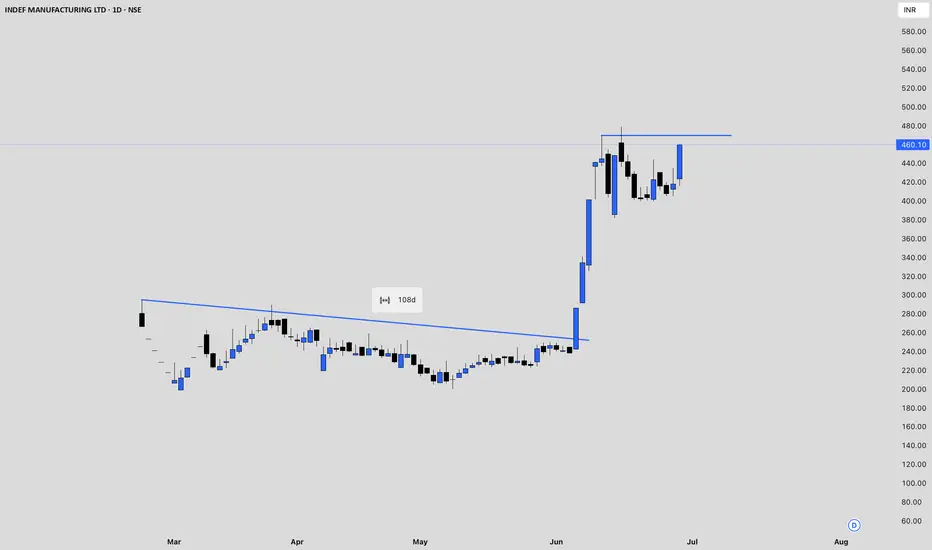
BAJAJINDEF Price ActionBajaj Indef (BAJAJINDEF) has experienced a period of high volatility and rapid price movement in June 2025. After a sharp rally from around ₹225 in late May to a peak near ₹478.90 by mid-June, the stock has since corrected and is now trading in the ₹400–₹420 range. This recent surge was accompanied by significant spikes in trading volume, indicating heightened market interest and participation.
The stock’s price action shows a pattern of large daily swings, with both double-digit percentage gains and losses within short intervals. This suggests speculative activity and possibly profit-booking after the strong rally. The valuation of the stock has shifted from not qualifying to being considered very expensive, reflecting the sharp run-up in price relative to its fundamentals.
Short-term momentum appears to have cooled, with the stock pulling back from its highs and now consolidating. Investors should be cautious, as the recent volatility and elevated valuation may lead to further price fluctuations. The underlying trend remains positive compared to levels a month ago, but the risk of sharp corrections is high given the stock’s recent behavior.
CERA Price action**CERA Sanitaryware (NSE: CERA) Price Analysis – June 2025**
- **Current Price:** As of June 27, 2025, CERA closed at ₹6,816, showing a 3.33% gain from the previous session.
- **Recent Trend:** The stock has been volatile in June, with prices fluctuating between ₹6,573 and ₹7,275. Over the past week, it declined by about 2.8%, but remains up 6% for the month and nearly 17% over the past three months.
- **Long-Term Performance:** Despite recent weakness, CERA has delivered a 62% return over three years and nearly 198% over five years. However, the stock is down about 27% year-on-year and 8.5% over the last six months, reflecting sectoral and company-specific challenges.
- **Valuation:** The price-to-earnings ratio is around 34.5, and price-to-book is 6.2. The dividend yield is close to 1%. These metrics are moderate compared to sector peers, with CERA’s PE below Kajaria Ceramics but above Somany Ceramics.
- **Fundamentals:** Revenue growth has averaged 7.2% annually over five years, slightly above the industry average. Net income growth is strong at 15.7% per year. The company recently reported modest revenue growth but faced margin pressures, with EBITDA declining in the latest quarter.
- **Outlook:** Analysts remain mostly positive, with a majority suggesting a buy rating. The company is focusing on operational efficiency and expanding its luxury product range to counter retail market challenges. Recovery in the real estate sector and government initiatives are expected to support future growth.
**Key Takeaway:**
CERA’s stock is stabilizing after a period of volatility, supported by solid long-term fundamentals but facing near-term headwinds in profitability and demand. The medium-term outlook is constructive, especially if margin recovery strategies succeed and sector demand improves.

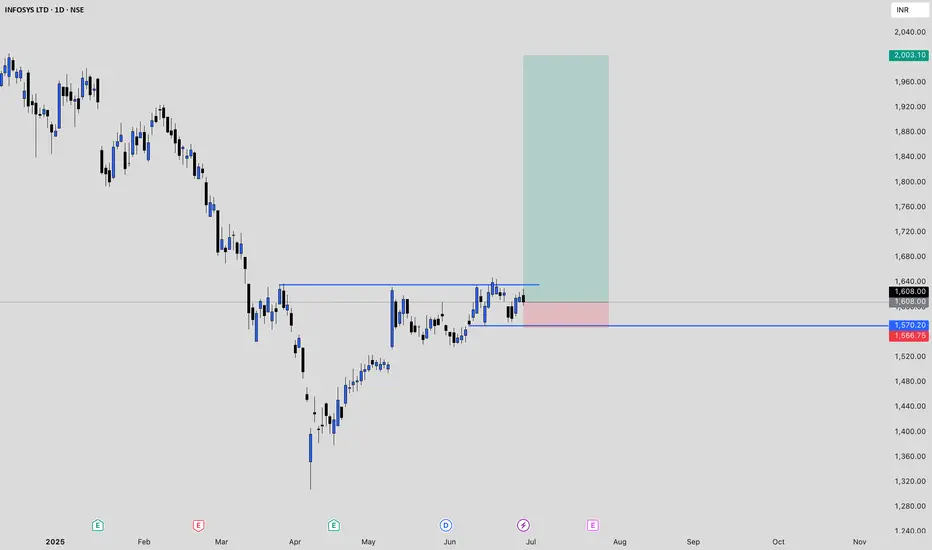
Infy Price actionInfosys (INFY) is currently trading around ₹1,608, with recent fluctuations between ₹1,606 and ₹1,629. Over the past year, the stock has delivered modest gains, slightly underperforming broader market indices and the IT sector. Financially, Infosys remains robust, maintaining strong revenues, healthy profit margins, and a debt-free balance sheet. The company continues to reward shareholders with consistent dividends, including a recent payout of ₹22 per share.
Looking ahead, growth expectations for Infosys are muted. The company has projected revenue growth of just 0–3% for the upcoming fiscal year, citing macroeconomic uncertainties and cautious client spending in its key markets. This represents one of the lowest growth forecasts for Infosys in over a decade and reflects broader industry headwinds, including delayed client decision-making and a focus on cost optimization.
Analyst sentiment is generally positive but cautious, with most maintaining a buy or hold rating. Price forecasts for the next year range from ₹1,667 to ₹1,945, indicating limited upside from current levels. Technical analysis shows immediate support near ₹1,579 and resistance around ₹1,633, suggesting the stock is likely to remain range-bound in the near term.
In summary, Infosys is financially sound and offers stable dividends, but near-term growth is expected to be subdued due to global economic challenges and restrained client budgets. The stock is more attractive for investors seeking stability and income rather than aggressive capital appreciation at this stage.
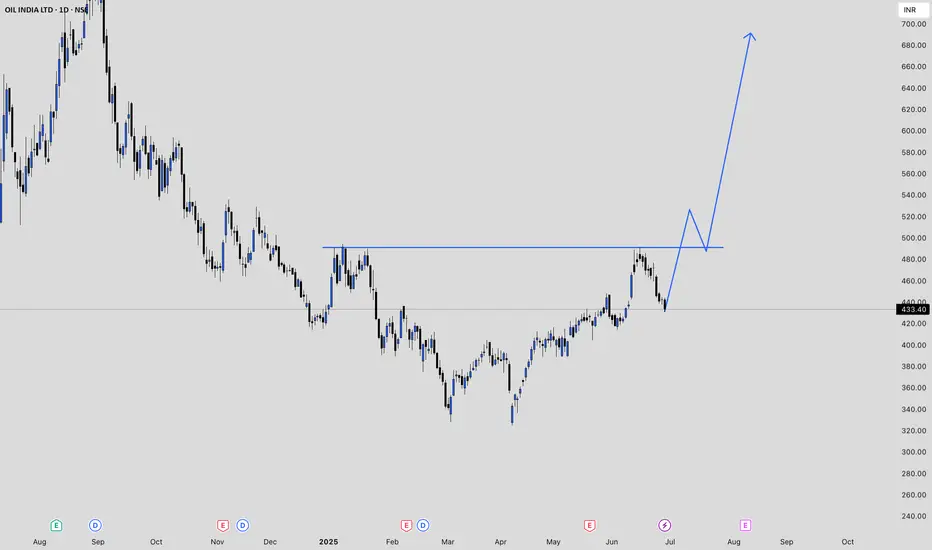
OIL Price ActionOil India Limited is currently trading at ₹433.40 as of June 27, 2025. The stock has seen a notable decline over the past week, falling by nearly 7%. Over the last month, the price has remained relatively flat, with a slight gain of about 0.5%. Looking at a broader time frame, the stock is up 12% over the past three months and has gained just under 2% in the last six months.
The 52-week high for Oil India stands at ₹767.90, while the low is ₹325.00, indicating that the stock is trading well below its peak for the year. Recent sessions have shown increased volatility, with sharp movements both up and down. For example, the stock dropped over 5% in a single day on June 24, after previously rallying above ₹470 earlier in the month.
Oil India’s price-to-earnings (PE) ratio is 10.98, and the price-to-book (PB) ratio is 1.32, suggesting the stock is reasonably valued compared to its historical averages and sector peers. The company maintains a market capitalization of around ₹70,500 crore, ranking it among the larger players in India’s gas and petroleum sector.
In summary, Oil India Limited is currently in a correction phase after a strong run-up earlier this year. The stock is trading closer to its recent lows than its highs, with moderate valuation metrics and ongoing volatility. Investors should watch for further price stabilization before considering new positions.
CEATLTD Price actionCEAT Ltd has recently shown a recovery in its price action after a period of volatility. The stock closed at ₹3,645.30, rebounding over 2% in the latest session following a brief dip earlier in the week. Over the past month, CEAT experienced a mild correction, with the price dropping about 4%, but the three-month return remains strong at over 25%. On a one-year basis, the stock has delivered a solid gain of more than 37%, reflecting sustained investor interest and underlying business strength.
Trading volumes have picked up during the recent upswings, indicating renewed buying interest at lower levels. The price has oscillated between ₹3,500 and ₹3,700 in the past week, suggesting the presence of both support and resistance in this range. Despite the recent volatility, the long-term trend remains positive, with the stock having nearly tripled over the past three years.
Fundamentally, CEAT is trading at a premium to its book value, and its return on equity has been moderate. The company’s overall financial health and growth prospects continue to support the stock’s medium- to long-term outlook, though short-term moves may remain choppy as the market digests recent gains. In summary, CEAT is in a consolidation phase after a strong rally, with a positive longer-term trend and renewed buying interest evident on recent dips.

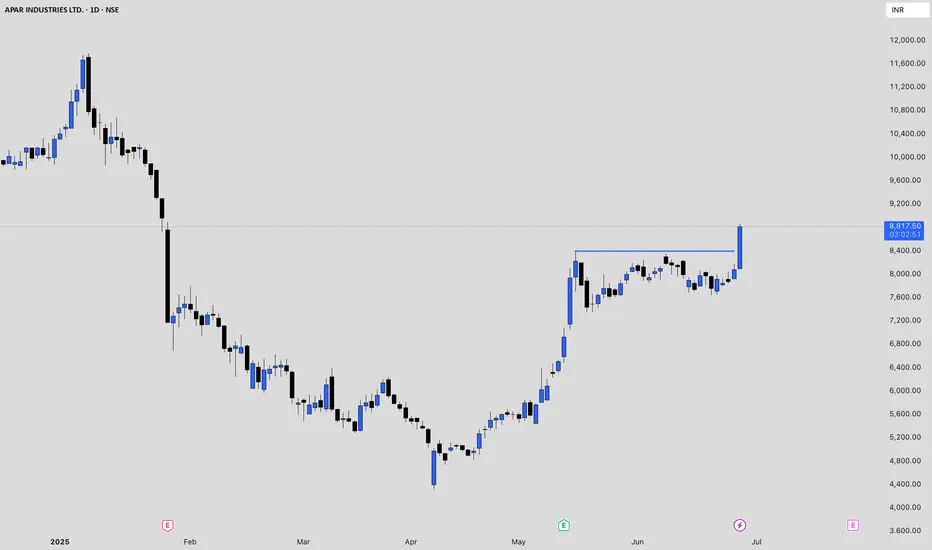
APARINDS Price actionAPAR Industries (APARINDS) is currently trading between ₹8,083 and ₹8,620 per share as of June 26, 2025. The stock is down about 31% from its 52-week high of ₹11,779.90 (reached in January 2025), but it remains 85% above its 52-week low of ₹4,308.05 (from April 2025). Over the past six and twelve months, APARINDS has delivered negative returns of -22.68% and -16.58%, respectively, reflecting a significant correction after a strong rally earlier in the year.
Valuation-wise, the stock has a price-to-earnings (P/E) ratio of around 39, which is lower than the industry average of 59.33 but still considered high. The price-to-book (P/B) ratio stands at 7.21, and the dividend yield is modest at about 0.63%. The company’s earnings per share (EPS) for the trailing twelve months is ₹204.46.
Financially, APARINDS reported revenue of ₹185.81 billion and a net profit of ₹8.21 billion for the trailing twelve months, with a net profit margin of roughly 4.4%. The company maintains a low debt-to-equity ratio of 0.13 and a strong return on equity (ROE) of 18.24%. Growth remains robust, with standalone net sales up 17.87% year-on-year in March 2025 and quarterly net profit rising by 2.45% year-on-year.
Analysts forecast an average one-year target price of ₹9,122, with estimates ranging from ₹6,672 to ₹11,025, suggesting about 8% upside from current levels. Over the next three years, revenue and net income are expected to grow at a compound annual rate of 14–17% and 15–18%, respectively, while EPS is projected to increase by about 15.3% per year. ROE is expected to reach around 20% within three years.
Key strengths for APARINDS include strong revenue and earnings growth, high promoter holding (57.77%), low leverage, and a robust ROE. The main risks are its high valuation, which may limit near-term upside, and the recent negative returns, which indicate some profit-taking or correction after earlier gains.
In summary, APARINDS remains fundamentally strong with solid growth prospects, but investors should be mindful of its premium valuation and recent price volatility when considering entry.