NEWGEN Price Action**NEWGEN (Newgen Software Technologies) Price Analysis – June 2025**
**Current Price & Trend**
- Latest price: Around ₹1,148 as of June 16, 2025.
- The stock has recently shown a mildly bearish technical trend, with daily moving averages and the monthly MACD indicating caution.
- Short-term signals (as of early June) are bearish, with a 5-day EMA crossover and stochastic crossover suggesting further downside. Historically, such signals have led to average declines of 3–11% over the following days and weeks.
**Technical Indicators**
- Most short-term moving averages are giving sell signals, and several oscillators (Stochastic, CCI, Williams %R) are in oversold territory.
- RSI is neutral, and the MACD is mixed (bullish weekly, bearish monthly).
- Pivot points suggest support near ₹922–₹928 and resistance around ₹931–₹936.
**Fundamentals**
- FY25 net profit: ₹315 crore (+20.5% YoY); revenue: ₹1,487 crore (+19.5% YoY), driven by strong growth in APAC and US markets.
- The company is almost debt-free and has delivered 34% CAGR profit growth over five years.
- Return on equity (ROE) is strong at 23%, and ROCE is 28.6%.
- Dividend yield is 0.44%.
- The stock is considered overvalued, trading at a P/E of 51.6 and nearly 11 times book value.
**Other Points**
- Promoter holding has slightly decreased in the last quarter.
- Working capital days have increased, which could affect cash flows.
**Summary**
NEWGEN is fundamentally strong, with robust profit and revenue growth, high ROE, and almost no debt. However, the stock is currently overvalued and showing mildly bearish technical signals in the short term. Investors should be cautious at current levels and watch for a technical reversal or improved valuations before considering fresh entries.
Bullishbreakout

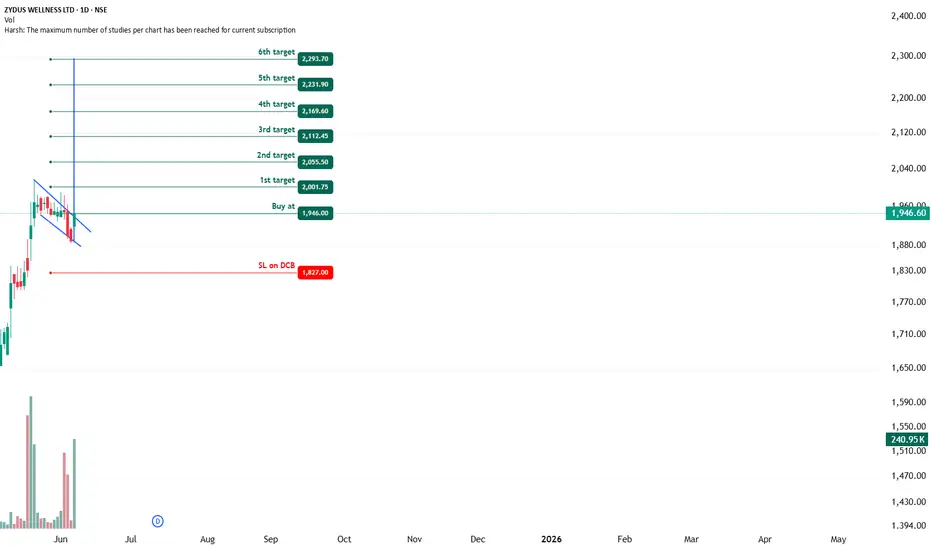
ZYDUS WELLNESS - Bullish Flag & Pole Breakout (Daily T/F)Trade Setup
📌 Stock: ZYDUS WELLNESS ( NSE:ZYDUSLIFE )
📌 Trend: Strong Bullish Momentum
📌 Risk-Reward Ratio: 1:3 (Favorable)
🎯 Entry Zone: ₹1946.00 (Breakout Confirmation)
🛑 Stop Loss: ₹1827.00(Daily Closing Basis) (-6 % Risk)
🎯 Target Levels:
₹2001.75
₹2055.50
₹2112.45
₹2169.60
₹2231.90
₹2293.70 (Final Target)
Technical Rationale
✅ Bullish Flag & Pole Breakout - Classic bullish pattern confirming uptrend continuation
✅ Strong Momentum - Daily & Weekly RSI >60 (Bullish zone)
✅ Volume Confirmation - Breakout volume 240.95K vs previous day's 20.49K (Nearly 12x surge)
✅ Multi-Timeframe Alignment - Daily and weekly charts showing strength
Key Observations
• The breakout comes with significantly higher volume, validating strength
• Well-defined pattern with clear price & volume breakout
• Conservative stop loss at recent swing low
Trade Management Strategy
• Consider partial profit booking at each target level
• Move stop loss to breakeven after Target 1 is achieved
• Trail stop loss to protect profits as price progresses
Disclaimer ⚠️
This analysis is strictly for educational purposes and should not be construed as financial advice. Trading in equities involves substantial risk of capital loss. Past performance is not indicative of future results. Always conduct your own research, consider your risk appetite, and consult a financial advisor before making any investment decisions. The author assumes no responsibility for any trading outcomes based on this information.
What do you think? Are you watching NSE:ZYDUSLIFE for this breakout opportunity? Share your views in the comments!
KEC Price ActionKEC International’s share price as of June 6, 2025, is around ₹889.25, reflecting a 2.16% increase from the previous close. Over the past month, the stock has surged by 28.8%, and it is up 6.83% in the last week, showing strong short-term momentum. However, over the last six months, the stock is down by 26.85%, indicating significant volatility in the medium term .
The company is currently trading at a price-to-earnings (P/E) ratio of 40.6 and a price-to-book (P/B) ratio of 4.33, both of which are considered high compared to the sector average P/E of 28.9. This suggests that the stock is priced at a premium relative to its peers . The dividend yield stands at 0.63% .
KEC International recently secured new orders worth ₹2,211 crore across various segments, including Transmission & Distribution, Oil & Gas Pipelines, and Cables. This has contributed to a 40% year-to-date growth in orders and strengthened its international order book. As a result, analysts maintain a ‘Buy’ rating, with target prices ranging from ₹911 to ₹998, and some suggesting a potential 10% upside from current levels .
Financially, the company’s trailing twelve-month earnings per share (EPS) has grown by 58.95% year-on-year, and the company has a market capitalization of about ₹23,295 crore . The stock hit its 52-week high at ₹1,313.25 and its 52-week low at ₹627.45, highlighting its volatility over the past year .
In summary, KEC International is showing positive short-term momentum, backed by strong order inflows and optimistic analyst ratings. However, its high valuation multiples and recent volatility suggest that investors should approach with some caution, balancing growth prospects against the premium pricing and market fluctuations .

INDIAN TELEPHONE INDUSTRIED LTD - NSE | Daily Chart📊 INDIAN TELEPHONE INDUSTRIES LTD (ITI) – NSE | Daily Chart
📅 Date: May 28, 2025
📈 Current Price: ₹309.25 (+9.99%)
📌 Ticker: NSE:ITI
🧠 Technical Analysis Overview
✅ Cup & Handle Breakout 🍵📈
Price action has formed a classic Cup & Handle pattern — a bullish continuation setup indicating a potential uptrend continuation. The breakout is confirmed with a strong bullish candle and significant volume surge today.
✅ Volume Confirmation 📊
Today’s breakout above the ₹288 resistance comes with massive volume (~11.6M), validating strong buyer interest and momentum behind the move.
📍 Key Price Levels
📌 Breakout Level:
✅ ₹288.05 (Previous resistance flipped into support)
📌 Immediate Resistance / Targets
🎯 ₹340 – ₹360 (Short-term target based on pattern projection)
🎯 ₹400+ (Medium-term upside potential if momentum sustains)
📌 Support
🟨 ₹288 (Breakout retest zone)
🟥 ₹270 (Handle support)
📈 Trade Idea
Breakout Entry: ₹290–₹305
Retest Entry: Near ₹288 (if price revisits)
Stop Loss: Below ₹270
Target 1: ₹340
Target 2: ₹360
Target 3: ₹400
⚠️ Disclaimer
This chart analysis is for educational and informational purposes only. Not financial advice. Always do your own research before investing.

Sobha Ltd's Price AnalysisSobha Ltd's share price as of late May 2025 is trading in the range of ₹1,349.60 to ₹1,386.10, with recent sessions showing minor fluctuations and a slight upward move from the previous close. Over the past year, the stock has declined by nearly 29%, though its longer-term performance remains strong, with a five-year return exceeding 600% .
From a valuation perspective, Sobha is trading at a high price-to-earnings (P/E) ratio of about 225–241, which is significantly above the industry average and suggests the stock is priced for substantial future growth or that current earnings are relatively low. Its price-to-book (P/B) ratio is also elevated, at around 4.25–5.85 times, indicating a premium to its book value. The intrinsic value estimate is much lower than the current market price, at approximately ₹538.36, suggesting the stock is overvalued by fundamental metrics .
Analyst sentiment remains largely positive, with about 76% of analysts recommending a buy and an average target price of ₹1,580.88, indicating a potential upside of around 15% from current levels. The highest analyst target is ₹2,459, while the lowest is ₹1,150, reflecting a wide range of expectations .
Recent financial trends show revenue growth over the last three quarters, with net profit margins improving but still modest. Mutual fund holdings have slightly increased, and promoter holdings remain stable, both of which are generally positive indicators. However, the company has a low interest coverage ratio and has delivered poor sales growth over the past five years, signaling some underlying financial risks .
Technically, the stock has shown short-term bearish signals, with a recent moving average crossover historically leading to declines in the following week. Despite this, the long-term outlook from analysts remains constructive, and historical data shows that Sobha has often delivered positive returns in May, with an average change of 6.85% for the month over 17 years .
In summary, Sobha Ltd's stock is currently trading at a premium, with high valuations and mixed short-term signals, but it remains favored by analysts for its long-term growth potential. Investors should weigh the optimistic forecasts against the elevated risk implied by current valuations and recent negative momentum.

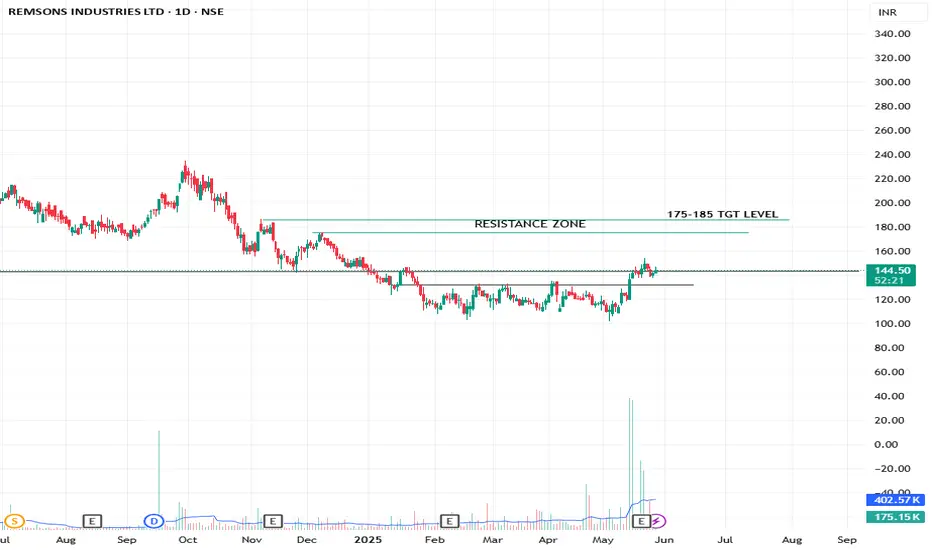
SWING/POSITIONAL PICKREMSONS INDUSTRIES LTD
TECHNICAL VIEW
Stock is shift the range and consoilidate near resistance or breakout zone. Buy 140-145 for 175-185 TGT, sl near 130 at closing basis..
FUNDAMENTAL VIEW
Quarterly/Yearly EBITDA & PAT Both Are Highest In History. ROE & ROCE Is Also Good.
I Am Not SEBI Registered Research Analyst. It Is Giving Only Educational Purpose. Trade In REMSONSIND After Discussing With Your Financial Advisor.
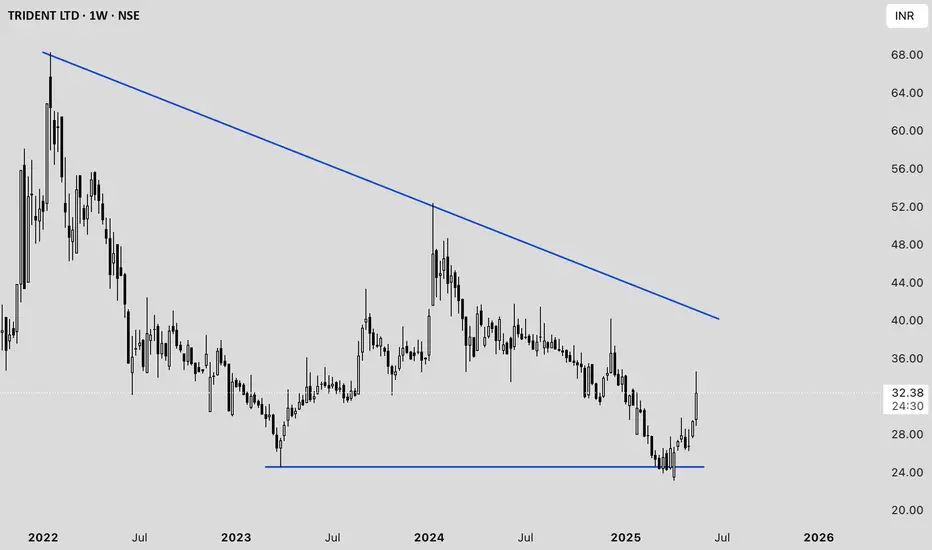
Trident Ltd. Price Analysis (as of May 23, 2025)#### **Current Price and Recent Movement**
- **Latest Price:** ₹32.11 (down 2.32% from the previous close) .
- **1-Week Return:** +9.29%
- **1-Month Return:** +9.11%
- **1-Year Return:** -15.39%
- **3-Year Return:** -32.89%
#### **Technical Analysis**
- **Buy Signal:** A 200-day moving average crossover occurred on May 21, 2025. Historically, this signal has led to an average gain of 6.61% within 30 days .
- **Momentum Indicators:**
- **RSI:** 62.17 (shows moderate bullish momentum)
- **MACD:** 0.535 (bullish signal)
- **Stochastic:** 75.40 (approaching overbought zone)
- **Supertrend:** 26.03 (bullish)
- **ROC:** 10.87 (positive momentum)
- **Analyst Sentiment:** 100% of analysts currently recommend a "Buy" with an average target price of ₹38, indicating a potential upside of ~15.6% .
#### **Fundamental Overview**
- **P/E Ratio:** 44.50–45.65 (well below the industry average of 126.09, but still high relative to earnings growth)
- **Price-to-Book Ratio:** 3.62–3.88
- **Dividend:** Announced ₹0.5 per share (record date: May 27, 2025) .
- **Net Profit Margin:** 5.78% (FY24)
- **Return on Equity:** 9.04% (FY24)
- **Debt/Equity:** 0.48 (moderate leverage)
- **Intrinsic Value Estimate:** ₹9.73 (suggests current price is at a premium to intrinsic value)
#### **Recent Financial Performance**
- **Q3 FY25 Revenue:** ₹1,667.09 crore (down 9.17% YoY)
- **Profitability:** Net profit/share for FY24 was ₹0.76, down from ₹0.83 in FY23
- **Expense Management:** Interest expense is low at 1.86% of operating revenue; employee cost is 13.2%
#### **Strengths**
- Strong technical momentum and recent bullish crossover.
- Consistent dividend payout.
- Low interest expense and moderate leverage.
#### **Weaknesses**
- Declining revenue and profit over the last few quarters.
- High valuation relative to earnings and intrinsic value.
- Long-term returns have been negative over 1 and 3 years.
#### **Outlook**
Analysts remain bullish in the short term, buoyed by technical signals and an expected price target of ₹38 . However, fundamental concerns such as declining profits, high P/E, and premium to intrinsic value warrant caution for long-term investors.
---
**Summary:**
Trident Ltd. is showing short-term bullish momentum with positive technical indicators and analyst sentiment. However, investors should be cautious due to weak long-term performance, high valuation, and recent declines in revenue and profit .
FSL price actionFirstsource Solutions Ltd (FSL) on the NSE is trading at ₹385.55 as of May 23, 2025 . The stock has shown strong performance over the past year, with a return of 87.31% and a five-year return exceeding 1,100% . FSL’s 52-week high is ₹422.30, while the 52-week low is ₹176.25 .
Recent price action shows that after peaking near its all-time high in January 2025, FSL corrected but has since rebounded sharply from the ₹320–₹330 range in early May to the current levels. Trading volumes have been robust during this rally, indicating strong market participation.
Technically, FSL is in a bullish trend, but short-term volatility remains high. Key support is seen around ₹355–₹360, while resistance is near ₹385–₹422. Sustained trading above ₹385 could open the way for a retest of the all-time high. The stock is considered high risk, being over three times as volatile as the Nifty index .
Fundamentally, FSL reported a 29.4% year-on-year revenue growth in Q4 FY25, driven by its healthcare and banking verticals. The company is focusing on client diversification and operational efficiency, with a projected 12–15% revenue growth for FY26. Its P/E ratio is 43.34 and P/B ratio is 6.96, both above the sector average, reflecting premium valuations .
In summary, FSL is in a strong uptrend with positive momentum and robust financial performance, but short-term volatility and premium valuations warrant cautious optimism for new investors .

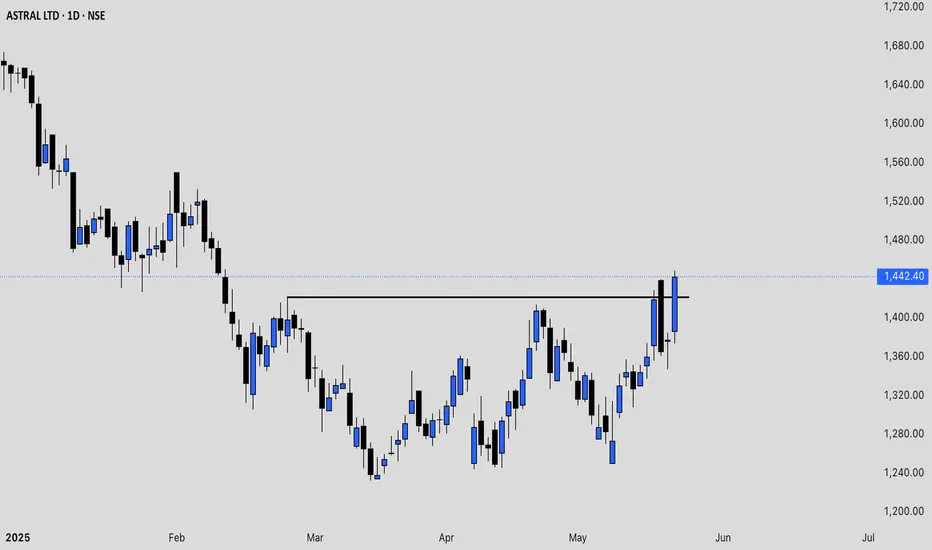
ASTRAL price action analysis Astral Ltd (ASTRAL) has shown a mix of volatility and recovery in May 2025. After a sharp decline earlier in the month, the stock rebounded, with recent prices moving from the ₹1,330–₹1,350 range up to ₹1,377.70 as of May 21, 2025. The trading volumes have remained strong, indicating active participation from both buyers and sellers.
Technically, Astral is trading above its short-term volume-weighted average price (VWAP) of around ₹1,362.9, which is a positive sign for near-term momentum . The price action over the past week has included both sharp drops and quick recoveries, suggesting a tug-of-war between bulls and bears. Oscillators and moving averages currently indicate a neutral to mildly bullish setup, with the stock having recovered from oversold levels seen earlier in May.
Astral’s 52-week high is ₹2,454, and the 52-week low is ₹1,232, showing that the current price is closer to the lower end of its yearly range . The price-to-earnings (P/E) ratio remains high (around 70), and the price-to-book (P/B) ratio is also elevated, reflecting premium valuations . The company’s fundamentals remain strong, but the high valuation and recent volatility suggest that further upside may require continued earnings growth or positive sector developments.
In summary, Astral is currently in a recovery phase after recent volatility. The technical outlook is neutral to slightly positive as long as the stock holds above the VWAP and key short-term support levels. Investors should watch for sustained moves above ₹1,380–₹1,400 for confirmation of renewed bullish momentum, while a drop below ₹1,350 could signal renewed weakness.
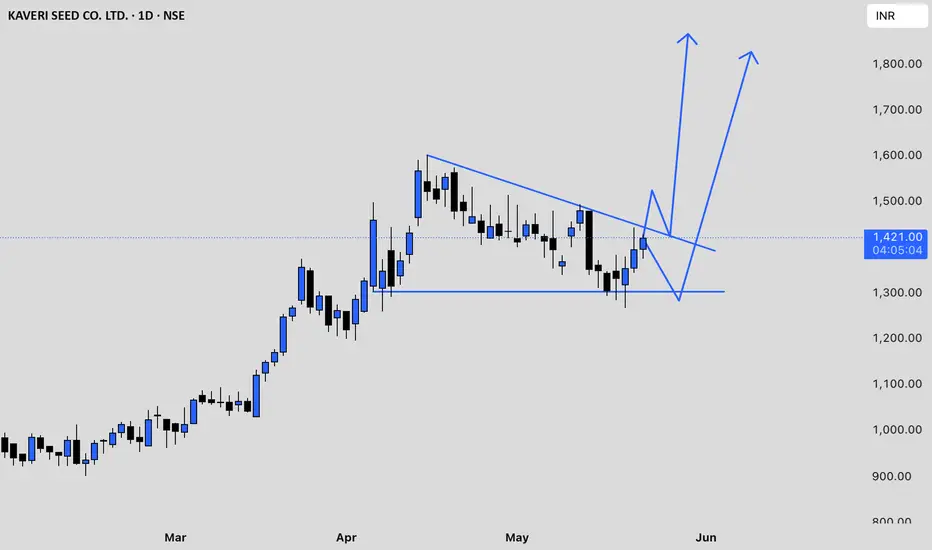
KSCL chart analysisKaveri Seed Company Ltd (KSCL) has recently experienced significant volatility. After reaching a peak above ₹1,480 in mid-May 2025, the stock corrected sharply, falling to the ₹1,305–₹1,345 range by May 16, marking a notable pullback of nearly 9% in a single session. Trading volumes have been high, indicating strong market participation during both the rally and the subsequent sell-off.
From a technical perspective, KSCL’s price remains above its 50-day, 100-day, and 200-day exponential moving averages, which suggests that the longer-term trend is still bullish. However, momentum indicators such as the Relative Strength Index (RSI) and Commodity Channel Index (CCI) are both in oversold territory, signaling that the recent correction may have been overdone and that a technical bounce could be possible if market sentiment improves. The Moving Average Convergence Divergence (MACD) is below its signal line, and the Average Directional Index (ADX) indicates the presence of a short-term downtrend.
Immediate support for KSCL is seen around ₹1,232, with further support at ₹1,174 and ₹1,116. On the upside, resistance is expected near ₹1,399, then at ₹1,457 and ₹1,515. The near-term pivot area is around ₹1,340–₹1,350.
Recent company developments—including the acquisition of a 30% stake in Aditya Agri Tech Pvt Ltd and the release of Q4 and FY25 results—may be influencing the current price action. The company has also been working to address challenges in receivables management, which could impact future performance.
In summary, KSCL is in a corrective phase after a strong rally, with oversold technical indicators suggesting potential for a short-term rebound if support holds. However, the short-term trend remains down, so traders should watch for stabilization above key support levels before considering new long positions. The longer-term outlook stays positive as long as the price remains above major moving averages, but caution is advised due to ongoing volatility and bearish momentum signals.
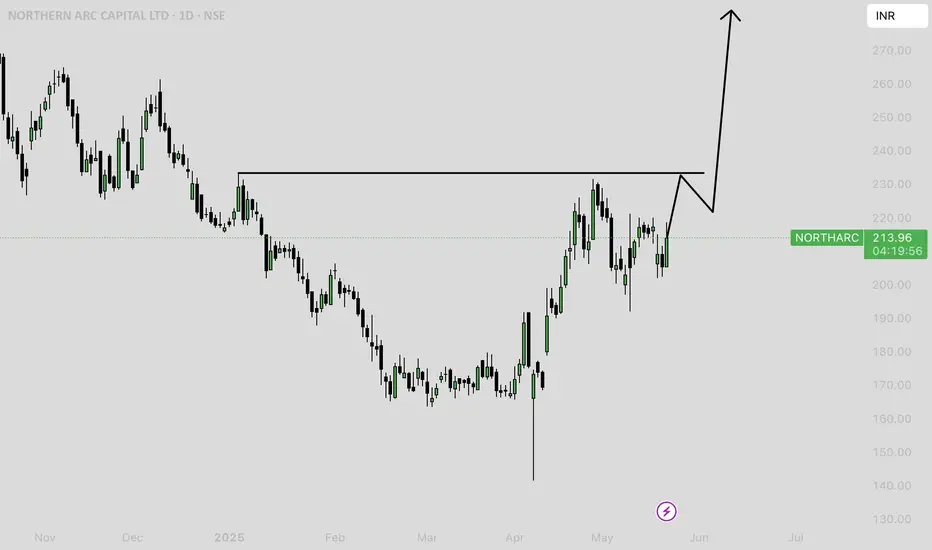
## NORTHARC Price Action Analysis
### **Recent Price Performance**
- **Current Price:** As of the latest available data, Northern Arc Capital Ltd (NORTHARC) is trading around ₹208–213.
- **Volatility:** The stock is showing a volatility of about 4.14% with a beta of 1.37, indicating higher-than-market volatility.
- **52-Week Range:** The price has ranged from a low of ₹141.47 (April 7, 2025) to a high of ₹350.00 (September 24, 2024).
- **Recent Trend:** NORTHARC has fallen by about 8% over the past week but is up nearly 14% over the past month. Over the last year, the stock is down 39% from its highs.
### **Technical Indicators**
#### **Moving Averages**
- **Short-term (20-day EMA/SMA):** Price is near or slightly below the 20-day EMA (₹201.94) and SMA (₹201.11), both indicating a neutral trend.
- **Medium-term (50-day EMA/SMA):** The price is below the 50-day EMA (₹216.61) and SMA (₹218.06), also signaling a neutral to weak trend.
#### **Oscillators**
- **RSI (14):** 34.43, indicating a downtrend and approaching oversold territory .
- **Stochastic RSI (14):** 0.41, signaling a strong downtrend.
- **CCI (14):** -97.09, also confirming a downtrend .
- **MFI:** 25.56, suggesting strong selling pressure and a strong downtrend.
#### **Support and Resistance Levels**
- **Immediate Support:** ₹188.54
- **Key Support:** ₹185.85, ₹181.19
- **Immediate Resistance:** ₹195.89
- **Next Resistance:** ₹200.55, ₹203.24
- **Pivot Level:** ₹193.2
### **Order Book and Liquidity**
- **Order Book:** There is active buying interest around ₹207–208 and selling interest around ₹210–215, indicating a tight trading range and liquidity at current levels.
- **Volume:** Trading volume is robust, with recent daily volumes exceeding 1.6 million shares.
### **Fundamental and Event Context**
- **Recent One-Time Provision:** NORTHARC recorded a significant one-time provision (impairment of ₹1,200 crore) in Q4 FY25, sharply reducing reported profits. Excluding this, underlying business performance was strong, and some analysts expect a rebound in the coming months.
- **Valuation:** The stock is trading at a price-to-book (P/B) ratio of 1.02 and a trailing P/E of 9.49, both below the sector average, suggesting attractive valuations if underlying fundamentals remain stable.
### **Technical Summary**
- **Overall Technical Rating:** Mixed signals. Moving averages are neutral, but oscillators indicate a downtrend and possible oversold conditions.
- **Short-Term Outlook:** The stock is near key support levels, with oscillators hinting at potential for a technical bounce if selling pressure abates. However, sustained weakness below ₹188 could trigger further downside.
- **Medium-Term Outlook:** Recovery potential exists if the stock holds above support and market absorbs the impact of the one-time provision.
---
**In summary:** NORTHARC is currently consolidating near its recent lows, with technical oscillators in a downtrend but approaching oversold territory. The price is below key moving averages, and significant support exists around ₹185–188. The stock may see a technical bounce if support holds, but further downside is possible if it breaks below these levels. The impact of the recent one-time provision is a key factor, with some market participants expecting a rebound as fundamentals normalize.
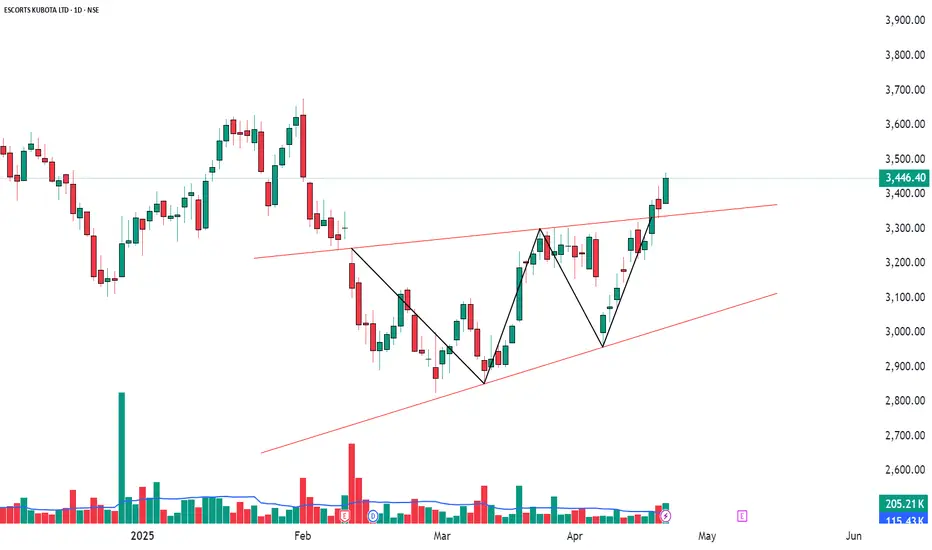
Bullish Signal with EMA Crossover and TTM SqueezeESCORTS (2.64%)
Bullish Signal with EMA and TTM Squeeze Breakout
ESCORTS shows a promising bullish setup, with a Strong Bullish Candle and an EMA 200 Crossover signaling a potential long-term trend reversal. The RSI Breakout and Bollinger Band Breakout further confirm the bullish outlook. A TTM Squeeze breakout also indicates increasing volatility, which could propel the stock further upwards.
Resistance Levels: 3482-3517-3572
Support Levels: 3392-3338-3302
Entry: @/above 3463.20
Stop Loss: @/below 3244.80
Volume Analysis: Volume has been increasing steadily, with higher than the average volume of 115.43K on 23rd April. This shows increased investor activity and potential momentum building.
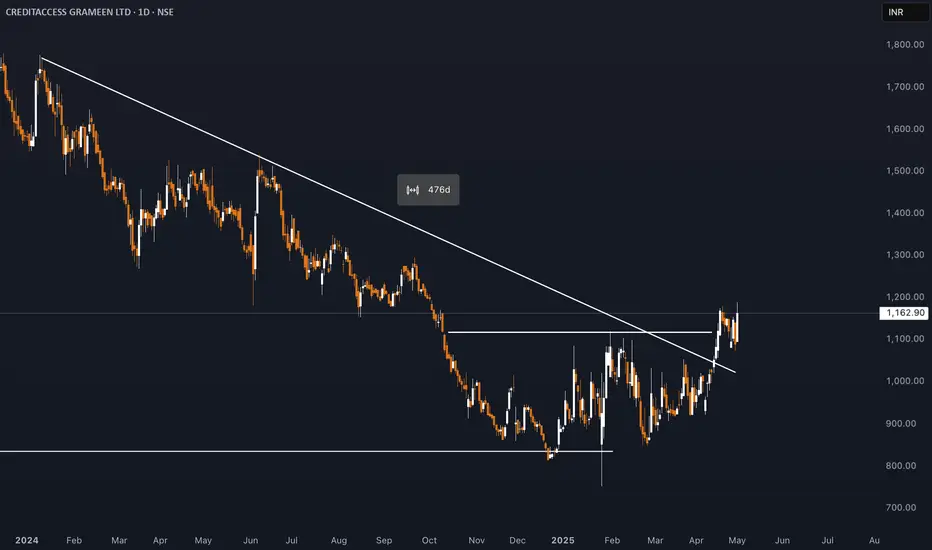
## CreditAccess Grameen (CREDITACC) Share Price Analysis- As of May 2, 2025, CreditAccess Grameen (CREDITACC) traded around ₹1,121–₹1,145, which is approximately 52% above its 52-week low of ₹750.20 (set in January 2025), but below its 52-week high of ₹1,551.95 (set in June 2024) .
- The stock has shown volatility over the past year, with a notable decline from its peak, reflecting both sector trends and company-specific events .
**Valuation and Financial Metrics**
- **P/E Ratio (TTM):** 20.3–21.2, indicating moderate valuation relative to earnings .
- **Book Value:** ₹438 per share, with the stock trading at about 2.6 times book value, which is considered on the higher side for the sector .
- **Dividend Yield:** Around 0.86–0.89%, with recent dividend payouts .
- **Return on Equity (ROE):** 24.8% (latest year), reflecting strong profitability .
- **Return on Capital Employed (ROCE):** 14.8% .
**Growth and Profitability**
- The company has delivered robust profit growth (35% CAGR over the last 5 years) and strong median sales growth (31.6% over 10 years)
- However, profit growth has turned negative in the trailing twelve months (-35%), primarily due to higher provisioning and write-offs in recent quarters
- The company reported a loss of ₹99.5 crore in Q3 FY25, mainly due to early risk recognition, conservative provisioning, and accelerated write-offs, but management expects this to safeguard future profitability as growth normalizes
**Operational Highlights**
- **Assets Under Management (AUM):** Grew by 6.1% YoY to ₹24,810 crore in Q3 FY25
- **Borrower Base:** Increased by 2.4% YoY to 48.05 lakh customers
- **Branch Network:** Expanded by 8.7% YoY to 2,059 branches
- **Collection Efficiency:** Remained robust at 93.3% (excluding arrears) and 94.1% (including arrears), with improving trends
- **Asset Quality:** PAR 90+ at 2.64%, NNPA at 1.28%, indicating some stress but manageable levels
- **Capital Adequacy:** CRAR at 25.9%, reflecting a strong capital position
**Strengths and Risks**
**Strengths:**
- Consistent long-term growth in profits and sales
- Strong capital position and liquidity buffer
- High collection efficiency and expanding branch network
**Risks/Concerns:**
- Recent decline in promoter holding (-7.42% over three years)
- Low interest coverage ratio, suggesting higher financial risk
- Elevated provisioning and write-offs impacting near-term profitability
- Stock is trading at a premium to book value, which may limit upside if growth slows
**Relative Performance**
- Over the past year, the stock is down 24%, underperforming the broader market, but over five years, it has delivered a 154% return, broadly in line with sector peers
- In the short term (last three months), the stock has rebounded by about 13% from its lows
## Summary
CreditAccess Grameen remains a leading NBFC-MFI with a strong track record of growth and profitability. While recent quarters have seen a dip in profits due to prudent risk management and provisioning, the company’s fundamentals-such as robust capital adequacy, liquidity, and operational scale-remain intact. The stock is moderately valued but carries risks related to asset quality and sector volatility. Investors should watch for normalization of growth and profitability in upcoming quarters, as indicated by management
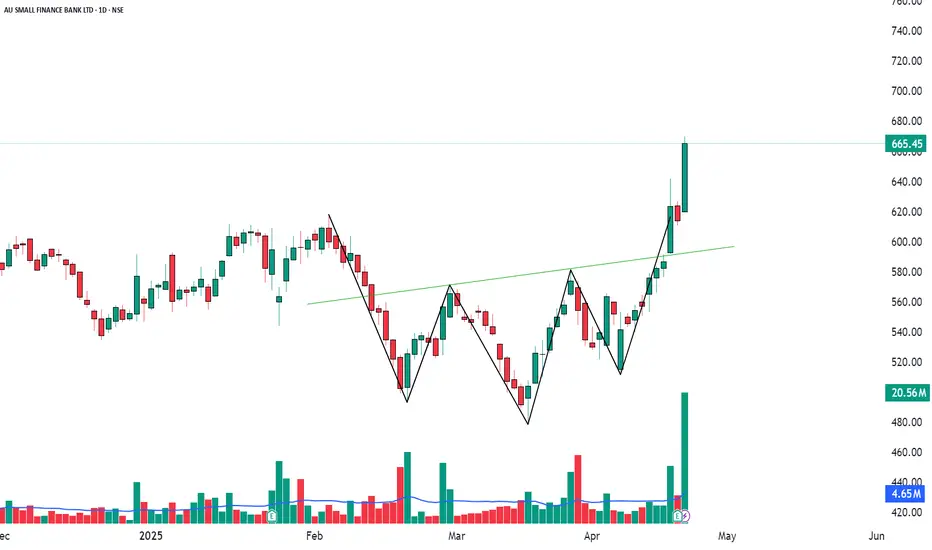
Strong Bullish Momentum and Volume SurgeAUBANK (8.41%)
Bullish Momentum Building
AUBANK is showing promising bullish signs across several technical indicators. A Bullish Marubozu candlestick has formed, complemented by an RSI Breakout, signaling a shift toward bullish momentum. The stock has broken out of the Bollinger Bands, with VWAP and Volume confirming the strength of this move.
Resistance Levels: 684-702-733
Support Levels: 634-602-584
Entry: @/above 669.90
Stop Loss: @/below 590.75
Volume Analysis: A significant volume breakout was observed on April 23rd, surpassing the average volume of 4.65M, suggesting strong market interest and buying power.
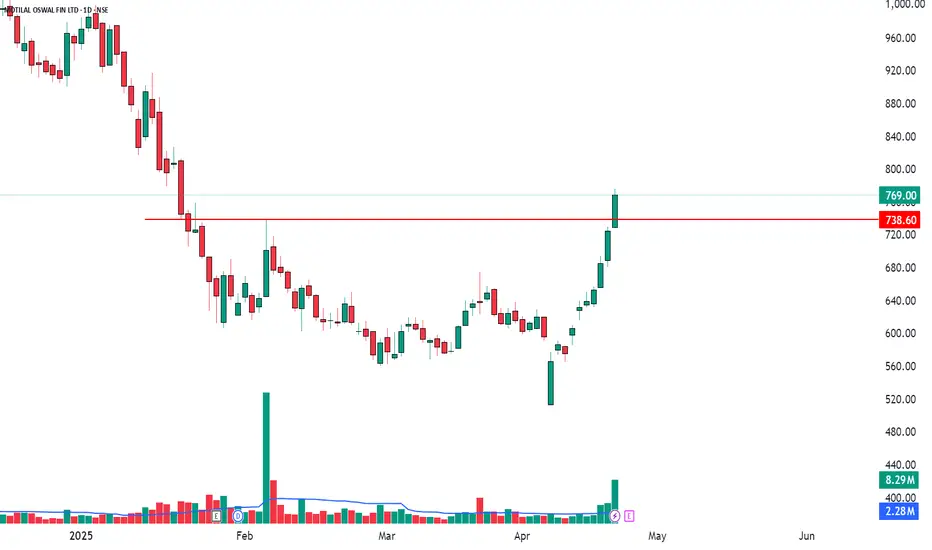
Bullish Momentum with RSI and Bollinger BreakoutMOTILALOFS (6.16%)
Bullish Trend and Breakout
MOTILALOFS is showing strong bullish momentum, with a Bullish Marubozu candlestick signaling the continuation of upward momentum. The RSI Breakout and Bollinger Band Breakout both point to an increase in buying pressure. The volume has seen a notable uptick, confirming the strength of the bullish move.
Resistance Levels: 787-805-834
Support Levels: 740-711-693
Entry: @/above 775.95
Stop Loss: @/below 653.65
Volume Analysis: Volume has been significantly higher than average, with a noticeable volume of 8.29M on 23rd April. This suggests that institutional or large players might be entering the stock.
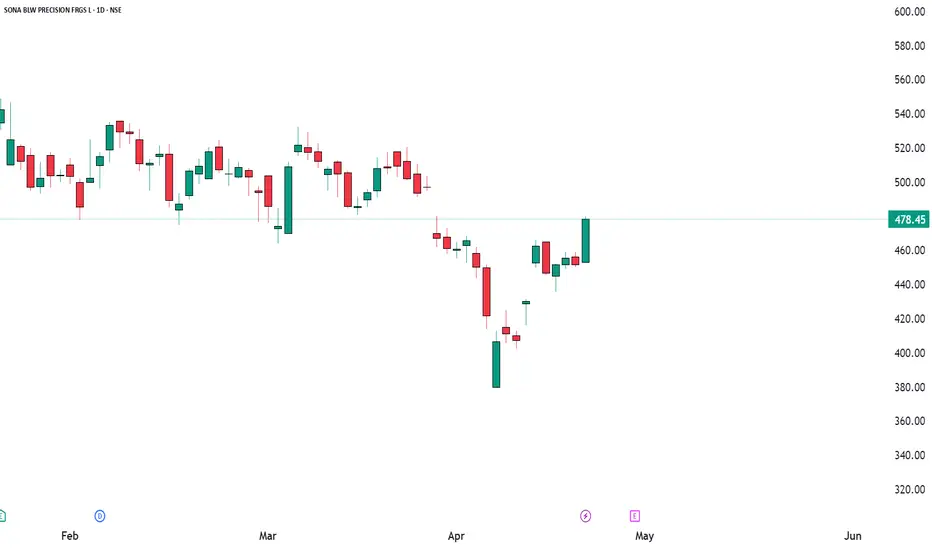
Bullish Breakout SetupSONACOMS (5.95%)
Bullish Setup Alert
We are seeing a strong bullish signal for SONACOMS, with multiple key indicators aligning for a potential breakout. A Bullish Marubozu candlestick has formed, indicating strong bullish momentum. Additionally, the RSI has broken out, signaling increasing buying strength. The SuperTrend and VWAP both confirm bullish sentiment, while the TTM Squeeze suggests a volatility breakout in the making.
Resistance Levels: 488-497-515
Support Levels: 461-444-434
Entry: @/above 479.85
Stop Loss: @/below 448.30
Volume Analysis: Volume has been robust, which could suggest accumulation and increased market interest.
ERIS Lifesciences Share Price AnalysisEris Lifesciences is currently trading in the range of ₹1,371 to ₹1,474, with the latest reported price at ₹1,474.20 as of April 23, 2025. The stock has shown strong performance over the past year, delivering a return of approximately 57%. Over the last three months, the stock is up about 9%, though it has seen a slight dip of 0.57% in the past month.
**Valuation and Fundamentals**
Eris Lifesciences trades at a price-to-earnings (P/E) ratio of 57.13, which is high for the sector, and a price-to-book (P/B) ratio of 4.53. The company’s earnings per share (EPS) stands at 29.19, and its return on equity (ROE) is 12.63%, indicating moderate profitability. The market capitalization is approximately ₹18,831 crore . The dividend yield is negligible, suggesting the company focuses more on growth than on returning cash to shareholders.
**Analyst Sentiment and Targets**
Analyst sentiment is strongly positive, with nearly 89% recommending a buy and the remainder suggesting hold; there are no sell recommendations. The average long-term price target from analysts is ₹1,512.56, indicating modest upside from current levels.
**Technical and Trading Overview**
The stock has recently traded near its upper circuit of ₹1,659.60, with a lower circuit at ₹1,106.40, reflecting a relatively wide trading band and potential for volatility. Recent trading volumes have been healthy, supporting the current price momentum.
**Summary**
Eris Lifesciences has delivered strong returns over the past year and is viewed positively by analysts. However, its high P/E ratio suggests the stock is priced for continued growth, and the lack of dividend yield may not appeal to income-focused investors. The technical outlook is stable, with the stock trading near its highs and supported by robust trading activity.

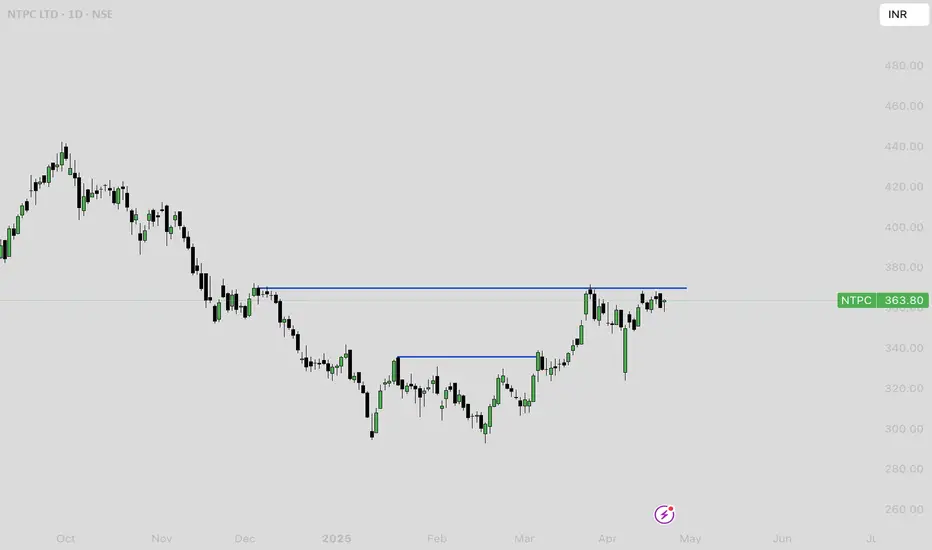
NTPC price analysisNTPC is currently trading around ₹360, having shown a modest gain of about 4% over the past year. The stock reached its all-time high of ₹448.45 in September 2024 and has since pulled back, with recent price action reflecting some consolidation after a strong multi-year rally . Over the last month, NTPC has delivered a positive return of approximately 2.5%, indicating some short-term strength despite a slight decline of nearly 1.8% in the past week.
Fundamentally, NTPC remains a large-cap, stable utility with a market capitalization near ₹3.5 lakh crore and a price-to-earnings (PE) ratio of about 15.9, which is below the industry average, suggesting reasonable valuation. The company boasts a healthy dividend yield of 2.5%, and its return on equity (ROE) stands at 13.1%. Promoter holding remains steady at 51.1%, and the company continues to report strong profits, with net profit for the latest fiscal year exceeding ₹20,000 crore.
Analyst sentiment is generally positive, with some brokerages forecasting up to 35% further upside from current levels and price targets ranging between ₹305 and ₹500 for 2025.
Technical indicators and historical trends show NTPC often delivers positive returns in April, with an average gain of about 3% for the month
In summary, NTPC is viewed as a fundamentally sound, dividend-paying stock with moderate growth prospects and reasonable valuation. While the stock is off its recent highs, the outlook remains constructive, supported by positive earnings, stable fundamentals, and favorable long-term forecasts from analysts
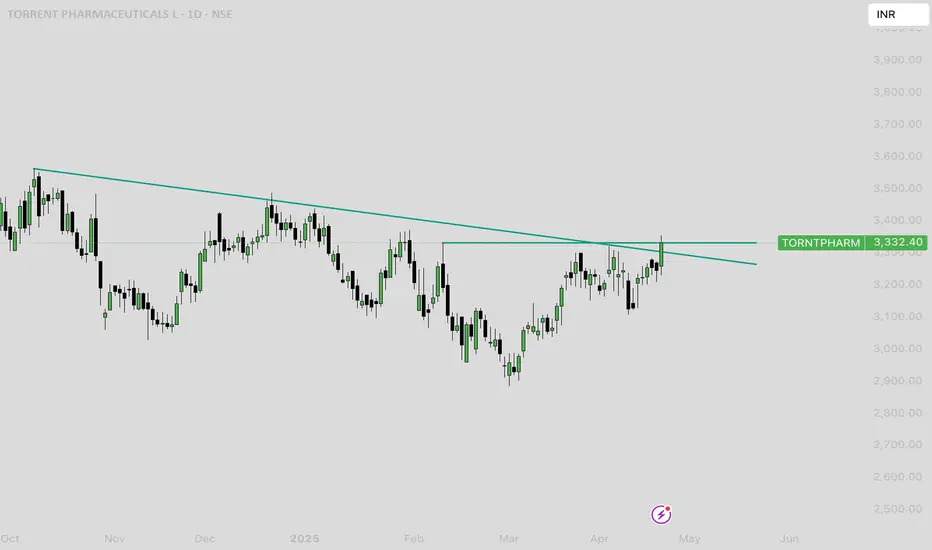
## TORNTPHARM Price AnalysisTorrent Pharmaceuticals (TORNTPHARM) is currently trading near ₹3,254, maintaining a strong uptrend over the past several years. The stock has delivered a return of approximately 165% from July 2020 to November 2024, including a stock split, highlighting its consistent long-term growth.
**Valuation and Fair Value**
TORNTPHARM is trading well above its estimated intrinsic value. Independent valuations suggest a fair value in the range of ₹1,560 to ₹1,940 per share, meaning the current market price is overvalued by about 40%. The price-to-earnings (PE) ratio stands at approximately 59–66, which is significantly higher than the sector average of around 49, indicating a premium valuation. The price-to-book (PB) ratio is also elevated at 16, compared to the sector average of 6.29.
**Recent Performance**
The stock has shown positive momentum in the short term, with returns of 3.5% over the past week and 5.7% over the past month. Over the last year, TORNTPHARM has gained nearly 28%, and over three years, the return is more than 128%. Despite some volatility, the stock has outperformed many of its peers and the broader market.
**Fundamental Trends**
Torrent Pharma’s India business, which constitutes the bulk of its revenue, grew by 12% in Q3 FY25, driven by strong performance in branded generics. However, the company faces challenges in international markets, particularly the US, due to regulatory headwinds and pricing pressures. Revenue growth over the past five years has averaged 7% annually, slightly below the industry average, but net income growth has been robust at over 30% per year, outpacing peers.
**Analyst Outlook**
Analysts have a moderately positive outlook, with a one-year price target averaging around ₹3,600, and a range between ₹2,959 and ₹4,200 . About 68% of analysts currently rate the stock as a buy.
**Dividend and Market Cap**
The dividend yield is 0.86%, which is above the sector average, and the company’s market capitalization is approximately ₹1.1 lakh crore, placing it among the larger players in the Indian pharmaceutical sector.
**Summary**
TORNTPHARM has demonstrated strong long-term price appreciation and profitability, but it is currently trading at a significant premium to its estimated intrinsic value. Short-term technicals are mixed, with some bullish undertones, but caution is warranted due to high valuation multiples. The company’s growth is primarily driven by its domestic business, while international operations face ongoing challenges. Analyst sentiment remains positive, but the upside may be limited unless earnings growth accelerates or valuation multiples contract.
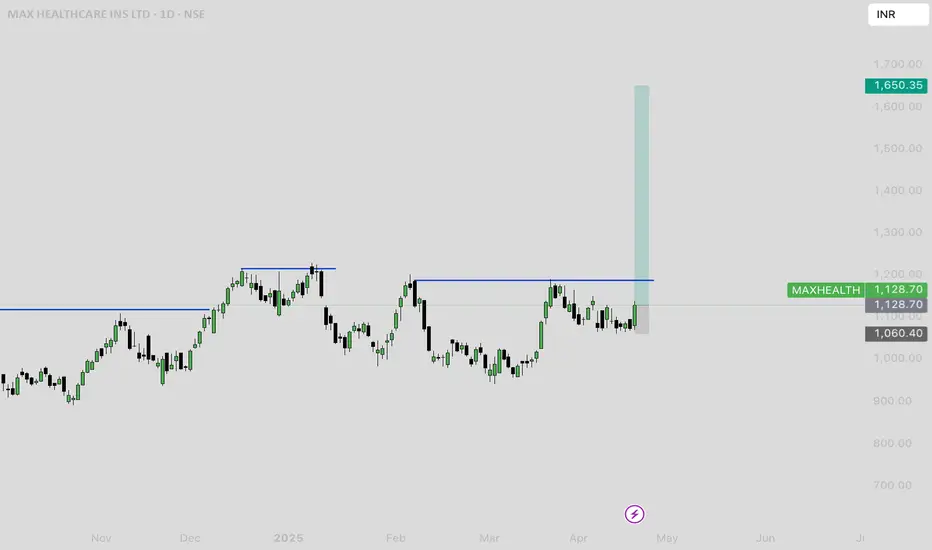
MAXHEALTH Price Chart Analysis**Current Price and Recent Performance**
- As of the latest available data, Max Healthcare Institute Ltd (MAXHEALTH) is trading around ₹1,084.40, showing a 0.64% increase in the past 24 hours
- The stock hit a high of ₹1,095.00 and a low of ₹1,066.50 in the most recent trading session, with an average traded price of ₹1,075.13
- Over the past week, the stock is down by 0.97%, but it has risen 8.23% over the past month and 30.78% over the last year
**Historical Price Levels**
- MAXHEALTH reached its all-time high of ₹1,227.95 on January 8, 2025
- The all-time low was ₹97.15, recorded on November 12, 2020
**Analyst Forecasts and Valuation**
- Analyst price targets range from a minimum of ₹615.00 to a maximum of ₹1,390.00
- The stock is trading at a price-to-earnings (PE) ratio of 100.12 and a price-to-book (PB) ratio of 12.59, which is higher than the sector averages (sector PE: 47.87, sector PB: 6.12)
- Dividend yield is low at 0.14%
**Technical and Volatility Insights**
- MAXHEALTH is 2.61 times as volatile as the Nifty index, indicating higher price swings.
- The 50-day moving average (DMA) is at ₹1,062, suggesting the current price is above this technical support level.
MAXHEALTH's valuation is high compared to peers, reflecting strong investor expectations
**Fundamental Performance**
- Revenue has grown at a compound annual rate of 27.47% over the last five years, outpacing the industry average of 10.01%
- Net profit for FY 2023-24 was ₹687 crore, with a slight decline of 1.02% compared to the previous year, despite a 22.93% rise in revenue.
- Promoter and institutional holdings have remained stable in recent quarters
**Summary**
MAXHEALTH has demonstrated robust long-term price appreciation and revenue growth, with a recent pullback from its all-time high. The stock trades at a premium valuation relative to sector peers, reflecting high growth expectations. Technicals show the stock is above key moving averages, and volatility remains elevated. Analyst targets suggest a broad range of possible outcomes, with the consensus leaning toward further upside, but caution is warranted due to the high valuation and recent profit stagnation
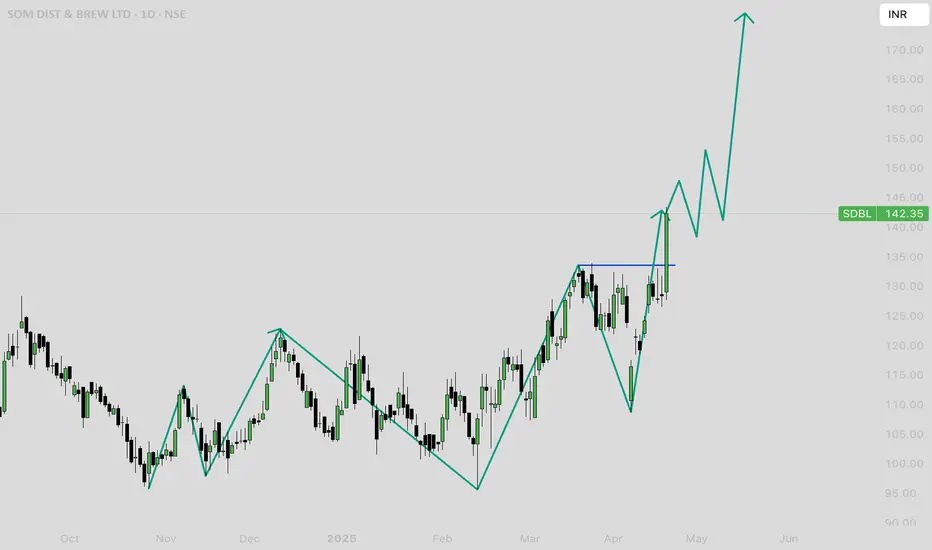
Som Distilleries & Breweries Ltd (SDBL) Price Analysis
- **Current Price:** ₹156.00 (all-time high as of April 22, 2025)
- **Day’s Range:** ₹127.66 – ₹143.40
- **Previous Close:** ₹128.38
- **Volume:** 13.36 million (well above 20-day average of 1.34 million)
- **52-Week Range:** ₹95.61 – ₹148.90 (new all-time high today)
- **VWAP:** ₹137.86
- **Market Cap:** ₹2,931 crore
### **Trend & Momentum**
- SDBL has surged sharply, breaking out to a new all-time high with exceptionally high volume, indicating strong bullish momentum
- The stock has rallied over 20% in a single session, moving far above recent resistance levels and its VWAP
- Technical patterns suggest a bullish formation with potential for further upside, possibly another 10% move, according to chartists
### **Support & Resistance**
- **Immediate Support:** ₹143.40 (today’s high), then ₹127.66 (today’s low), and ₹128.38 (previous close)
- **Resistance:** With a new all-time high at ₹156.00, the stock is in price discovery; next resistance will form as the stock trades higher
### **Valuation**
- **TTM PE:** 30.48 (sector PE: 88.54)
- **P/B:** 4.75
- **EPS (TTM):** ₹4.67 (+5.28% YoY)
- **Book Value per Share:** ₹30.02
### **Outlook**
- **Short-Term:** The breakout and volume spike suggest continued bullishness. However, after such a sharp rally, some profit booking or volatility is possible.
- **Medium-Term:** Sustained trade above ₹143–₹148 keeps the trend positive. Watch for consolidation near new highs before the next leg up.
- **Downside Risk:** If the stock falls below ₹143, it may retest support around ₹128–₹130
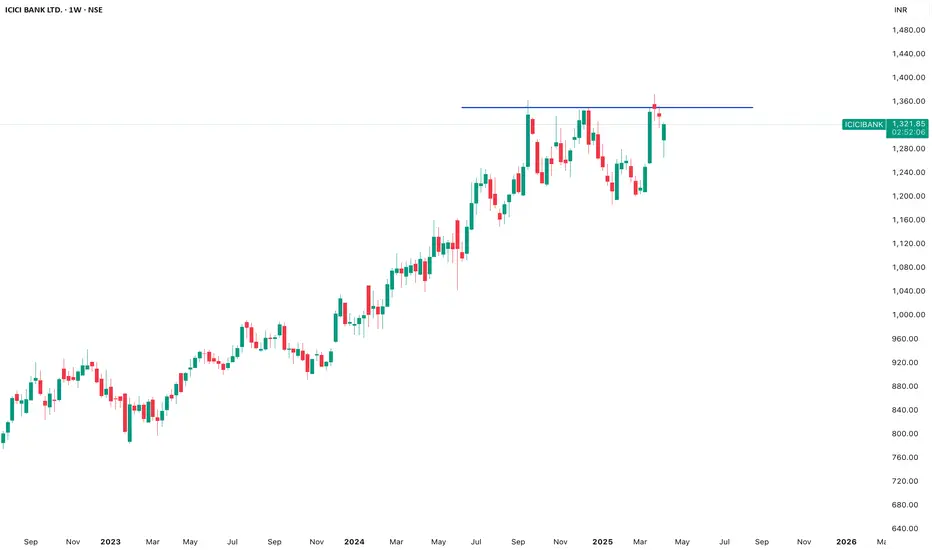
### ICICI Bank Price Analysis (April 11, 2025)### ICICI Bank Price Analysis (April 11, 2025)
#### **Current Price and Recent Trends**
- **Latest Price (April 8, 2025):** ₹1,299.90
- **Intraday Movement (April 8, 2025):**
- **Open:** ₹1,299.85
- **High:** ₹1,310.05
- **Low:** ₹1,287.35
- **Close:** ₹1,299.90 (+0.96% from the previous close).
- **52-Week Range:** ₹1,186.00 – ₹1,373.00
#### **Performance Metrics**
- **Short-Term Trends:**
- April 7, 2025: Declined by -3.58% to ₹1,287.55.
- April 4, 2025: Rose by +0.43% to ₹1,335.30.
- **Medium-Term Trends:**
- March saw fluctuations between ₹1,311 and ₹1,373.
- **Long-Term Trends:**
- ICICI Bank has shown consistent growth over the past year, supported by strong fundamentals.
#### **Fundamental Insights**
- ICICI Bank remains one of the top-performing private sector banks in India:
- **Market Cap:** Over ₹9 lakh crore.
- **P/E Ratio:** Competitive compared to peers in the banking sector.
- **Strong Asset Quality:** Stable NPA ratios and robust loan growth.
#### **Technical Analysis**
- **Support Levels:** ₹1,287 (recent low) and ₹1,265 (strong support from April trends).
- **Resistance Levels:** ₹1,310–₹1,320 (near-term resistance).
- **Moving Averages:**
- Trading slightly below the SMA20 but above SMA50 indicates potential consolidation before further movement.
- **Momentum Indicators:**
- RSI suggests neutral momentum with room for upward movement if market sentiment improves.
#### **Sector Outlook**
The banking sector is expected to benefit from:
- Increased credit growth due to economic recovery.
- Stable interest rate environment supporting profitability.
#### **Strengths**
1. Consistent performance despite market volatility.
2. Strong fundamentals with diversified revenue streams.
3. Resilient asset quality and loan book growth.
#### **Weaknesses**
1. Short-term volatility due to global banking uncertainties.
2. Resistance near ₹1,310 may limit upside in the immediate term.
### Conclusion:
ICICI Bank remains a strong long-term investment option due to its robust fundamentals and leadership in the private banking space. However, short-term traders should monitor resistance levels around ₹1,310 and support near ₹1,287 for trading opportunities.
### Bajaj Finance Price Analysis (April 11, 2025)### Bajaj Finance Price Analysis (April 11, 2025)
#### **Current Price and Recent Trends**
- **Latest Price:** ₹8,727.10 (as of April 9, 2025)
- **Intraday Movement (April 4, 2025):**
- **Open:** ₹8,656.00
- **High:** ₹8,797.00
- **Low:** ₹8,583.80
- **Close:** ₹8,718.85
- **52-Week Range:** ₹6,500 – ₹9,974
#### **Performance Metrics**
- **Short-Term Returns:**
- Past Week: -4.48%
- Past Month: +0.85%
- **Medium-Term Returns:**
- Past 3 Months: +17.71%
- Past 6 Months: +20.90%
- **Long-Term Returns:**
- Past Year: +19.71%
- Past 5 Years: +286.93%
#### **Fundamental Insights**
- **Market Cap:** ₹543,171 crore
- **P/E Ratio:** 33.85 (TTM)
- **Dividend Yield:** 0.42%
- **ROCE (Return on Capital Employed):** 11.14%
- **Assets Under Management (AUM):** Grew by 26% YoY to ₹416,750 crore as of March 31, 2025
#### **Sector and Peer Comparison**
- Bajaj Finance is the top performer in the financial services sector with a robust YTD return of +29% as of April 8, 2025
- Peers like SBI Cards (+27%) and Aavas Financiers (+24%) also showed strong growth due to prudent asset management and loan growth
#### **Technical Indicators**
- **Moving Averages:**
- Price is above the SMA20 (₹8,651), indicating bullish momentum .
- **Bollinger Bands:**
- Upper Band: ₹9,149
- Lower Band: ₹8,153
- The stock is trading near the upper range of Bollinger Bands, suggesting potential resistance at higher levels .
- **Momentum Indicators:**
- RSI: BUY signal with strong momentum.
- MACD: BUY signal for short-term gains.
- **Volume Analysis:** High trading volume indicates strong investor interest but also suggests selling pressure building up in the short term .
#### **Strengths**
1. Strong revenue growth driven by a diversified lending portfolio across retail, SME, and commercial customers.
2. Robust YTD returns (+29%), outperforming peers and sector indices .
3. Consistent growth in AUM (+26% YoY) and deposits (+19% YoY) .
#### **Weaknesses**
1. High P/E ratio (33.85) suggests overvaluation compared to historical averages and peers.
2. Short-term price volatility (-4.48% in the past week) indicates potential consolidation or correction.
#### **Outlook and Forecast**
- Analysts expect continued growth driven by strong customer additions (+4.7 million in Q4 FY25) and increased loan disbursements.
- Resistance levels are near ₹9,000–₹9,100; support levels are around ₹8,600–₹8,700.
- Long-term investors may benefit from holding due to consistent performance and robust fundamentals.
### Conclusion:
Bajaj Finance remains a leader in the financial services sector with strong growth metrics and solid fundamentals. However, its high valuation and recent price volatility suggest caution for short-term traders while offering long-term potential for investors focused on consistent returns and sector leadership.
