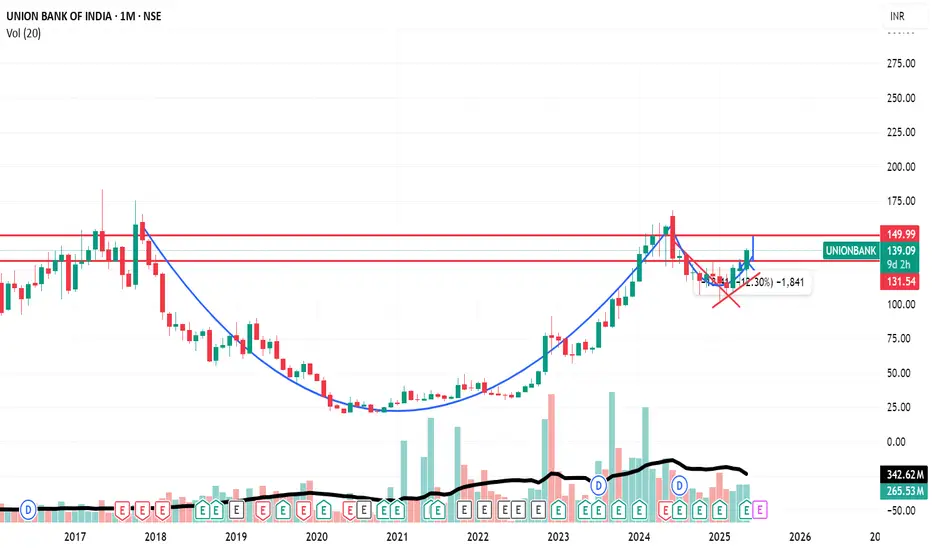
Union Bank Cup and Handle breakout with double bottom on daily.Union bank is about to breakout of a cup and handle pattern with strong signals of breakout of double bottom on a daily timeframe. Good script to invest.
Bullishpattern
Coal India Bullish Set upThe stock has been in downtrend and now took a pause with strong accumulation on the lower base
Bullish Set up
Looks like a W formation breakout
SL of 395s zone
Target 1 425s zone
Target 2 445s zone

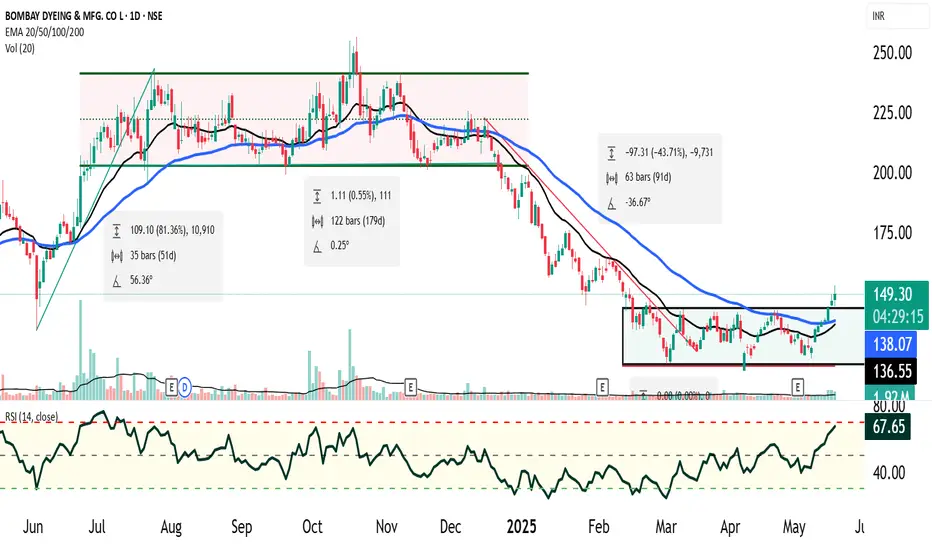
Bombay Dyeing : Market Cycle Recap✅ 1. Markup Phase (4 June 2024 – 25 July 2024)
Price movement: ~80% rally.
1. RSI behavior: RSI stayed above neutral (never oversold), frequently nearing overbought.
2. Volume: Increasing — confirmation of strong upside momentum.
3. Participants: Smart money and institutions led the rally.
🚨 2. Distribution Phase (~6 Months)
Price action: Sideways movement in a 20% range
1. Volume: Likely choppy or decreasing, with spikes on down days — a classic distribution sign.
2. RSI: Range-bound between 40–60 — no trend, loss of momentum.
3. Participants: Institutions unloading to retail/inexperienced participants.
🔻 3. Markdown Phase
Breakdown: Support breached after distribution range.
1. Price movement: Dropped ~50% from support breakout.
2. RSI: Frequently oversold — sign of strong weakness.
3. Volume: Likely increased on down days — panic selling.
🧱 4. Accumulation Phase (Last 3 Months)
Price action: Consolidated in ~15% narrow range.
1. RSI: Did not touch oversold zone — indicates seller exhaustion.
2. Participants: Value investors, smart money slowly building positions.
3. Volume: Gradually increasing — early signs of interest.
🔔 Current Technical Signal (20 May 2025)
Breakout: Price has now closed above the resistance of the accumulation range.
Volume: Above-average — confirms breakout strength.
1. RSI: Approaching overbought zone — sign of bullish momentum returning.
2. Price is above 20 EMA and 50 EMA.
3. Expected bullish crossover or confirmation already happened.
📊 Interpretation: Strong Bullish Reversal in Progress
Smart money has likely finished accumulating. Breakout from the accumulation zone with volume, RSI trend, and moving average confirmations all suggest the early stage of a new markup phase is starting. This could be the start of a fresh uptrend or the first leg of a longer bullish swing, especially if:
Broader market supports cyclical or value stocks.
Company-specific fundamentals (earnings, business outlook) align with technical cues.
✅ Actionable Steps (Not Financial Advice)
Entry:
Traders: Consider entry near breakout retest (if occurs).
Investors: Start building position gradually if long-term reversal is confirmed.
Risk Management:
Stop-loss: Just below the accumulation range (tight) or recent swing low (looser).
Position sizing based on volatility and risk appetite.
Targets:
Near-term: 15–20% move based on accumulation range height.
Medium-term: 50–80% potential if this is a true markup phase (mirroring last cycle).
Confirmation Factors:
Look for increasing volume in subsequent up candles.
Weekly close above breakout zone.
Fundamental support (news, earnings upgrade, insider buying, etc.).
If you'd like, I can also:
Draw a price cycle chart based on your description.
Help you draft a trade plan or investment thesis.
Pull recent news or updates on Bombay Dyeing (using live data).
Let me know how you'd like to proceed!
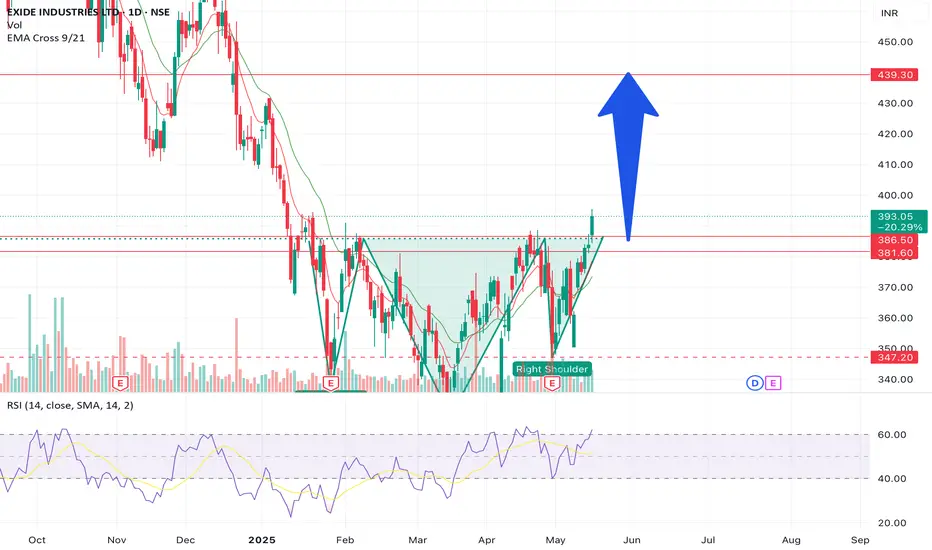
Exide Industies set for minimum 10% up moveIt has broken the neckline of H&S pattern with a bullish engulfing candle. The expected upside may be till 439. The price can come to test the level of 386 - 382 level. Good buy option keeping short term view on upside.
RELIANCE INDUSTRIES - Bullish Flag & Pole Breakout (Daily T/F)Trade Setup
📌 Stock: Reliance Industries ( NSE:RELIANCE )
📌 Trend: Strong Bullish Momentum
📌 Risk-Reward Ratio: 1:3 (Favorable)
🎯 Entry Zone: ₹1454 (Breakout Confirmation)
🛑 Stop Loss: ₹1373 (Daily Closing Basis) (~5.6% Risk)
🎯 Target Levels:
₹1499.70
₹1546.85
₹1595.45
₹1648.50
₹1697.00 (Final Target)
Technical Rationale
✅ Bullish Flag & Pole Breakout - Classic bullish pattern confirming uptrend continuation
✅ Strong Momentum - Daily & Weekly RSI >60 (Bullish zone)
✅ Golden Crossover - 50 DEMA crossed above 200 DEMA
✅ Volume Confirmation - Breakout volume 20.18M vs previous day's 5.57M (Nearly 4x surge)
✅ Multi-Timeframe Alignment - Daily and weekly charts showing strength
Key Observations
• The breakout comes with significantly higher volume, validating strength
• Well-defined pattern with clear price & volume breakout
• Conservative stop loss at recent swing low
Trade Management Strategy
• Consider partial profit booking at each target level
• Move stop loss to breakeven after Target 1 is achieved
• Trail stop loss to protect profits as price progresses
Disclaimer ⚠️
This analysis is strictly for educational purposes and should not be construed as financial advice. Trading in equities involves substantial risk of capital loss. Past performance is not indicative of future results. Always conduct your own research, consider your risk appetite, and consult a financial advisor before making any investment decisions. The author assumes no responsibility for any trading outcomes based on this information.
What do you think? Are you watching NSE:RELIANCE for this breakout opportunity? Share your views in the comments!

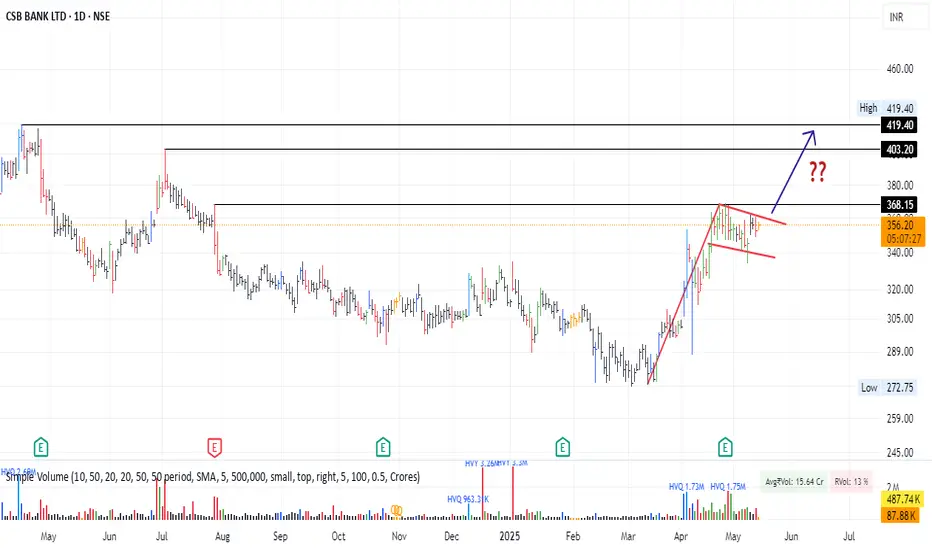
Is CSB Bank ready fo 420 and above levels ?? Looks like a good Flag Structure in making.. Stock moved a nice 20+% on decent volumes. now consolidating..
SRF LTD - Weekly
Pattern: The chart shows a very long period of Box Consolidation or a Rectangular Range. The price has been trading within a broad range roughly between 2,060 and 2,700 from late 2021/early 2022 until early 2025.
Breakout: In early 2025, the stock has decisively broken out above the upper boundary of this multi-year consolidation range (around 2,700).
Volume: There's a significant increase in volume accompanying the breakout, which is a strong bullish confirmation.
Target: The height of the consolidation box (approximately 658.50 points) is projected upwards from the breakout point. This suggests a target of around 3,358.60.
Support: The upper boundary of the consolidation range (around 2,700) is now a very strong support level.
Resistance: The immediate resistance is the recent high around 3,060.35. The primary target is 3,358.60.
Interpretation: The breakout from a multi-year consolidation on a weekly chart is a very significant bullish development. This suggests the beginning of a new, potentially strong uptrend. The stock is likely to head towards its target of 3,358.60, with the 2,700 level acting as a robust base.

DLFHello & welcome to this analysis
In the hourly time frame after a steep correction followed by consolidation its now on the verge of an Inverse Head & Shoulder breakout above 695 for probable upward levels of 740 & 800.
It has very good support near 670 as shown by the Ichimoku Kumo
All the best

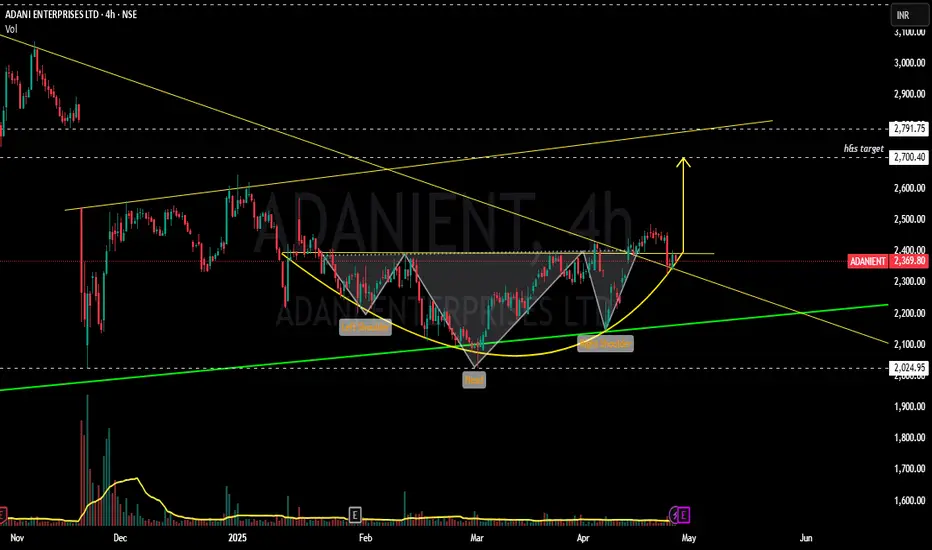
ADANIENT - Bulls getting ready to bump up ?????!!!Y essss!!! !
Chart patterns inculcating me the above titled opinion.
1. Monthly timeframe shows the symmetrical triangle pattern from 2020 till now, now the stock at support line(chart image shown below)
2. Weekly time frame shows us the INSIDE BAR candlestick pattern(mother baby pattern) with good volumes....with the low umtested till now.(made the low of 2025 on 22 nov 2024)
3. Daily time frame shows the Breakout attempt out of the 11 month old trendline.
4. Now, with the results on may 1, we can expect a volatile move.... .with the inverted h&s pattern around the corner.
Voluminous Entry can be made after the BREAKOUT WITH GOOD VOLUMES...
will update once the breakout happens.
Just add it to your watchlist and keep an eye on it.
THIS IS JUST MY OPINION..NOT A TIP NOR ADVICE.
Thank you .
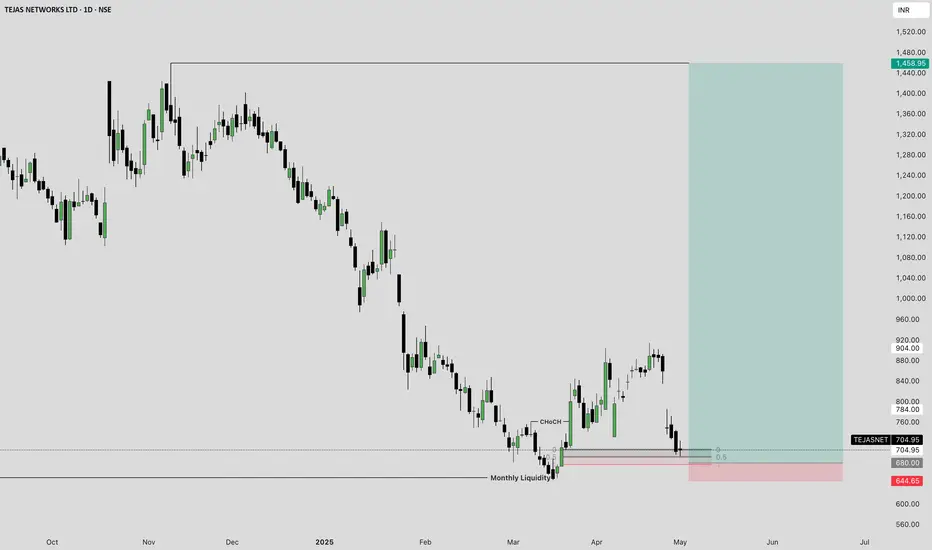
Tejas Networks: Bullish Reversal at Key Support, Targeting 1,450Trading Idea:
Stock: Tejas Networks Ltd (TEJASNET)
Timeframe: Daily (1D)
Current Price: 704.95 INR
Key Levels:
Monthly Liquidity Zone: Support at around 644.65 INR.
Target Zone: Potential upside towards 1,440.00 INR to 1,458.95 INR.
Trade Setup:
Entry: Buy around 644.65 INR (near the support level) for a possible bounce, especially if the price confirms a reversal from this level.
Stop Loss: Place a stop just below 644.65 INR, considering it’s a key support zone.
Target: Aim for the price to reach the target zone between 1,440 INR to 1,458.95 INR. Watch for price action at these levels for possible further action.
Reasoning:
The chart shows a strong sell-off followed by a potential reversal at monthly liquidity support.
The CHoCH (Change of Character) pattern suggests a shift in trend direction, which could provide an opportunity for an upward move.
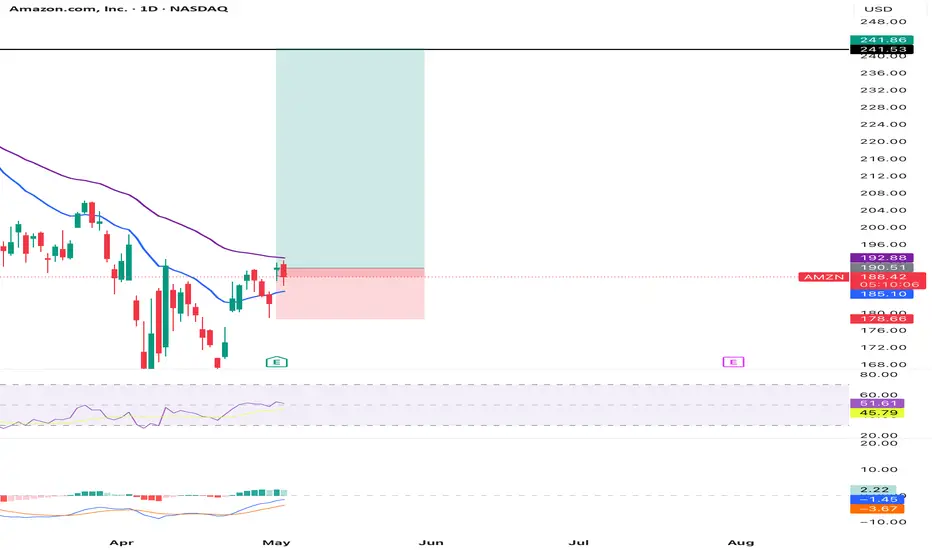
Amazon (AMZN) Swing Trade Analysis## Amazon (AMZN) Swing Trade Analysis
**Timeframe: 4H Chart (as per your screenshot, May 2, 2025)**
---
### **Technical Overview**
#### **1. Price Structure**
- **Trend:** The chart shows a recent reversal from a downtrend, with price making higher lows and attempting to break resistance around $190–$192.
- **Support:** Strong support is visible near $178.66 and a major support at $162.49.
- **Resistance/Target:** The green zone targets the $241.53–$241.86 area, which is a previous supply/resistance zone.
#### **2. Indicators**
- **RSI (Relative Strength Index):**
- Currently around 57–58, which is neutral-bullish and not overbought.
- Indicates there’s still room for upside before becoming overbought (>70).
- **MACD:**
- Bullish crossover recently, with the MACD line above the signal line and positive histogram.
- Suggests momentum is shifting to the upside.
#### **3. Risk/Reward**
- **Entry:** Around $189.67 (current price).
- **Stop Loss:** Below $178.66 (recent swing low/support).
- **Target:** $241.53–$241.86 (previous resistance).
- **Risk/Reward Ratio:**
- Risk: ~$11 (from $189.67 to $178.66)
- Reward: ~$52 (from $189.67 to $241.53)
- **R:R ≈ 1:4.7** - Excellent for swing trading.
#### **4. Volume & Volatility**
- Amazon is highly liquid, ensuring good fills and manageable slippage.
- The volatility is suitable for swing trading, with clear price swings and defined levels.
---
### **Why AMZN is Suitable for Swing Trading Now**
- **Clear Reversal Structure:** The downtrend has paused, and higher lows are forming-a classic swing setup.
- **Defined Support/Resistance:** Well-established levels allow for precise stop and target placement.
- **Strong Risk/Reward:** The setup offers a high R:R ratio, which is ideal for swing trades.
- **Momentum Confirmation:** Both RSI and MACD support a potential bullish move.
- **No Immediate Overbought Signal:** RSI is not yet overbought, so there’s room for the trade to develop.
- **Earnings Passed:** The last earnings event is behind, reducing the risk of surprise volatility.
---
### **Potential Risks**
- **If price fails to break $192–$195 resistance, a pullback to support ($178.66) is possible.**
- **Broader market weakness or negative news could invalidate the setup.**
- **Always use a stop loss as planned.**
---
## **Conclusion & Recommendation**
**Yes, AMZN is a strong candidate for a swing trade at this moment.**
- The technicals, risk/reward, and liquidity all align for a textbook swing setup.
- Enter above $190 with a stop below $178.66 and target $241+.
- Monitor for confirmation of breakout above $192–$195 for added conviction.
**(As always, manage your position size and risk according to your prop firm’s rules!)**
---
**Would you like a similar analysis for any other stock?**
Sources
image.jpg pplx-res.cloudinary.com
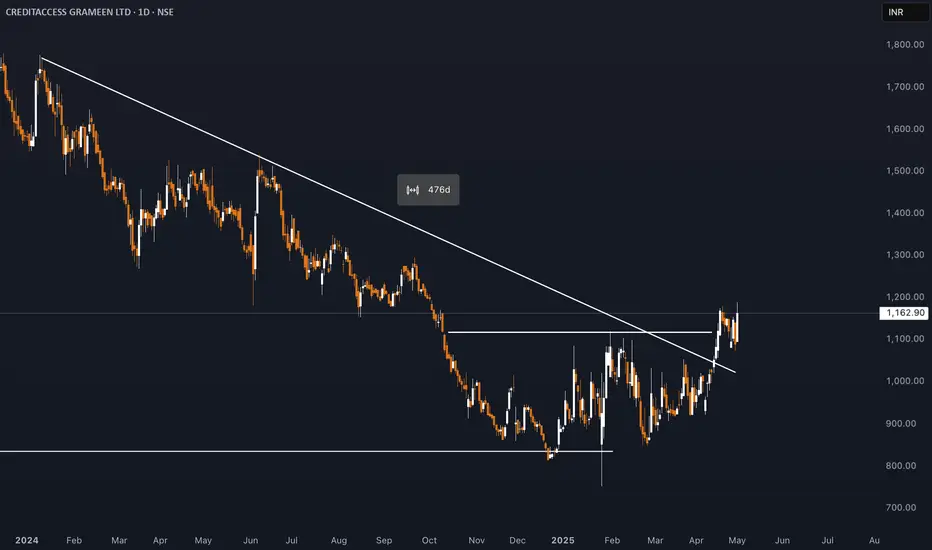
## CreditAccess Grameen (CREDITACC) Share Price Analysis- As of May 2, 2025, CreditAccess Grameen (CREDITACC) traded around ₹1,121–₹1,145, which is approximately 52% above its 52-week low of ₹750.20 (set in January 2025), but below its 52-week high of ₹1,551.95 (set in June 2024) .
- The stock has shown volatility over the past year, with a notable decline from its peak, reflecting both sector trends and company-specific events .
**Valuation and Financial Metrics**
- **P/E Ratio (TTM):** 20.3–21.2, indicating moderate valuation relative to earnings .
- **Book Value:** ₹438 per share, with the stock trading at about 2.6 times book value, which is considered on the higher side for the sector .
- **Dividend Yield:** Around 0.86–0.89%, with recent dividend payouts .
- **Return on Equity (ROE):** 24.8% (latest year), reflecting strong profitability .
- **Return on Capital Employed (ROCE):** 14.8% .
**Growth and Profitability**
- The company has delivered robust profit growth (35% CAGR over the last 5 years) and strong median sales growth (31.6% over 10 years)
- However, profit growth has turned negative in the trailing twelve months (-35%), primarily due to higher provisioning and write-offs in recent quarters
- The company reported a loss of ₹99.5 crore in Q3 FY25, mainly due to early risk recognition, conservative provisioning, and accelerated write-offs, but management expects this to safeguard future profitability as growth normalizes
**Operational Highlights**
- **Assets Under Management (AUM):** Grew by 6.1% YoY to ₹24,810 crore in Q3 FY25
- **Borrower Base:** Increased by 2.4% YoY to 48.05 lakh customers
- **Branch Network:** Expanded by 8.7% YoY to 2,059 branches
- **Collection Efficiency:** Remained robust at 93.3% (excluding arrears) and 94.1% (including arrears), with improving trends
- **Asset Quality:** PAR 90+ at 2.64%, NNPA at 1.28%, indicating some stress but manageable levels
- **Capital Adequacy:** CRAR at 25.9%, reflecting a strong capital position
**Strengths and Risks**
**Strengths:**
- Consistent long-term growth in profits and sales
- Strong capital position and liquidity buffer
- High collection efficiency and expanding branch network
**Risks/Concerns:**
- Recent decline in promoter holding (-7.42% over three years)
- Low interest coverage ratio, suggesting higher financial risk
- Elevated provisioning and write-offs impacting near-term profitability
- Stock is trading at a premium to book value, which may limit upside if growth slows
**Relative Performance**
- Over the past year, the stock is down 24%, underperforming the broader market, but over five years, it has delivered a 154% return, broadly in line with sector peers
- In the short term (last three months), the stock has rebounded by about 13% from its lows
## Summary
CreditAccess Grameen remains a leading NBFC-MFI with a strong track record of growth and profitability. While recent quarters have seen a dip in profits due to prudent risk management and provisioning, the company’s fundamentals-such as robust capital adequacy, liquidity, and operational scale-remain intact. The stock is moderately valued but carries risks related to asset quality and sector volatility. Investors should watch for normalization of growth and profitability in upcoming quarters, as indicated by management
ERIS Lifesciences Share Price AnalysisEris Lifesciences is currently trading in the range of ₹1,371 to ₹1,474, with the latest reported price at ₹1,474.20 as of April 23, 2025. The stock has shown strong performance over the past year, delivering a return of approximately 57%. Over the last three months, the stock is up about 9%, though it has seen a slight dip of 0.57% in the past month.
**Valuation and Fundamentals**
Eris Lifesciences trades at a price-to-earnings (P/E) ratio of 57.13, which is high for the sector, and a price-to-book (P/B) ratio of 4.53. The company’s earnings per share (EPS) stands at 29.19, and its return on equity (ROE) is 12.63%, indicating moderate profitability. The market capitalization is approximately ₹18,831 crore . The dividend yield is negligible, suggesting the company focuses more on growth than on returning cash to shareholders.
**Analyst Sentiment and Targets**
Analyst sentiment is strongly positive, with nearly 89% recommending a buy and the remainder suggesting hold; there are no sell recommendations. The average long-term price target from analysts is ₹1,512.56, indicating modest upside from current levels.
**Technical and Trading Overview**
The stock has recently traded near its upper circuit of ₹1,659.60, with a lower circuit at ₹1,106.40, reflecting a relatively wide trading band and potential for volatility. Recent trading volumes have been healthy, supporting the current price momentum.
**Summary**
Eris Lifesciences has delivered strong returns over the past year and is viewed positively by analysts. However, its high P/E ratio suggests the stock is priced for continued growth, and the lack of dividend yield may not appeal to income-focused investors. The technical outlook is stable, with the stock trading near its highs and supported by robust trading activity.

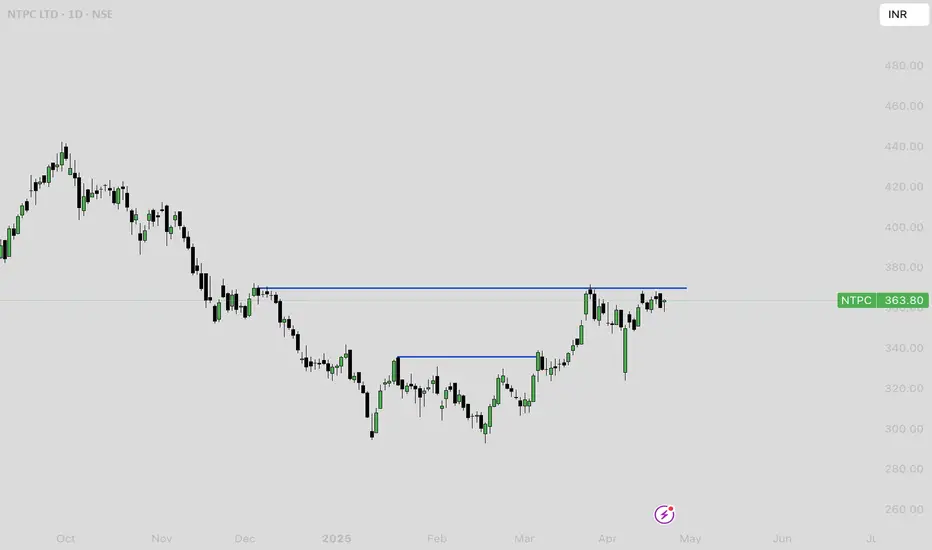
NTPC price analysisNTPC is currently trading around ₹360, having shown a modest gain of about 4% over the past year. The stock reached its all-time high of ₹448.45 in September 2024 and has since pulled back, with recent price action reflecting some consolidation after a strong multi-year rally . Over the last month, NTPC has delivered a positive return of approximately 2.5%, indicating some short-term strength despite a slight decline of nearly 1.8% in the past week.
Fundamentally, NTPC remains a large-cap, stable utility with a market capitalization near ₹3.5 lakh crore and a price-to-earnings (PE) ratio of about 15.9, which is below the industry average, suggesting reasonable valuation. The company boasts a healthy dividend yield of 2.5%, and its return on equity (ROE) stands at 13.1%. Promoter holding remains steady at 51.1%, and the company continues to report strong profits, with net profit for the latest fiscal year exceeding ₹20,000 crore.
Analyst sentiment is generally positive, with some brokerages forecasting up to 35% further upside from current levels and price targets ranging between ₹305 and ₹500 for 2025.
Technical indicators and historical trends show NTPC often delivers positive returns in April, with an average gain of about 3% for the month
In summary, NTPC is viewed as a fundamentally sound, dividend-paying stock with moderate growth prospects and reasonable valuation. While the stock is off its recent highs, the outlook remains constructive, supported by positive earnings, stable fundamentals, and favorable long-term forecasts from analysts
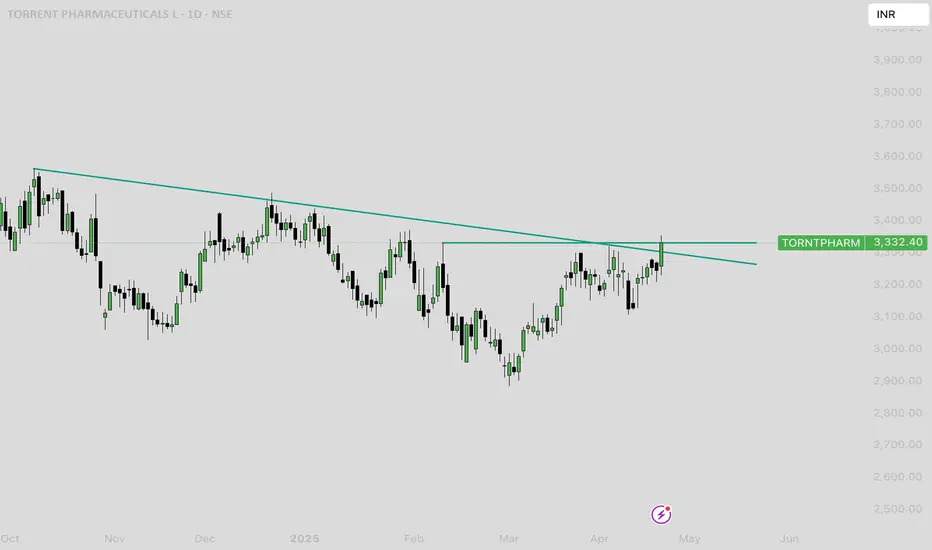
## TORNTPHARM Price AnalysisTorrent Pharmaceuticals (TORNTPHARM) is currently trading near ₹3,254, maintaining a strong uptrend over the past several years. The stock has delivered a return of approximately 165% from July 2020 to November 2024, including a stock split, highlighting its consistent long-term growth.
**Valuation and Fair Value**
TORNTPHARM is trading well above its estimated intrinsic value. Independent valuations suggest a fair value in the range of ₹1,560 to ₹1,940 per share, meaning the current market price is overvalued by about 40%. The price-to-earnings (PE) ratio stands at approximately 59–66, which is significantly higher than the sector average of around 49, indicating a premium valuation. The price-to-book (PB) ratio is also elevated at 16, compared to the sector average of 6.29.
**Recent Performance**
The stock has shown positive momentum in the short term, with returns of 3.5% over the past week and 5.7% over the past month. Over the last year, TORNTPHARM has gained nearly 28%, and over three years, the return is more than 128%. Despite some volatility, the stock has outperformed many of its peers and the broader market.
**Fundamental Trends**
Torrent Pharma’s India business, which constitutes the bulk of its revenue, grew by 12% in Q3 FY25, driven by strong performance in branded generics. However, the company faces challenges in international markets, particularly the US, due to regulatory headwinds and pricing pressures. Revenue growth over the past five years has averaged 7% annually, slightly below the industry average, but net income growth has been robust at over 30% per year, outpacing peers.
**Analyst Outlook**
Analysts have a moderately positive outlook, with a one-year price target averaging around ₹3,600, and a range between ₹2,959 and ₹4,200 . About 68% of analysts currently rate the stock as a buy.
**Dividend and Market Cap**
The dividend yield is 0.86%, which is above the sector average, and the company’s market capitalization is approximately ₹1.1 lakh crore, placing it among the larger players in the Indian pharmaceutical sector.
**Summary**
TORNTPHARM has demonstrated strong long-term price appreciation and profitability, but it is currently trading at a significant premium to its estimated intrinsic value. Short-term technicals are mixed, with some bullish undertones, but caution is warranted due to high valuation multiples. The company’s growth is primarily driven by its domestic business, while international operations face ongoing challenges. Analyst sentiment remains positive, but the upside may be limited unless earnings growth accelerates or valuation multiples contract.
MAXHEALTH Price Chart Analysis**Current Price and Recent Performance**
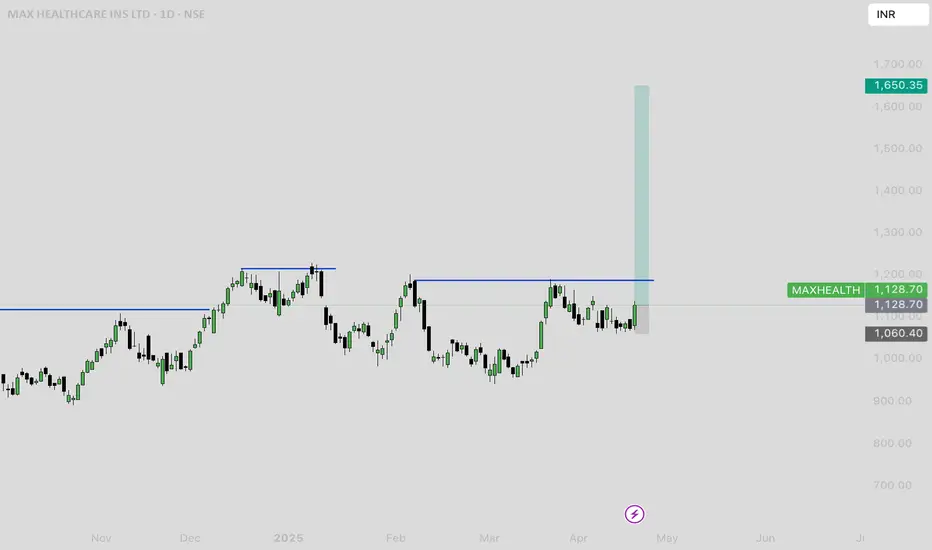
- As of the latest available data, Max Healthcare Institute Ltd (MAXHEALTH) is trading around ₹1,084.40, showing a 0.64% increase in the past 24 hours
- The stock hit a high of ₹1,095.00 and a low of ₹1,066.50 in the most recent trading session, with an average traded price of ₹1,075.13
- Over the past week, the stock is down by 0.97%, but it has risen 8.23% over the past month and 30.78% over the last year
**Historical Price Levels**
- MAXHEALTH reached its all-time high of ₹1,227.95 on January 8, 2025
- The all-time low was ₹97.15, recorded on November 12, 2020
**Analyst Forecasts and Valuation**
- Analyst price targets range from a minimum of ₹615.00 to a maximum of ₹1,390.00
- The stock is trading at a price-to-earnings (PE) ratio of 100.12 and a price-to-book (PB) ratio of 12.59, which is higher than the sector averages (sector PE: 47.87, sector PB: 6.12)
- Dividend yield is low at 0.14%
**Technical and Volatility Insights**
- MAXHEALTH is 2.61 times as volatile as the Nifty index, indicating higher price swings.
- The 50-day moving average (DMA) is at ₹1,062, suggesting the current price is above this technical support level.
MAXHEALTH's valuation is high compared to peers, reflecting strong investor expectations
**Fundamental Performance**
- Revenue has grown at a compound annual rate of 27.47% over the last five years, outpacing the industry average of 10.01%
- Net profit for FY 2023-24 was ₹687 crore, with a slight decline of 1.02% compared to the previous year, despite a 22.93% rise in revenue.
- Promoter and institutional holdings have remained stable in recent quarters
**Summary**
MAXHEALTH has demonstrated robust long-term price appreciation and revenue growth, with a recent pullback from its all-time high. The stock trades at a premium valuation relative to sector peers, reflecting high growth expectations. Technicals show the stock is above key moving averages, and volatility remains elevated. Analyst targets suggest a broad range of possible outcomes, with the consensus leaning toward further upside, but caution is warranted due to the high valuation and recent profit stagnation
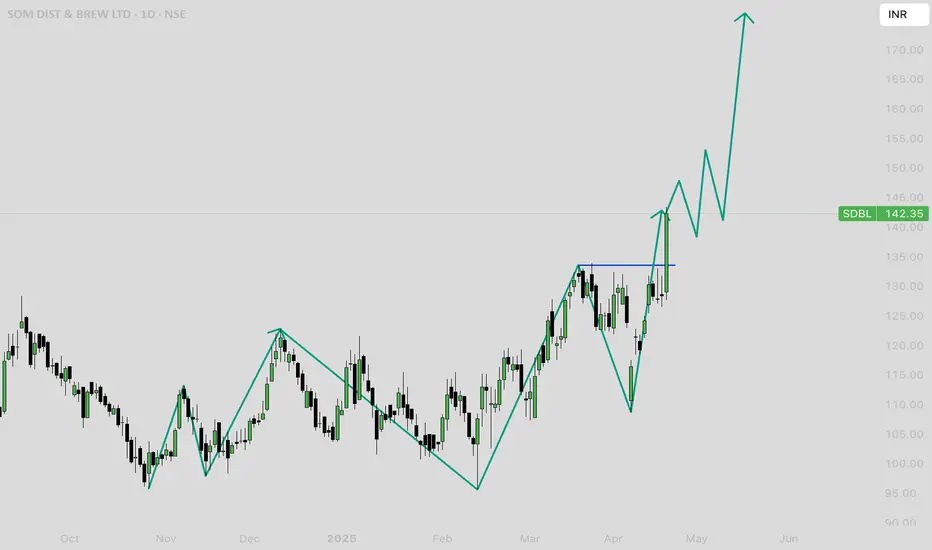
Som Distilleries & Breweries Ltd (SDBL) Price Analysis
- **Current Price:** ₹156.00 (all-time high as of April 22, 2025)
- **Day’s Range:** ₹127.66 – ₹143.40
- **Previous Close:** ₹128.38
- **Volume:** 13.36 million (well above 20-day average of 1.34 million)
- **52-Week Range:** ₹95.61 – ₹148.90 (new all-time high today)
- **VWAP:** ₹137.86
- **Market Cap:** ₹2,931 crore
### **Trend & Momentum**
- SDBL has surged sharply, breaking out to a new all-time high with exceptionally high volume, indicating strong bullish momentum
- The stock has rallied over 20% in a single session, moving far above recent resistance levels and its VWAP
- Technical patterns suggest a bullish formation with potential for further upside, possibly another 10% move, according to chartists
### **Support & Resistance**
- **Immediate Support:** ₹143.40 (today’s high), then ₹127.66 (today’s low), and ₹128.38 (previous close)
- **Resistance:** With a new all-time high at ₹156.00, the stock is in price discovery; next resistance will form as the stock trades higher
### **Valuation**
- **TTM PE:** 30.48 (sector PE: 88.54)
- **P/B:** 4.75
- **EPS (TTM):** ₹4.67 (+5.28% YoY)
- **Book Value per Share:** ₹30.02
### **Outlook**
- **Short-Term:** The breakout and volume spike suggest continued bullishness. However, after such a sharp rally, some profit booking or volatility is possible.
- **Medium-Term:** Sustained trade above ₹143–₹148 keeps the trend positive. Watch for consolidation near new highs before the next leg up.
- **Downside Risk:** If the stock falls below ₹143, it may retest support around ₹128–₹130
Piramal Pharma (PPLPHARMA) Stock Price Analysis**Piramal Pharma (PPLPHARMA) Indian Stock Price Analysis – April 22, 2025**
- **Current Price:** ₹220.70 (as of April 21, 2025)
- **Short-Term Trend:** Sideways to weak. The stock has been volatile, trading mostly between ₹217 and ₹225 in recent sessions
- **Recent Performance:**
- 1 week: +1.86%
- 1 month: +6.36%
- 3 months: –4.46%
- 1 year: +55.38%
- **Moving Averages:** The stock is above its 50-day moving average but below the 5-day, 20-day, 100-day, and 200-day moving averages, indicating mixed momentum and some weakness in the short term
- **Support:** ₹217
- **Resistance:** ₹225–₹231
- **Volatility:** High; the stock is 3.27x as volatile as the Nifty
- **Sector Comparison:** Underperforming its sector in the short term, but strong annual gains
- **Analyst View:** Mixed; some analysts suggest buying for the long term, but caution is warranted in the short term due to recent weakness
**Summary:**
PPLPHARMA has shown strong gains over the past year but is currently consolidating with a slight bearish bias. The price is range-bound, with support at ₹217 and resistance around ₹225–₹231. Watch for a breakout above resistance for renewed bullish momentum, or a drop below support for further downside risk

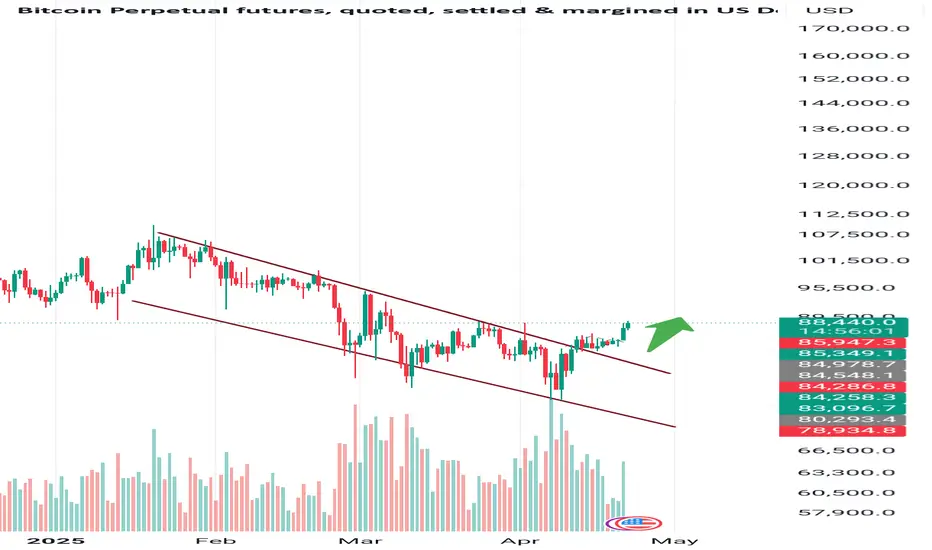
Bitcoin Daily Breakout – Trend Reversal in Play?BTCUSD | Breakout Alert!
Bitcoin has been trading within a downward channel on the daily chart, but today it has finally broken out to the upside with strong momentum. This breakout could signal the beginning of a bullish move. If the breakout sustains above key resistance levels, BTC has significant potential to move higher in the coming days. Keep an eye on the volume and price action for confirmation.
Targets & Key Levels:
Next Target: 110000++
Support: 80000
Stay cautious and manage your risk accordingly!
#BTCUSD #Bitcoin #CryptoBreakout #TechnicalAnalysis #CryptoTrading #BTC #CryptoCharts #BullishBreakout #PriceAction #TradingView
Dixon Technologies Bullish Bias 10% upsideThe Stock has been consolidating for a while
As visible from the RSI the stock has given a nice breakout from the range
The stock price was also falling and took support near 200day EMA zone
The price has reversed from the selling zone
3 days constant increase in the price and reversal with a W Breakout pattern
The overall sentiment looks really bullish for the counter
Also, the tariff pause shall be helping the business for a short term
Looks really bullish to me.
Caution: Trade as per your risk appetite.

SBI - Bullish Head and Shoulder patternState Bank of India (SBI) has completed the formation of a bullish inverse head and shoulders pattern on the daily chart — a strong technical indicator of trend reversal from bearish to bullish.
Neckline Breakout:
The pattern has confirmed a clean breakout above the neckline at ₹785, accompanied by rising volume, validating the breakout and signaling that buyers have taken control from sellers.
Support Structure:
Both the left and right shoulders of the pattern have been formed around the strong support zone of ₹725, further strengthening the reliability of this setup.
Candle Confirmation:
The head of the pattern was formed with a Morning Star candlestick pattern, a classic bullish reversal signal, reinforcing the likelihood of an upward move.
Volume Analysis:
During the formation of the head and shoulders pattern, volume was gradually declining, indicating healthy consolidation.
The volume spike at the breakout point adds conviction, showing renewed interest and participation by buyers.
Momentum & Moving Averages:
RSI (Relative Strength Index): RSI is trading above 60, indicating strong bullish momentum without yet entering overbought territory.
EMA Crossover: A bullish crossover has occurred, with the 20-day EMA crossing above the 50-day EMA, a classic trend continuation signal.
The positive slope of both EMAs supports a sustained uptrend.
Price Target & Risk Management:
Target (as per measurement rule): The price target is calculated by measuring the distance from the bottom of the head to the neckline and projecting that from the breakout point.
Estimated Upside Target: ₹880
Stop-Loss (SL) Options: Fixed SL: Below the right shoulder, around ₹730.
Trailing SL: Use the 50-day EMA to dynamically protect gains as the price moves higher.
Conclusion:
SBI is exhibiting a strong bullish setup, with confirmation from price action, volume, and momentum indicators. The inverse head and shoulders pattern breakout, supported by key technical signals like EMA crossover and RSI strength, indicates potential for a trend continuation to the upside. Long positions can be considered with a clear risk-reward structure.

SBIN Upside potential with a Bullish Bias The Bank Index has been performing since few days
Also structure level SBIN is poised for an upmove, it has a pattern Inverse Head & Shoulders which is a bullish pattern and with a significant upside technically
Suggested to Buy at CMP or wait to retrace at 780s zone
SL 750s zone
Target 870s zone

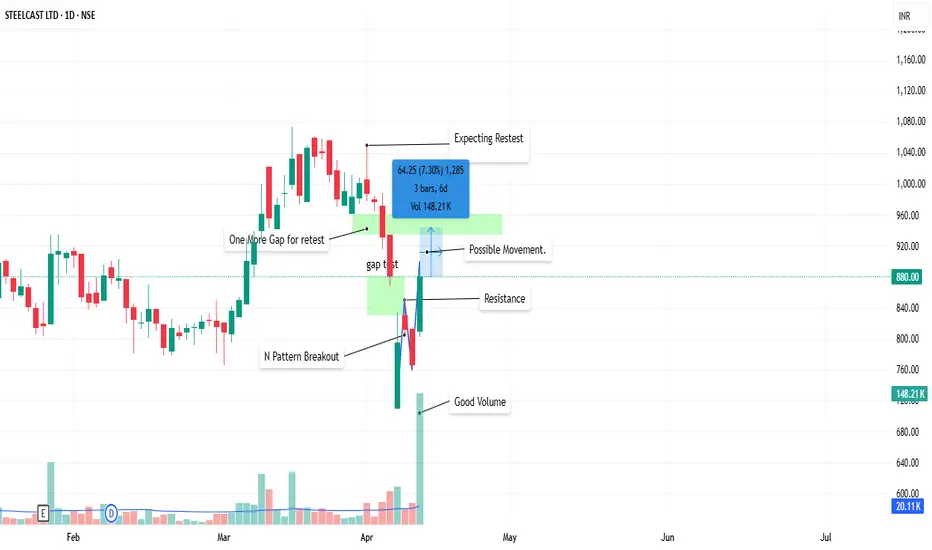
STEELCAS Good VolumeStock Analysis: Steelcast Ltd (NSE: STEELCAST)
Step 1: Chart Analysis & Price Action Assessment
Stock recently experienced a dramatic price swing, moving from approximately ₹900 to ₹1,070 in March, followed by a sharp decline to ₹720, and now rebounding to ₹880
Currently trading at ₹880, up 14.79% for the day with significant volume (148.21K)
Wide price bars in recent weeks indicate high volatility
Previous trading range between ₹820-₹920 from November 2024 to February 2025
Today's large green candle suggests strong buying interest after the recent decline
Step 2: Volume & Volatility Analysis
Current volume (148.21K) appears significantly higher than average
Volume spikes coincide with major price movements in September 2024, March 2025, and current bounce
Recent price action shows extreme volatility with large candles and wide price ranges
The sharp decline and subsequent rebound suggest possible shakeout pattern
Step 3: Phase Classification
The stock appears to be in a transitional phase with characteristics of both Stage 1 (Consolidation) and the beginning of potential Stage 2 (Accumulation) with these supporting factors:
The stock experienced a Stage 3 Explosive Growth phase in March 2025 (reaching ₹1,070)
Followed by a sharp correction (down to ₹720)
Current price action suggests potential accumulation with today's strong bounce on high volume
The previous base area (₹820-₹920) could serve as support for a new accumulation zone
Step 4: Final Summary & Recommended Action
Key Observations:
Trend Direction: Mixed - recent correction but showing signs of stabilization
Volume Behavior: Significant spike on today's rebound (148.21K)
Volatility: Extremely high with recent price swings of 30%+ in both directions
Support & Resistance Levels: Support around ₹800, Resistance at ₹920-₹950
Suggested Strategy:
The stock appears to be transitioning from a correction into a potential new accumulation phase, but requires confirmation.
Final Action Plan:
CAUTIOUS BUY - The strong bounce on high volume after a sharp decline suggests possible accumulation, but the volatile nature demands caution:
Consider a starter position if the stock maintains levels above ₹850
Add to the position if price stabilizes and forms a base, particularly if it can hold above the previous consolidation area (₹850-₹900)
Set stop-loss below today's low or around ₹800 to manage risk in case this is just a temporary bounce
Watch for continued higher volume on up days and decreased volume on down days to confirm accumulation
This stock shows characteristics of a potential bottoming pattern after a correction, but its high volatility requires disciplined position sizing and risk management.