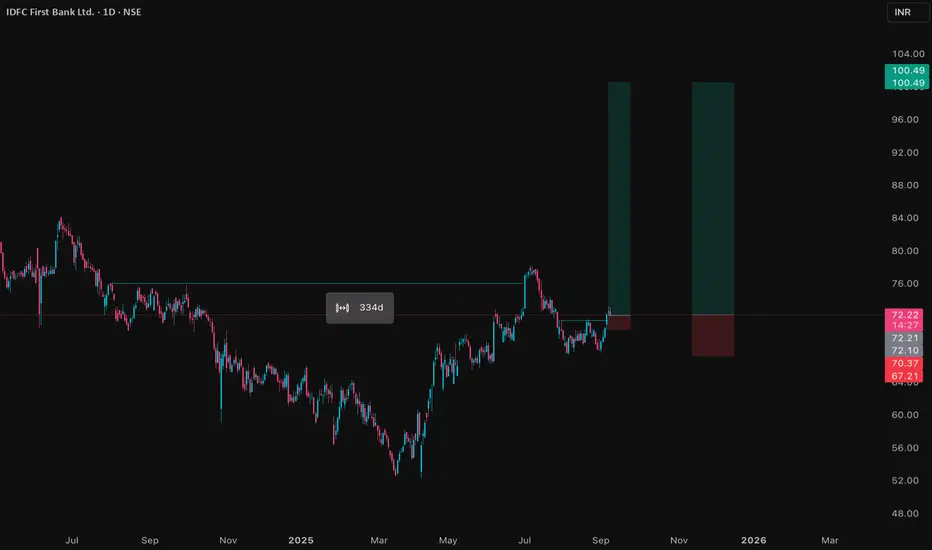
IDFCFIRSTB Price ActionIDFC First Bank is trading at ₹72.60 as of September 8, 2025, and maintains a solid presence in India’s private banking sector. The stock has a market capitalization near ₹53,264 crore, having seen an 8.7% gain over the last three months and a 25% rise over six months, while its year-on-year change is slightly negative. The share price is just below its 52-week high of ₹78.50, reflecting mild short-term consolidation after recent rallies.
Financially, IDFC First Bank continues to deliver growth: its annual operating revenue for FY25 approached ₹36,500 crore. Net interest margin remains strong at 5.6%, and the bank’s gross NPA ratio has declined to 1.87%, with net NPA at 0.53%, representing improved asset quality. Net profit for the previous year edged higher, and the latest quarter saw stable promoter holdings, a minor uptick in DII ownership, and balanced institutional participation.
The valuation remains elevated, with a price-to-earnings ratio of 40.78 and price-to-book near 1.4, as the market is factoring in future growth from retail advances, digital initiatives, and improving cost efficiencies. Technical indicators show the share trading above 50-day and 200-day averages, confirming ongoing bullish sentiment, and weekly stochastics point to strong price momentum. Dividend yield is modest but consistent, as the bank prioritizes growth and capital buffers.
Overall, IDFC First Bank offers a constructive outlook thanks to ongoing improvements in profitability, asset quality, and operational metrics. The bank is well-positioned for further gains if trends in retail lending, fee income, and digital channels remain favorable.
Bullishsetup
ZOTA Price ActionAs of September 3, 2025, Zota Health Care Limited is trading near ₹1,236. The stock has performed exceptionally well, gaining over 12% in the past month, 35% in three months, and more than 104% in one year. The price is near its 52-week high of ₹1,397, with the low for the same period at ₹535, underscoring significant volatility and appreciation.
Zota’s market capitalization is around ₹4,068 crore, classifying it as a small-cap company in the pharmaceutical sector. The company has reported strong operating revenue of ₹257 crore for the financial year ended March 2025, with sales and net profit showing solid growth rates. Key technical indicators (such as moving averages around ₹1,291 for the 5-day and ₹1,128 for the 50-day) show that the stock is currently well-supported by underlying market momentum.
Valuation metrics indicate a high price-to-earnings ratio, reflecting growth expectations already embedded in the share price. The company is not currently issuing dividends and maintains a robust financial position with stable equity capital. Near-term trading has seen the stock fluctuate between daily highs of ₹1,384 and lows of ₹1,337, with overall sentiment remaining positive due to continued sector expansion and operational progress.

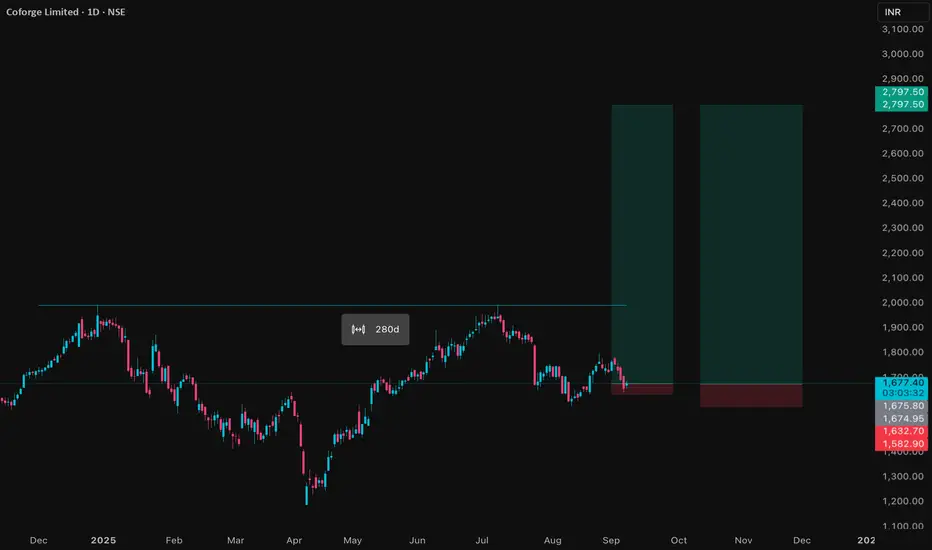
COFORGE Price AnalysisCoforge Ltd is trading near ₹1,675 as of September 8, 2025, undergoing mild recovery after a recent period of price consolidation. The stock’s market capitalization is around ₹56,000 crore, and average daily volume remains robust, reflecting solid institutional and retail participation. Coforge reached a 52-week high of ₹2,005 and a low of ₹1,194, highlighting significant volatility in the past year.
Recent quarterly revenue crossed ₹3,777 crore with net profit at ₹356 crore, showing resilience despite sector-wide macro uncertainties. Annual profit stood at ₹936 crore on a total income of ₹12,050 crore, as digital transformation and global IT services remain growth drivers. Operating profit margins are healthy and comparable to top industry peers, with cost controls and process efficiency supporting bottom-line growth.
Coforge trades at a price-to-earnings ratio above 50, reflecting the market’s expectation of future earnings growth. Technical indicators currently show support near ₹1,657 with minor resistance at ₹1,710; the stock is slightly below its 50-day moving average but well-supported over the medium term by improving fundamentals. The dividend yield is modest, as the company prioritizes reinvestment for expansion and client acquisition.
Overall, Coforge’s outlook is stable, bolstered by its diversified service portfolio, strong client relationships, and continued demand for IT and cloud services. Near-term swings may persist, but the stock remains attractive for investors seeking steady long-term growth within the IT sector.
TATAMOTORS Price ActionTata Motors is trading close to ₹1,028 as of September 8, 2025, retaining its strong uptrend following a year of robust price appreciation. The company’s market capitalization exceeds ₹3.6 lakh crore, underlining its position among India’s largest automotive manufacturers. After reaching new 52-week highs, the stock is experiencing healthy consolidation, with volumes remaining elevated—reflecting continued institutional and retail investor interest.
Recent quarterly earnings have showcased remarkable performance: net profits have doubled year-on-year, with total revenue growth driven primarily by the continued success of its passenger vehicles, electric vehicle segment, and global subsidiary Jaguar Land Rover. Operating margins are stable at healthy levels, as cost control and efficiency gains offset input price volatility. The EPS has consistently improved, confirming strengthening core profitability.
Technically, Tata Motors trades well above its key support levels and major moving averages, confirming bullish momentum. RSI and MACD oscillators indicate the trend is not overextended, and the stock remains attractive for both momentum and value investors. The company maintains prudent leverage and increasing free cash flow, ensuring capacity for capital expenditure, dividend payout, and strategic investments.
Long-term prospects are optimistic: Tata Motors is benefiting from shifts toward EVs, resilient domestic demand, and strong exports. The outlook is constructive, with potential for further capital gains, provided operational progress continues and sector tailwinds remain supportive.

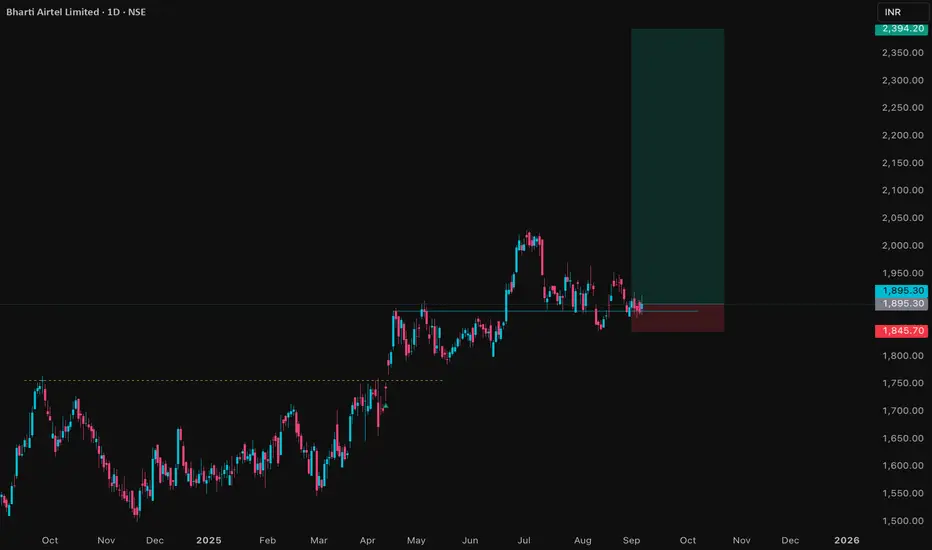
BHARTIARTL Price ActionBharti Airtel is trading near ₹1,887 as of September 8, 2025, maintaining its leadership position in India’s telecom sector with robust price performance and sector-beating fundamentals. The company’s market capitalization has surpassed ₹11 lakh crore, and it continues to deliver consistent growth in sales, profits, and shareholder value.
The most recent quarterly results showed net profit rising 43% year-on-year to ₹5,948 crore, fueled by a 28% surge in consolidated revenue. Average revenue per user (ARPU) climbed to ₹250, underlying the continued strength in data consumption and premium pricing. Operating profit margins have expanded, with latest EBITDA at ₹28,167 crore and an impressive 56.9% margin.
On the technical front, the stock trades above its 50-day and 200-day moving averages, indicating a sustained bullish trajectory. Return on equity is currently 23%, a result of effective capital allocation and profitability. Despite a slight dip in promoter shareholding, institutional confidence remains high with solid trading volumes.
Bharti Airtel remains focused on network expansion, digital services, and international growth, particularly its profitable Africa operations. Its sound balance sheet, controlled debt, and resilient free cash flow provide ample scope for ongoing investments and dividends. The outlook remains strongly positive, with the company well-positioned to capture further growth in India’s expanding communications market.
WCIL: Bullish Momentum After Demand Zone ReboundFollowing a rebound from a key demand zone in April, the price action of WCIL has entered a bullish trend, which is visually supported by an upward-sloping trendline on the chart. This trendline reflects a series of higher lows and higher highs, indicating sustained buying interest and positive momentum.
Between June and mid-August, the stock entered a consolidation phase, moving sideways within a defined range. Despite the pause in upward movement, the price continued to form higher lows and higher highs, which can be interpreted as a sign of accumulation rather than distribution.
Last week, the stock retraced to a previous higher high zone and managed to rebound once again, reinforcing the continuation of the bullish structure. This behaviour suggests that buyers are defending key levels and maintaining control of the trend.
From a momentum standpoint, the RSI on the daily chart is currently at 70, indicating that the stock is in the overbought zone. However, RSI readings in this range during strong uptrends can also suggest continued strength, especially if supported by volume.
Speaking of volume, there has been a noticeable increase in trading activity during the recent uptrend, which adds further confirmation to the bullish sentiment observed on the chart.
Based on this technical structure, the next potential long-term resistance level is identified near ₹171 , while a technical stop-loss level could be considered at a daily close below ₹103 , which aligns with a key support zone and trendline structure.
Disclaimer: This analysis is intended solely for educational and informational purposes. It does not constitute investment advice or a recommendation to buy, sell, or hold any financial instrument. Market conditions are dynamic, and trading decisions should be made based on individual research, risk tolerance, and consultation with a licensed financial advisor.

BSE Price ActionBSE Limited (Bombay Stock Exchange) is trading near ₹2,240 in early September 2025, showing strong upward momentum over the past year. The stock has benefited from surging trading volumes, higher listing activity, and overall expansion in the Indian capital markets, which have driven revenue and profit growth. Operating margins have widened, supported by rising technology investments and stable costs.
Valuations are elevated, with price-to-earnings and price-to-book ratios reflecting future growth expectations and premium market sentiment. BSE maintains a healthy balance sheet with low debt and strong cash reserves, enabling flexibility for further product innovation and operational scale. Technically, the stock is trading above key moving averages, with volume patterns supporting ongoing bullish sentiment. Periodic profit-taking may occur, but BSE’s robust fundamentals and sector leadership keep its outlook favorable for long-term investors.

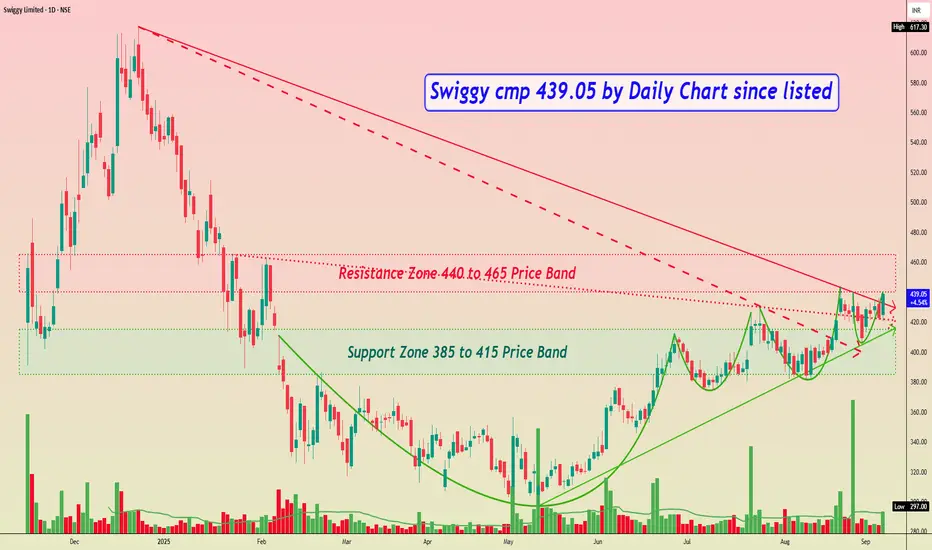
Swiggy cmp 439.05 by Daily Chart since listedSwiggy cmp 439.05 by Daily Chart since listed
- Support Zone 385 to 415 Price Band
- Resistance Zone 440 to 465 Price Band
- Rising Support Trendline well respected by Price momentum
- Bullish Cup and Handle followed by small Rounding Bottoms or a closely considerate VCP pattern
- Falling Resistance Trendline Breakout attempted with older Resistance Trendlines Breakout well sustained
- Volumes are spiking heavily at intermittent intervals and staying in close sync with the average traded quantity
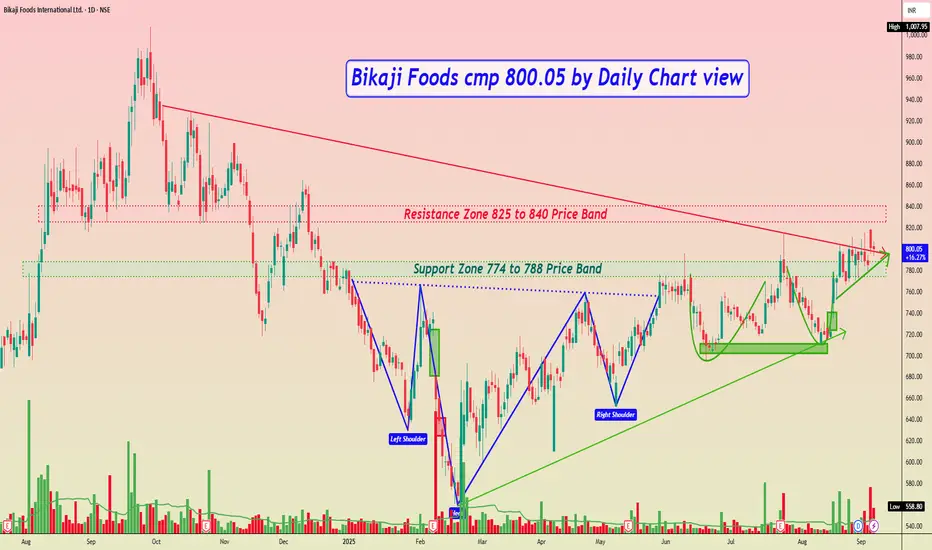
Bikaji Foods cmp 800.05 by Daily Chart viewBikaji Foods cmp 800.05 by Daily Chart view
- Support Zone 774 to 788 Price Band
- Resistance Zone 825 to 840 Price Band
- Pretty closely considerate Bullish Double Bottom formed
- Support Zone seems like going thru testing retesting mode
- Falling Resistance Trendline Breakout seems been attempted
- Price momentum seem respecting the Rising Support Trendlines
- Bullish Rounding Bottoms with Head & Shoulders below Support Zone
- Price Breakout will sustain after closure above Resistance Zone for few days
POCL Price ActionPondy Oxides & Chemicals Ltd. is trading near ₹1,257 as of today, marking a substantial rise from its yearly low of ₹493 and reaching a new 52-week high of ₹1,269. The company’s market capitalization is approximately ₹3,624 crore, and recent daily price action included a strong upward move over 10%. Volumes remain healthy, reflecting solid investor interest.
Financially, POCL has posted persistent revenue and profit growth, driven primarily by its leadership position in non-ferrous metal recycling and specialty chemicals. The business maintains strong operating margins and an efficient capital structure, allowing it to flexibly respond to rising sector demand. Its price-to-earnings ratio stands above 50, indicative of market confidence in future earnings expansion given favorable sector trends.
From a technical perspective, POCL is currently trading above both 50-day and 200-day moving averages, confirming bullish momentum. The company’s dividend yield remains modest, but its growth trajectory and strong asset base make it attractive for medium- and long-term investment outlooks. Near-term, some volatility may be present after the recent price spike, but overall sentiment and fundamentals remain robust.

SAGAR CEMENT BULLISH CHART DON'T HAVE TIME TO MANAGE YOUR TRADES?
Sagar Cement given good breakout. Its given breakout after good consolidation. It's given breakout after rounding pattern . We can see 5 -6% Upmove easily.
Take BTST trades at 3:25 pm every day
Try to exit by taking 4-7% profit of each trade
SL can also be maintained as closing below the low of the breakout candle
Now, why do I prefer BTST over swing trades? The primary reason is that I have observed that 90% of the stocks give most of the movement in just 1-2 days and the rest of the time they either consolidate or fall
Trendline Breakout in SAGCEM
BUY TODAY SELL TOMORROW for 5%

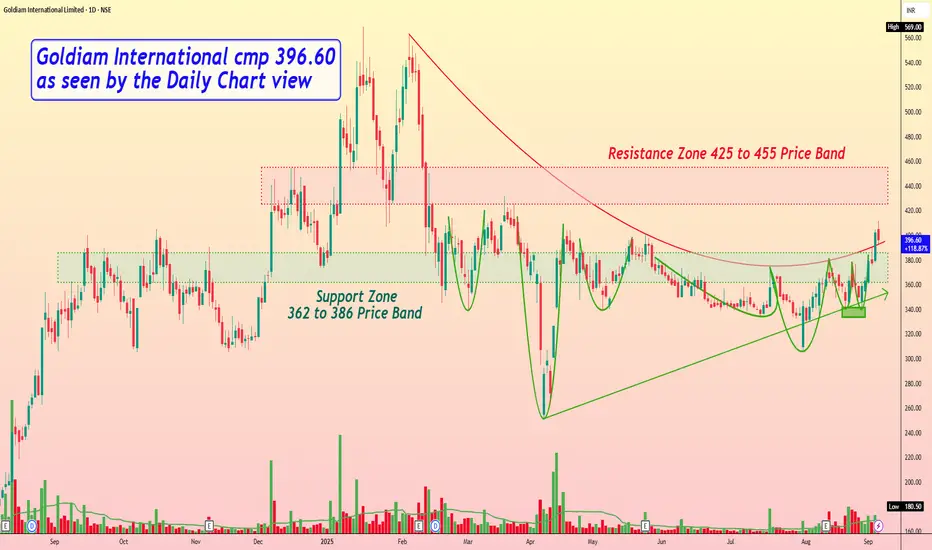
Goldiam International cmp 396.60 as seen by the Daily Chart viewGoldiam International cmp 396.60 as seen by the Daily Chart view
- Support Zone 362 to 386 Price Band
- Resistance Zone 425 to 455 Price Band
- Bullish "W" with Double Bottom formed at 340 price level
- Breakout attempted from Curved Falling Resistance Trendline
- Price momentum has well respected the Rising Support Trendline
- Volumes spiking above avg traded quantity over the past few weeks
- Multiple Bullish Rounding Bottoms formed around Support Zone neckline
- Majority of common Technical Indicator BB, EMA, MACD, RSI trending positively
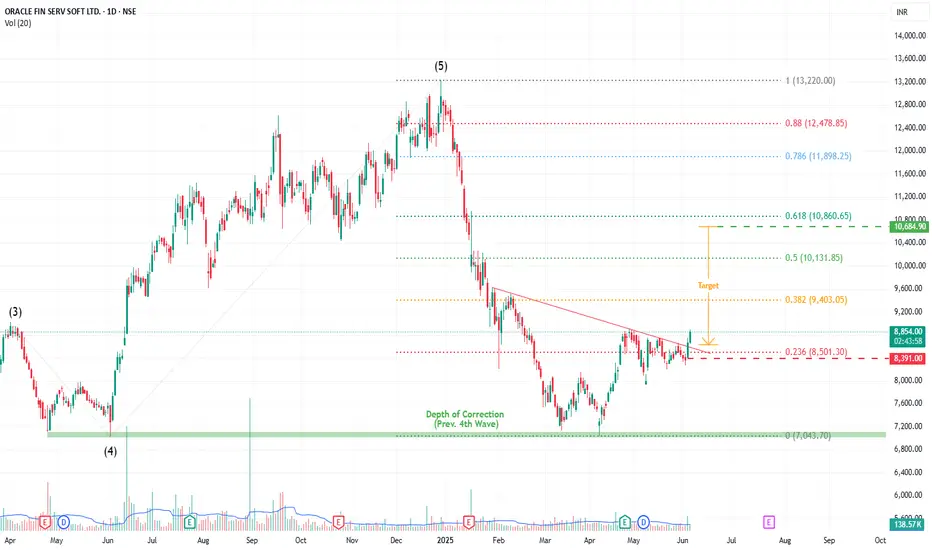
OFSS (ORACLE FIN SERVICE) By KRS Charts5th June 2025 / 12:35 PM
Why OFSS?
1. Fundamentally Good Company.
2. Technically, Bullish Stock for a long time and here again made higher low on bigger time frame.
3. Wave Theory vice it bounces back from 4th impulsive wave (Depth of Correction).
4. After that it has formed few bullish charts pattern like Invt. Head & Shoulder and Flag and Pole is also visible within.
5. Yesterday it Broke Neckline with good volume green candle.
Targets & SL (1D Closing Basis) is mentioned in Chart
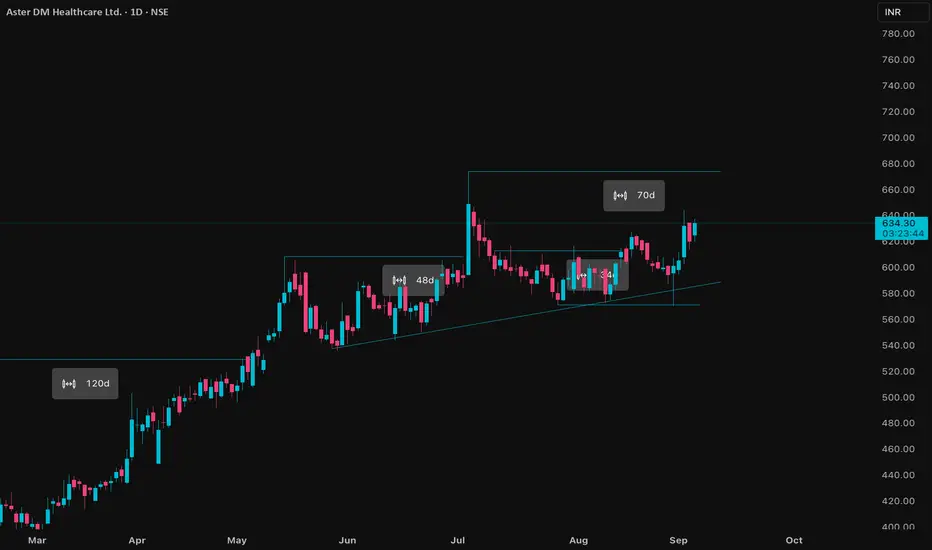
ASTERDM Price ActionAster DM Healthcare is trading around ₹632–₹634 as of September 4, 2025, and has shown solid resilience and upward movement over recent sessions. The company’s market capitalization stands at about ₹32,122 crore, and its current price-to-book ratio is roughly 9.4, reflecting growth expectations and sector strength.
Recent financial results highlight substantial improvement: Q1 FY26 revenue reached ₹1,078 crore, up 8% year-on-year, and consolidated net profit for the quarter is ₹85.52 crore, maintaining momentum following last year’s major gains from the strategic disposal of its Gulf business. The EBITDA margin for FY25 has strengthened, averaging 19.5%, due to increased patient volumes and operational efficiency. For the whole of FY25, revenue grew 12% to ₹4,138 crore, and net profit posted a strong jump to over ₹5,400 crore with strategic gains from the GCC business separation.
Balance sheet analysis shows rising book value and a stable asset base, indicating ongoing capital investment and sector expansion. Total expenses have grown moderately, while EBIT and PAT both reflect favorable YoY growth, with EBIT up 30% for the recent period. Trading volumes are steady, and the price action is currently above key moving averages, supporting a bullish technical outlook.
Aster DM Healthcare’s positive trend is backed by solid quarterly results, sector tailwinds, and strategic realignment of its international operations. Investors remain optimistic for further medium-term gains if the company sustains improved margins and expanding patient demographics.
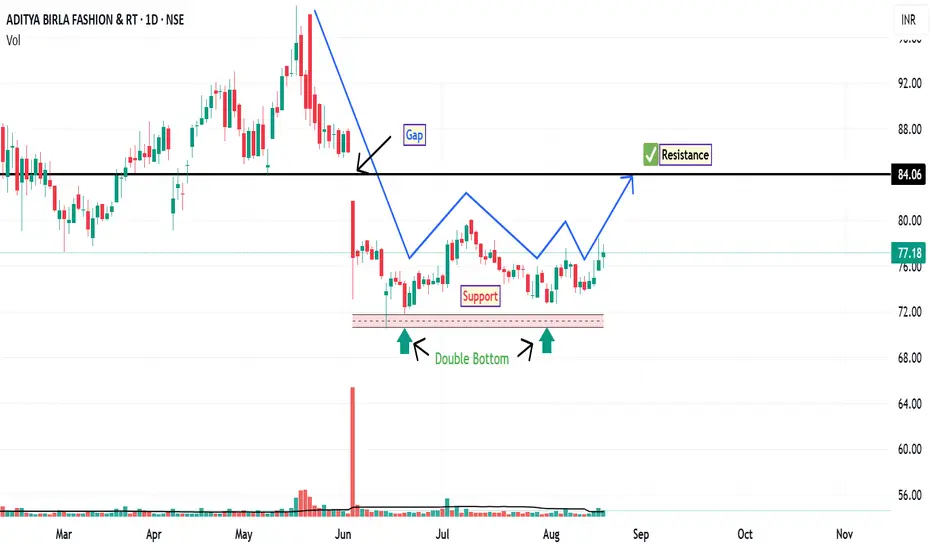
ABFRL: Price Action OverviewFollowing a gap-down opening on June 4, ABFRL entered a consolidation phase, trading within a well-defined supply and demand zone. This range-bound movement suggests a period of accumulation or indecision among market participants. During this consolidation, the stock has formed a double bottom pattern on the daily chart—a classical reversal structure that often indicates a potential shift from a downtrend to an uptrend, provided confirmation follows.
An inverted hammer appeared near the second bottom, signaling potential buying interest at lower levels. This was followed by a bullish pin bar, reinforcing the possibility of a short-term reversal. These candlestick formations, especially when occurring near support zones, can be interpreted as early signs of bullish momentum returning—though follow-through price action is essential.
If bullish momentum sustains than the stock may attempt to fill the gap left from the June 4 session. The gap resistance level is around ₹84 , which could act as a near-term target for traders monitoring this setup.
Disclaimer: This analysis is for educational and informational purposes only. It does not constitute investment advice or a recommendation to buy, sell, or hold any security. Always conduct your own research or consult a licensed financial advisor before making investment decisions.
SAIL (Bird view) By KRS Charts28th May 2025 / 10:17AM
Why SAIL??
1. As we can see from above chart, it clearly turning Bullish Trend stock from Berish .
2. Fundamentally its Durable and is at decent valuation right now.
3. Technically, in 1D TF fake selling and Gap Down is visible showing sellers got trapped. Such move market gives when they need liquidity, and this can happen both the side.
4. Further Bullish traits Sell candles volume is getting lower and allover lower than bullish candles. which usually noticed when Stock turned bullish on bigger cycles.
5. 100 EMA is underneath in many significant timeframes which also indicates buyers had shown more interest in past and likely this time as well.
Targets and Stop Loss is mentioned in Chart.
Note: This is 1M TF view will be Medium to Long Term

VINCOFE Price ActionAs of September 3, 2025, Vincofe Limited (Vintage Coffee and Beverages) is trading near ₹149, showing resilience and stable upward movement after reaching a 52-week high of ₹159.70 and bouncing from its yearly low of ₹75. The stock has delivered a 26% gain in the last month, though it has experienced weekly volatility averaging 5.3%, which is in line with industry norms.
Financially, Vincofe reported operating revenue of ₹308.52 crore for FY 2025, up 135% year-on-year, with profit after tax of ₹40.15 crore. Its EBITDA margin stands at 18.54%, reflecting efficient cost management, and net profit margin is significant for its sector. The company maintains a strong ROE at 17.28% and ROCE at 16.88%, demonstrating effective capital utilization. The price-to-earnings ratio (TTM) is 44.75, slightly below sector average, and the price-to-book ratio is high at 6.07, suggesting premium market expectations.
On the balance sheet side, Vincofe’s debt-to-equity ratio is 0.11, indicating low leverage and greater financial stability. Shareholding patterns show promoters hold 38.68%, with FII and DII gradually increasing their stakes—positive signals for institutional confidence.
Technically, the share is trading above its short- and long-term moving averages, retaining momentum; however, some consolidation and profit-taking are likely near resistance zones. The dividend yield is modest at 0.07%, as the company focuses capital on growth. Overall, Vincofe continues to demonstrate strong growth and solid fundamentals, supported by active investor interest and prudent financial management.

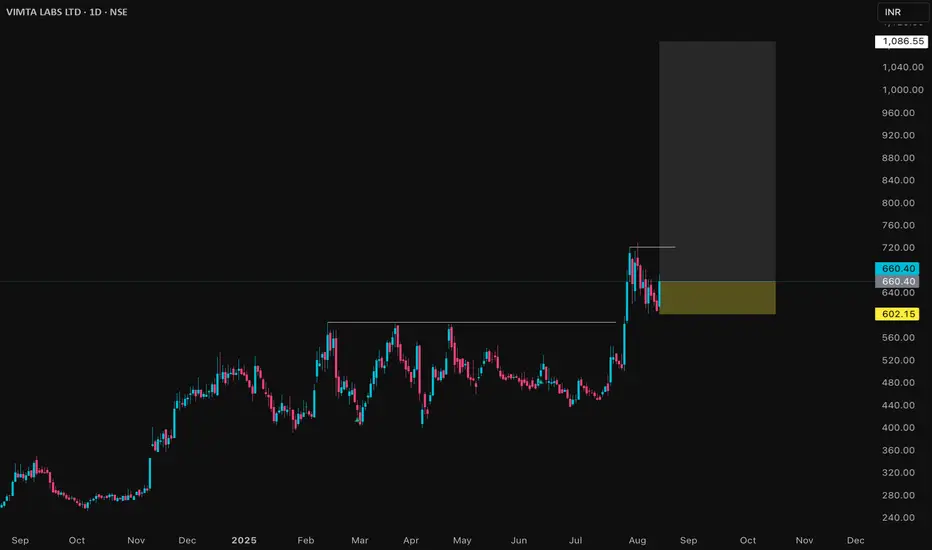
VIMTALABS Price Action## Vimta Labs Ltd – Price Analysis (August 2025)
### Price & Market Metrics
- Current share price is around ₹646–₹659 as of August 13, 2025.
- Market capitalization is approximately ₹2,900 crore.
- The 52-week price range is ₹241.30 (low) to ₹728.95 (high).
- The all-time high was ₹728.95 recorded in early August 2025.
- Recent price movement shows a strong rebound with gains around 6-7.5% over the past day.
### Returns & Volatility
- Over the last 1 year, the stock has surged by approximately 150-160%.
- The 6-month growth pace is about 14-16%.
- Weekly price moves have shown notable volatility, with recent declines around 7.5% in a short time frame.
- The stock exhibits moderate volatility consistent with strong recent price momentum.
### Valuation
- Price/Earnings (P/E) ratio is around 38.
- Price/Book (P/B) ratio is low, roughly 0.14 based on some sources, though others note around 3.6, indicating possible variation in book value interpretation.
- Dividend yield data is not prominent, indicating limited or no regular payout.
### Business & Fundamentals
- Vimta Labs is in the testing, inspection, and certification sector focused on quality control and laboratory testing services.
- The company benefits from growth in industrial and infrastructure sectors fueling demand for quality and compliance services.
- Recent market action indicates investor interest fueled by strong earnings growth expectations.
### Technical & Sentiment Overview
- The stock hit a fresh 52-week high recently but has shown some corrective pullbacks.
- Volume remains healthy reflecting active trading interest.
- The stock price is trading well above average levels, supported by positive market sentiment and sector tailwinds.
***
### Summary
Vimta Labs Ltd has exhibited a strong price rally in the past year with over 150% gains, reaching new highs in early August 2025. The current valuation by P/E stands elevated at about 38, reflecting growth optimism. The share price volatility is moderate but notable due to recent sharp moves. Market capitalization is close to ₹2,900 crore, with the stock trading near its peak levels. Investors should consider the premium valuation against ongoing growth prospects and sector dynamics, while monitoring for potential short-term price fluctuations or corrections.
Overall, Vimta Labs appears to be a growth-oriented stock with robust recent performance, but with valuation levels demanding careful risk assessment for new investors.
UNIVCABLES Price ActionUniversal Cables Limited is currently trading near ₹736 as of early September 2025, continuing its upward momentum from the past six months where the share price surged more than 46%. The stock has a 52-week high of ₹867 and a low of ₹408, showing substantial volatility but also strong resilience during the year. Market capitalization stands at about ₹2,550 crore, placing it firmly in the mid-cap segment for the cables and electricals industry.
The company reported outstanding financial results for Q1 FY26, with net sales rising to ₹600 crore—a 22% year-on-year increase. Profit after tax jumped nearly 489% year-on-year to ₹32.91 crore. Operating profits and margins have also expanded, powered by a rise in sales volumes and efficiency improvements. The earnings per share for the quarter was ₹9.50, reflecting a solid jump from the same period last year.
Valuation wise, Universal Cables carries a price-to-earnings ratio around 21 and a price-to-book ratio close to 0.72, which suggests it still trades at reasonable levels compared to sector averages. However, the debt-equity ratio has risen to 0.48, indicating the company is using more leverage, which may impact liquidity but is manageable for growth. Dividend yield remains modest, with a final dividend of ₹4 per share announced for the period.
Technically, the stock is in an uptrend, trading well above key moving averages, and volume patterns indicate strong trading interest. Near-term sentiment is positive, though some profit taking is possible around resistance zones near the recent highs. Universal Cables benefits from product diversity and sector demand, and if financial momentum continues, the outlook remains constructive for medium-term investors.

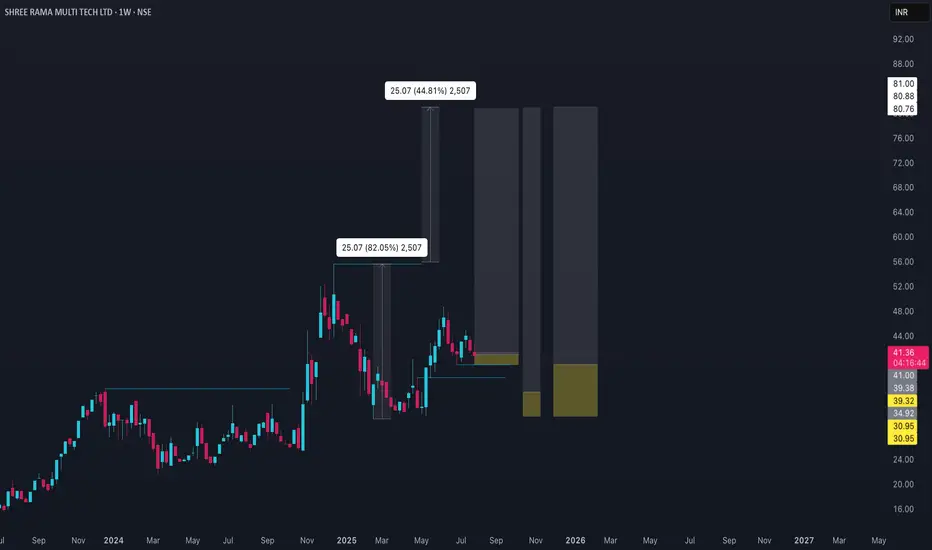
SHREERAMA Price ActionShree Rama Multi-Tech Ltd is currently trading around ₹41 as of late July to early August 2025. In the recent period, the stock has moved within a narrow range of ₹40.50–₹42.95, reflecting relatively low volatility. The short-term price trend appears positive, with upside targets ranging from ₹41.60 to ₹47.58 for the near-to-mid term. On the downside, support levels are seen near ₹40.06 and, more distantly, at ₹31.79 and below.
Fundamentally, the company has posted strong year-on-year sales growth, with March 2025 quarterly net sales up nearly 27% compared to the previous year. This operational momentum may be contributing to the positive sentiment around the stock, even as it consolidates near current levels. However, price targets over the next several months suggest modest gains rather than rapid appreciation, with resistance likely to emerge in the ₹44–₹48 range.
In summary, Shree Rama Multi-Tech Ltd offers a stable price trajectory with moderate upside potential. The outlook is supported by improved sales but tempered by significant resistance after the recent rally. The stock seems suitable for investors seeking gradual gains within the packaging sector, though the pace of growth may remain measured near term.
Liquidty is not so great yet, but stock is strong and trend is clearly up, now only thing is to find a right entry to catch our part of profit.
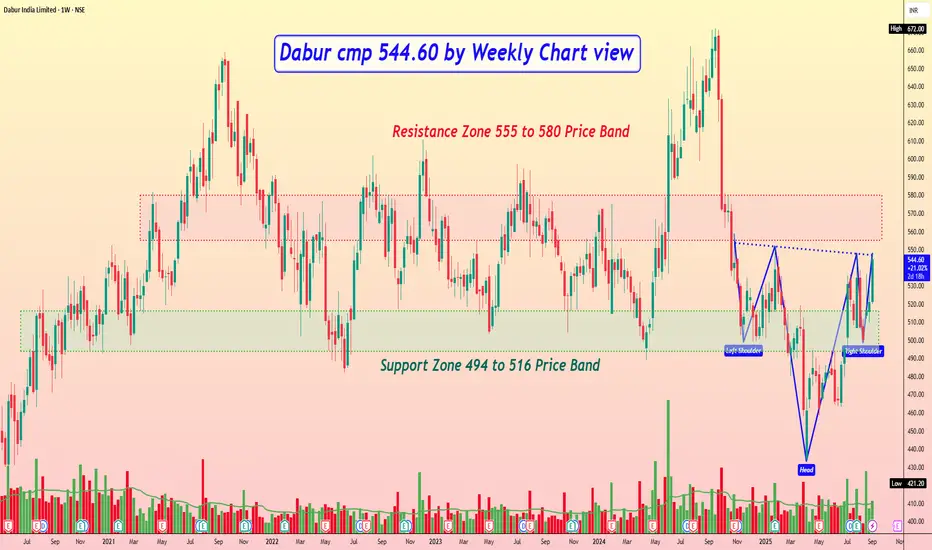
Dabur cmp 544.60 by Weekly Chart viewDabur cmp 544.60 by Weekly Chart view
- Support Zone 494 to 516 Price Band
- Resistance Zone 494 to 516 Price Band
- Breakout probable basis ongoing Support Zone test retest
- Closely considerate Bullish Head & Shoulders with Resistance Zone neckline
- Volumes are seen spiking well above average traded quantity over the past few weeks
- Favorably trending Technical Indicator signals shown by BB, EMA, MACD, RSI, SuperTrend
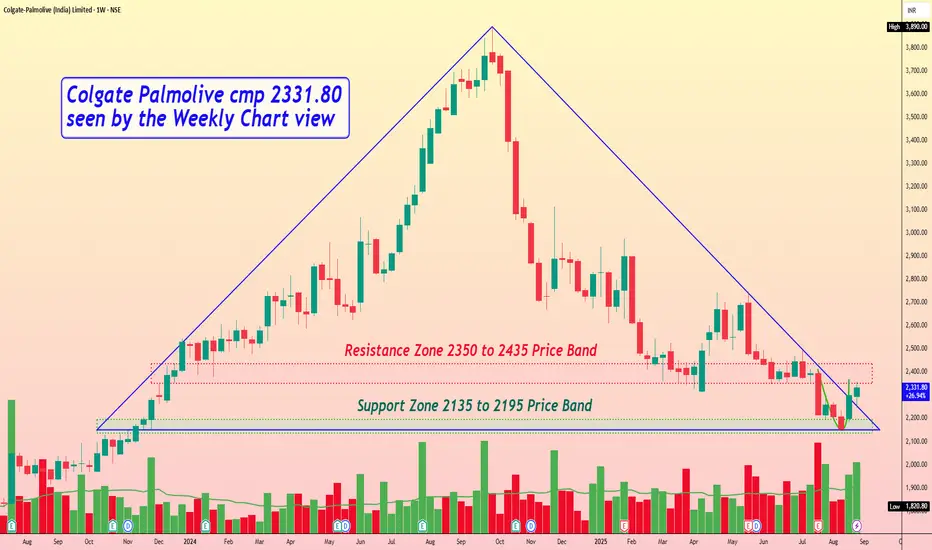
Colgate Palmolive cmp 2331.80 by Weekly Chart viewColgate Palmolive cmp 2331.80 by Weekly Chart view
- Support Zone 2135 to 2195 Price Band
- Resistance Zone 2350 to 2435 Price Band
- Triangle Breakout attempted by current stock chart technical setup
- Support Zone has been under testing retesting phase for the Support Zone
- Bullish Rounding Bottom on Weekly Chart and close Cup & Handle on Daily Chart
- Volumes are seen well in sync with the average quantity traded over the past few weeks
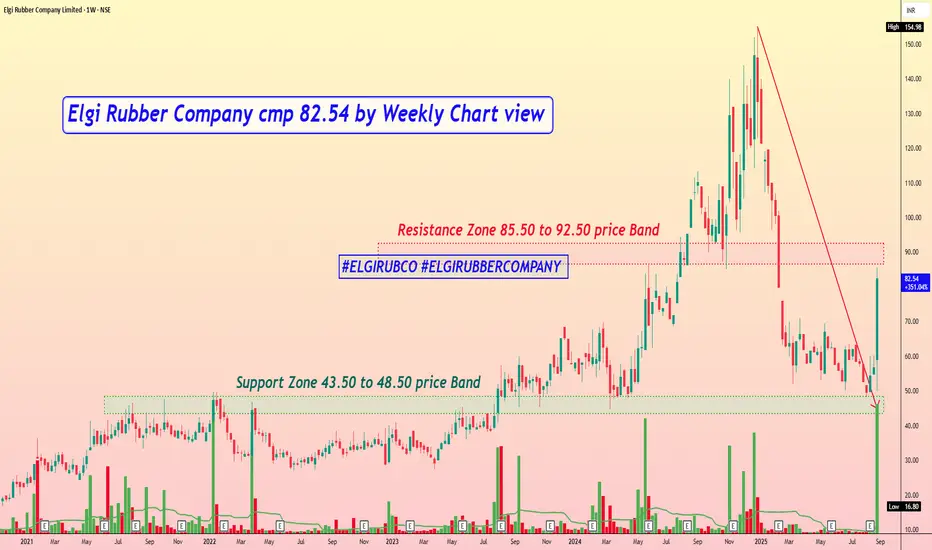
Elgi Rubber Company cmp 82.54 by Weekly Chart viewElgi Rubber Company cmp 82.54 by Weekly Chart view
- Support Zone 43.50 to 48.50 price Band
- Resistance Zone 85.50 to 92.50 price Band
- Price actively reversed from 4 years long past old Support Zone
- Heavy Volumes surged over the last week by demand based buying
- Falling Resistance Trendline Breakout sustained by bullish momentum
- Common Technical Indicators BB, EMA, MACD, RSI are trending positively