Eternal (Zomato) price action analysis for Feb-Mar 2026Analysis data: 26-Jan-26
Zomato had a good runup from 240 levels to 360 levels from May 2025 to Oct 2025.
Stock is currently at 258. It is likely to take support as buyers are expected in the 240-250 region again. However this time the targets would be 280, 290 & 300 levels.
Keep SL at 230
Happy Trading!
Buyondip

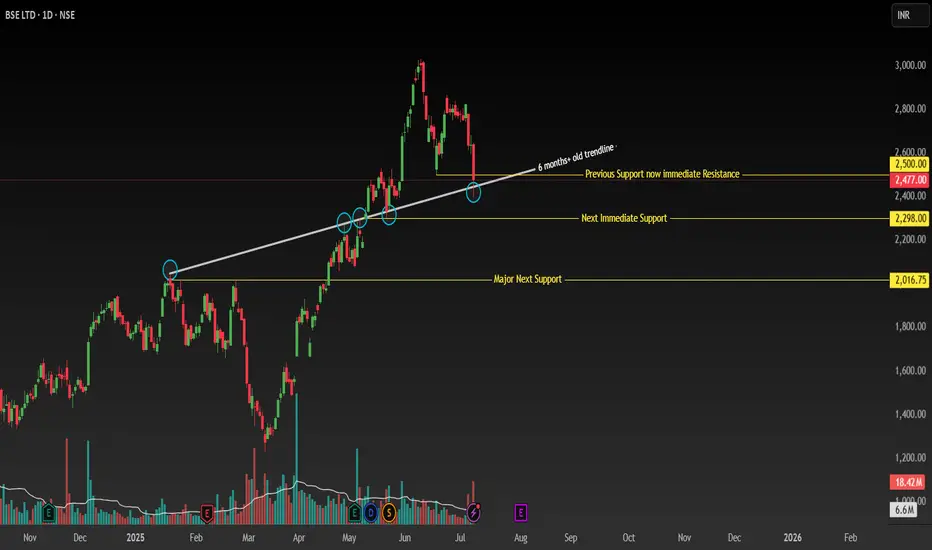
BSE - Support Break with Bullish Recovery SetupSymbol: BSE (Bombay Stock Exchange)
Timeframe: Daily
Key Levels:
✅ Breakdown: 2500 (closed below) → Next support: 2300 → 2000 (major).
✅ Bullish Anchor: Price > 200 MA + ascending trendline (Jan 20, 2025 breakout now support).
📊 Technical Structure
Critical Support Break:
-Daily close below 2500 (confirmed breakdown of key support).
-Next supports: 2300 (immediate) → 2000 (major swing low).
Bullish Anchors:
-Price above 200-day MA (long-term uptrend intact).
Ascending Trendline Support:
-Originating from Jan 20, 2025 (resistance until May 13 breakout).
-Now acting as dynamic support (resistance-turned-support).
Key Reversal Signal: Watch for reclaim of 2500
-Requires strong bullish candle + above-average volume.
-Confirms failed breakdown and resumption of uptrend.
🎯 Trading Plan
Scenario 1: Buy Dips (Conservative)
Entry Zone:
-Layer 1: 2300 (trendline + horizontal support confluence).
-Layer 2: 2000 (swing low + 200 MA reinforcement).
-Stop Loss: 1950 (below 2000 structure).
-Targets: 2500 → 2700 → 2900.
Scenario 2: Breakout Re-entry (Aggressive)
Trigger: Daily close above 2500 with: Bullish candle (preferably >1.5% gain).
-Volume ≥ 20% above 10-day average.
-Stop Loss: 2450 (below breakout level).
-Targets: 2700 → 2900 (measured move).
⚠️ Risk Management
Position Size: ≤3% capital per trade.
Invalidation Conditions:
-Close below 2000 (invalidates bullish thesis).
-Failed 2500 reclaim (weak volume/rejection candle).
Disclaimer: Not financial advice. Conduct your own due diligence. Past performance ≠ future results. Risk capital only.
🔥 Boost if this analysis helps your strategy!
💡 Comment below any stocks you want me to analyse next!
Investment option for long termClean Science forming a ultra dip accumulation zone. Best way of investing is buy on dip as and when it dips.
The target is the previous high when the IPO launched

POLYCAB - Ready for UptrendA beautiful Gap-Down has been created in the chart signifying a possibility for the market to move in an upward direction soon by the end of this week.
We can be bullish on it and hold on to our first target of about 9400-9457.
I am not SEBI Registered. Do your analysis before investing your hard-earned money.
My idea is to go long on this share.

Investment pick- Marksans pharmaMonthly chart analysis of Marksans pharma reveals a beautiful cup and handle breakout in the stock.
We have seen an ATH breakout already and a consolidation/retracement is bound to happen.
The stock is looking strong for multibagger returns with the best buy level for a positional trade is the range of 95-105
Keep this stock in your watchlist. For investment, stock can be added at CMP as well with buy on dips strategy.
Stock fundamentals:
Category-Midcap
Sector-Pharma
Industry-Pharma(Bulk drugs)
10 Year compounded profit growth:- 19%
Ratios at CMP:-
Stock PE:-19 ; Ind. PE:- 26
Debt to equity:- 0.07 (negligible)
ROCE:- 22%; ROE:-20% ; P/B:- 3.07; PEG:- 0.34

Chalet hotes IHNS breakoutChalet hotels has given an inverted head and shoulders breakout. Currently, stock is consolidating above the neckline.
A retest of 400-405 levels can give a good indication that the breakout is genuine and one can expect at least 100 points move which is the length of right shoulder. Long term targets can be 250+ points which is the length of the head.
SL is deep around 30 points at 375 levels.
Note:- Idea is shared only for educational purpose and should not be considered as a recommendation.

HDFC BANKHDFC BANK looking good for a long , with just 3% of SL max and a good reward if goes as expected , SL is tight and small and am expecting the bank to make new all time highs very sooner

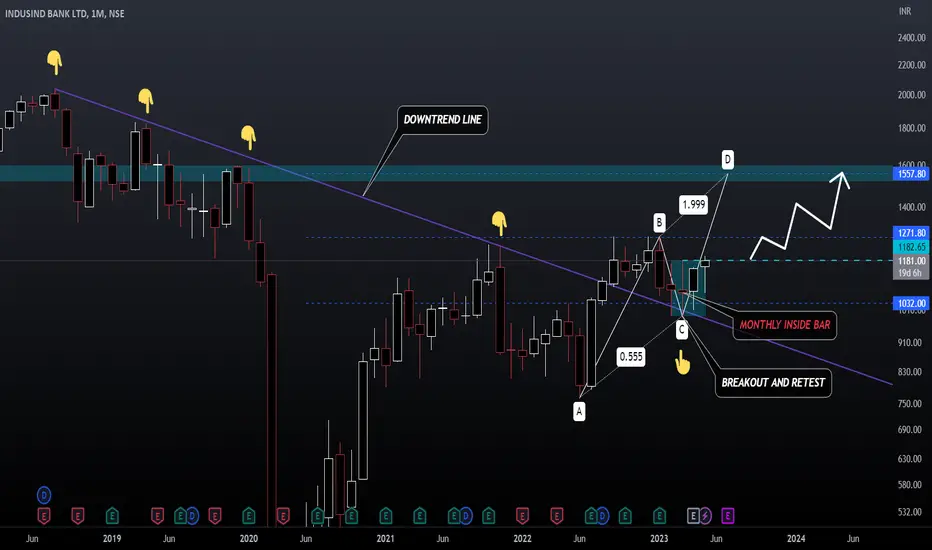
INDUSIND BANK INDUSIND BANK has broken out of its 5 year old downtrend line showing big buyers coming in the stock , retest of support is also done and the stock has formed a good inside bar candle in monthly time frame . Any breakout above the inside bar candle range will be a confirmation of upcoming rally in the stock , ie levels of 1180 , one can go long above this range if a weekly candle closes above it for targets of 1500 levels in medium to long term
VETOVETO:- at weekly strongly breakout with good volumes and also retest
keep on the radar. buy at current level
Hello traders,
As always, simple and neat charts so everyone can understand and not make it too complicated.
rest details mentioned in the chart.
will be posting more such ideas like this. Until that, like share and follow :)
check my other ideas to get to know about all the successful trades based on price action.
Thanks,
Ajay.
keep learning and keep earning.

Buy out the dip of 1350 in InfosysNSE:INFY is one the leading IT consultancy company which does not need any description. Infy recently broke 1360 levels. Investors might add this scrip in their portfolio at current levels. Also one can average out if we see 1300 levels.
No chart patterns are favourable
Nothing so called trend reversal
This is an effect of unfavourable market conditions
The rising dollar index
This might soon settle in near time and we might see 20% upside i.e 1600 levels. before the end of this year

EQUITAS HOLDINGS for swing tradeone can plan to buy above 106.80 as you can see we will get double confirmation of trendline and cup and handle pattern .
hope you liked it.
keep it simple
Disclaimer : we are not SEBI registered .all the content if for educational purpose only.
ELong

praj industries targets-450,470.hey guys!!
praj industries buy on breakout some qty add more after retest.
buy if close above 410.
do share for more.
hope you like it.
keep it simple.

DAAWAT for swing trade.Please do your own analysis before buying any stock.
buy after breakout some qty. add more qty on retest.
learn and earn.
hope you like it.
keep it simple.

Go long on any bullish candleWelspun India looks oversold + is in a very strong buyer's area go long on any bullish/green candle on daily time frame. Sl of 4 to 5 ruppes will be good for a swing trade .
WLong

SBI Life - Harmonic PatternSBI Life is a great stock in insurance sector. It has been beaten down due to the bearishness in global market. Whenever the global trend turns positive, we can expect SBI life to make significant up move, till then is can be bought in small quantities for long term.

Bajaj Finance - Harmonic PatternBajaj Finance can be bought at the marked level with long term view as it is fundamentally a strong stock which has the capability of doubling the money every 5 years. Expecting an reversal from the marked zone (i.e. 5910 - 6000)

ASHOK LEYLAND Parallel Channel Buy on DIPDip Levels: 115-120
Short term Target 1 :138
Short term Target 2 :145
Closing Above 145
Mid term Target 3 :152
Long term Target 4 :166-180
Note: This is for educational Purpose only.

Tata Power Analysis, a strong bearish trendI just started doing analysis, do comment if it lacks some learnings.
Tata Power has been In a bearish trend for the past couple of weeks. As the markets are also bearish, hold Tata Power for the long term as it gonna blast if it closes above the trend line breaking its bearish trend. Adopt buy on dip strategy and hold for the long term.

BUY HDFC BANK - SWING TRADEBuy HDFC Bank at 1545
Targets 1600, 1670++. Trail SL to avoid loss.
Small SL Below 1520 on closing basis
For Options and Big Capital Traders: Puts can be sold or At The Money Bullish Spreads can be created. Incase Sold Puts go in the money then settle by taking delivery of this stock.
PS: This is a good long term stock and can be accumulated at these levels.
Disclaimer: All charts are for educational purpose. Please consult your financial advisor before investing.

NAVIN FLUORINEAll levels marked on chart
Disclaimer: All charts are for educational purpose. Please consult your financial advisor before investing.

ALKYLAMINEAll levels marked on chart
Disclaimer: All charts are for educational purpose. Please consult your financial advisor before investing.

Hero MotoCorp -Falling Wedge Break & RetestTargets:
Target 1: 2860
Target 2: 2950
Target 3: 3060
Target 4: 3200
Target 4: 3400
Buy on DIP after each Targets
Note: This is for educational Pirpose only.

CANFINHOMESPlease Go through the charts.
Every Small details are covered.
#trade_like_pro
#investing_like_pro
